Title 40 CFR
Part 191
Subparts B and C
Compliance Recertification
Application
for the
Waste Isolation Pilot Plant
Appendix IGP-2009
Individual and Groundwater
Protection Requirements
United States
Department of Energy
Waste Isolation Pilot Plant
Carlsbad Field Office
Carlsbad, New Mexico
Appendix IGP-2009
Individual and Groundwater
Protection Requirements
IGP-2.0 Individual Protection Requirements
IGP-2.1 Compliance Assessment of Undisturbed Performance
IGP-2.3 Dose Calculation Results
IGP-2.4 Statistical Assessment
IGP-2.6 Summary of Compliance with the Individual Protection Standard
IGP-3.0 Groundwater Protection Requirements
IGP-3.1 Criteria for USDW Determination
IGP-3.1.1 Groundwater Quantity
IGP-3.2 Comparison with USDW Determination Criteria
IGP-3.3 Comparison with the National Primary Drinking Water Standards
IGP-3.3.2 Combined 226Ra and 228Ra
IGP-3.3.3 Gross Alpha Particle Activity Including 226Ra But Excluding Radon and U
Figure IGP-1. Conceptual Transport Pathway
Figure IGP-2. Locations of Recent Culebra Wells and Shallow Piezometers
Table IGP-4. Calculated Maximum Annual Committed Effective Doses for the CCA Evaluation
Table IGP-5. Persons Per Household and Water Consumption Values Used in the CCA
Table IGP-6. Persons Per Household and Water Consumption Values Used in the CRA-2004
Table IGP-7. Persons Per Household and Water Consumption Values Used in the CRA-2009
Table IGP-8. Data Obtained from Recent Culebra Wells
Table IGP-9. Total Inventory and Mass Loading of 226Ra and 228Ra Reported in the CRA-2004
% percent
An actinide
CARD Compliance Application Review Document
CCA Compliance Certification Application
CH-TRU contact-handled transuranic
Ci curies
Ci/L curies per liter
CRA Compliance Recertification Application
DOE U.S. Department of Energy
EPA U.S. Environmental Protection Agency
FEPs features, events, and processes
gpd gallons per day
gpm gallons per minute
IMC International Minerals and Chemical
kg/m3 kilogram per cubic meter
km kilometers
LWB Land Withdrawal Boundary
MB Marker Bed
mg/L milligrams per liter
mi mile
mrem millirem
PA performance assessment
PAVT Performance Assessment Verification Test
pCi/L picocuries per liter
ppm parts per million
RH-TRU remote-handled transuranic
SNL Sandia National Laboratories
TDS total dissolved solids
TRU transuranic
UP undisturbed performance
USDW underground source of drinking water
WIPP Waste Isolation Pilot Plant
WQSP water quality sampling program
Am americium
Pu plutonium
Ra radium
Th thorium
U uranium
The quantitative release limits set forth in the Containment Requirements provisions of 40 CFR § 191.13 (U.S. Environmental Protection Agency 1993) are one of three long-term numerical performance requirements contained in 40 CFR Part 191 Subparts Band C. The Waste Isolation Pilot Plant (WIPP) must also comply with two other quantitative performance standards contained in the individual protection requirements (40 CFR § 191.15, U.S. Environmental Protection Agency 1993) and groundwater protection requirements (Part 191 Subpart C). This appendix describes the U.S. Department of Energy’s (DOE’s) demonstration of compliance for the WIPP with both the individual and groundwater protection requirements.
In performing the compliance assessment for the Compliance Certification Application (CCA) (U.S. Department of Energy 1996), the CCA Performance Assessment Verification Test (PAVT) (Dials 1997a), the 2004 Compliance Recertification Application (CRA-2004) (U.S. Department of Energy 2004), and the CRA-2009, the DOE applied a bounding-analysis approach using conservative assumptions that overestimate potential doses and contaminant concentrations. To provide added assurance, the DOE assumed the presence of an underground source of drinking water (USDW) in close proximity to the WIPP Land Withdrawal Boundary (LWB), even though available data indicate that none exists near the boundary. Using this very conservative approach, the maximum potential dose to an individual is 0.032 millirems (mrem) in the CCA PAVT and 0.93 mrem for the CCA evaluation (as revised, consistent with EPA direction). Both values are well below the individual protection standard [40 CFR § 191.15(a)] of 15 mrem as an annual committed effective dose. In addition, the estimated potential maximum combined radium-226 (226Ra) and 228Ra concentration in groundwater is 0.49 picocuries per liter (pCi/L) in the CCA PAVT and 0.14 pCi/L in the CCA Performance Assessment, both well below the acceptable standard of 5 pCi/L required by 40 CFR § 191.24(a)(1) (Dials 1997a).
This conservative approach also assumes that all contaminants reaching the accessible environment are directly available to a receptor. The analysis bounds potential impacts of underground interconnections among bodies of surface water, groundwater, and any USDW.
In support of its initial recertification effort (the CRA-2004), the DOE reexamined concentrations of radionuclides that could potentially reach the accessible environment under undisturbed conditions. The CRA-2004 evaluation shows that the maximum concentration of radionuclides reaching the boundary is projected to be six orders of magnitude less than the maximum concentration projected in the CCA, as discussed in Section IGP-2.1. Based on this and additional, updated information presented in the CRA-2004, Chapter 8.0, the DOE concluded that the project continued to comply with the individual and groundwater protection provisions of Part 191 Subparts B and C.
In support of the CRA-2009, the DOE has reexamined concentrations of radionuclides that could potentially reach the accessible environment under undisturbed conditions. The CRA-2009 analysis shows that the maximum concentration of radionuclides reaching the boundary is projected to be an order of magnitude less than the maximum concentration projected in the CCA. Based on this and additional information updated for the CRA-2009 evaluation, the DOE concludes that the WIPP continues to comply with the individual and groundwater protection provisions of Part 191 Subparts B and C.
The individual protection requirements are contained in section 191.15 of the long-term disposal regulations. Section 191.15(a) requires
Disposal systems for waste and any associated radioactive material shall be designed to provide a reasonable expectation that, for 10,000 years after disposal, undisturbed performance of the disposal system shall not cause the annual committed effective dose, received through all potential pathways from the disposal system to any member of the public in the accessible environment, to exceed 15 mrems (150 microsieverts).
Undisturbed performance (UP) is defined in Part 191 Subpart B to mean “the predicted behavior of a disposal system, including consideration of the uncertainties in predicted behavior, if the disposal system is not disrupted by human intrusion or the occurrence of unlikely natural events” (40 CFR § 191.12, U.S. Environmental Protection Agency 1993). The CCA and CRA-2004 Chapter 6.0, Section 6.3.1 provide a description of UP, the conceptual models associated with UP, and the screening of features, events, and processes (FEPs) that are important to UP.
The method used to evaluate compliance with the individual protection requirements is related to that developed for assessing compliance with the containment requirements. If the evaluation of the UP scenario considered for the containment requirements shows contaminants will reach the accessible environment, the resulting dose to exposed individuals must be calculated and compared to the 15-mrem annual committed effective dose specified in section 191.15.
Further guidance on the implementation of the individual protection requirements is found in 40 CFR Part 194. 40 CFR § 194.51 (U.S. Environmental Protection Agency 1996) states,
Compliance assessments that analyze compliance with § 191.15 of this chapter shall assume that an individual resides at the single geographic point on the surface of the accessible environment where that individual would be expected to receive the highest dose from radionuclide releases from the disposal system.
40 CFR § 194.52 (U.S. Environmental Protection Agency 1996) states,
In compliance assessment that analyze compliance with § 191.15 of this chapter, all potential exposure pathways from the disposal system to individuals shall be considered. Compliance assessments with part 191, subpart C and § 191.15 of this chapter shall assume that individuals consume 2 liters per day of drinking water from any underground sources of drinking water in the accessible environment.
In addition, 40 CFR § 194.25(a) (U.S. Environmental Protection Agency 1996) provides criteria related to the assumptions that should be made when undertaking dose calculations:
Unless otherwise specified in this part or in the disposal regulations, performance assessments and compliance assessments conducted pursuant to the provisions of this part to demonstrate compliance with § 191.13, § 191.15 and part 191, subpart C shall assume that characteristics of the future remain what they are at the time the compliance application is prepared, provided that such characteristics are not related to hydrogeologic, geologic or climatic conditions.
Section 194.52 specifies that compliance assessments shall consider “all potential pathways from the disposal system to individuals.” The DOE has considered the following potential pathways for groundwater flow and radionuclide transport:
· Existing boreholes, as required by 40 CFR § 194.55(b)(1) (U.S. Environmental Protection Agency 1996)
· Potential boreholes, including those that may be used for fluid injection, as required by 40 CFR § 194.32(c) (U.S. Environmental Protection Agency 1996) and 40 CFR § 194.54(b)(2) (U.S. Environmental Protection Agency 1996)
After considering all of these pathways, the DOE found that contaminated brine may migrate away from the waste-disposal panels if pressure within the panels is elevated by gas generated from corrosion or microbial degradation. Two credible pathways by which radionuclides could reach the accessible environment have been identified.
1. Radionuclide transport may occur laterally, through the anhydrite interbeds toward the subsurface boundary of the accessible environment in the Salado Formation.
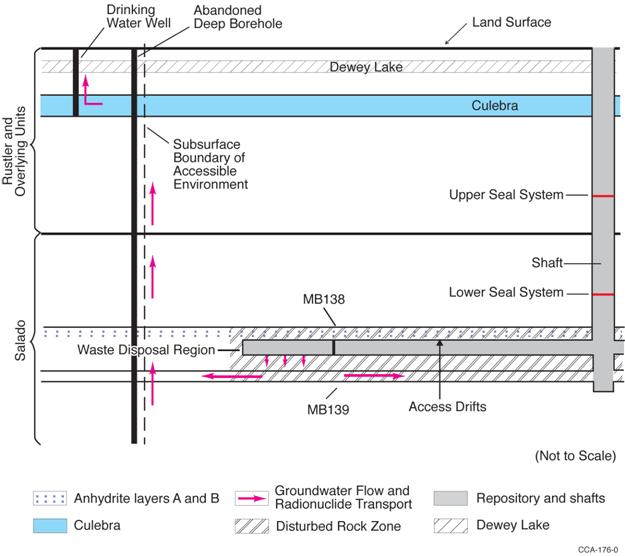
2. Transport may occur through access drifts or anhydrite interbeds (primarily Marker Bed [MB] 139) to the base of the shafts. If the pressure in the panels is greater than the lithostatic pressure of the overlying strata, contaminated brine may migrate up the shafts. As a result, radionuclides may be transported directly to the ground surface or laterally away from the shafts, through permeable strata, such as the Culebra Dolomite Member of the Rustler Formation (hereafter referred to as Culebra), toward the subsurface boundary of the accessible environment.
These conceptual release pathways for UP are illustrated in Appendix PA-2009, Figure PA-8. The modeling system described in the CCA; the CRA-2004, Chapter 6.0, Section 6.4; and Appendix PA-2009, Section PA-2.3.1 does not preclude potential radionuclide transport along other pathways, such as migration through Salado halite. However, the natural properties of the undisturbed system make radionuclide transport to the accessible environment via these other pathways unlikely.
Although both pathways are possible, the PA modeling indicates that under undisturbed conditions, only the first is a potential pathway during the 10,000-year period of interest specified in the regulation (see Appendix PA-2009, Section PA-7.2).
The DOE has used the modeling system applied to the PA to make this determination. Scenario screening for the UP is described in Appendix SCR-2009. As specified by section 194.54(b)(2), Appendix SCR-2009identifies activities that may occur in the vicinity of the disposal system prior to or soon after disposal, and documents which of these are included in the compliance assessment calculations. The CRA-2004, Chapter 6.0, Section 6.2, Table 6-8 identifies FEPs included in the UP modeling; these FEPs remain unchanged for the CRA-2009. The CRA-2004, Appendix PA, Attachment SCR also identifies FEPs that were considered, but are not included, in the modeling evaluation and the reasons for their elimination; this information is also unchanged for the CRA-2009.
As specified by 40 CFR § 194.55(a), uncertainty in the performance of the compliance assessment is documented in the CRA-2004, Chapter 6.0, Section 6.1.2. Probability distributions for uncertain disposal system parameter values used in the compliance assessment were developed and are documented in Fox (2008), which identifies sampled parameters used in the compliance assessment for the CRA-2009.
For the CCA compliance assessment, the CRA-2004 compliance assessment, and the CRA-2009 compliance assessment, 300 realizations of the modeling system were generated to evaluate UP. These 300 realizations are composed of three sets of 100 realizations, each generated using the Latin hypercube sampling method. In all three of the evaluations, none ofthe 300 realizations show any radionuclides reaching the top of the Salado through the sealed shafts.
In the CCA evaluation, 9 of the 300 realizations show concentrations of radionuclides greater than 0 reaching the accessible environment through the anhydrite interbeds. None of the remaining 291 realizations show radionuclides reaching the accessible environment through the anhydrite interbeds during the 10,000-year period (a realization is considered to have a 0 release if it is less than 1 × 10-18 curies per liter [Ci/L]). The maximum concentrations of radionuclides calculated by the modeling evaluation as reaching the accessible environment in the nine nonzero CCA realizations are shown in Table IGP-1. The full range of estimated values for radionuclide concentrations in the CCA evaluation is from zero to the values shown in Table IGP-1. The maximum concentration values shown in Table IGP-1 occur 10,000 years after the time of decommissioning.
The maximum concentrations of radionuclides calculated by the CRA-2004 evaluation to reach the accessible environment are shown in Table IGP-2. In the CRA-2004 evaluation, only 1 of the 300 realizations shows concentrations of radionuclides greater than 0 reaching the accessible environment through the anhydrite interbeds (see the CRA-2004, Appendix PA, Section PA-7.2). The remaining 299 realizations show no radionuclides reaching the accessible environment during the 10,000-year period. The reduction in the number of realizations showing radionuclides reaching the accessible environment is due to changes in the BRAGFLO grid and enhancements to the PA modeling system that increased model accuracy and decreased numerical dispersion.
In this single CRA-2004 realization, only one radionuclide has a nonzero concentration reaching the accessible environment. The radionuclide plutonium-239 (239Pu) has a concentration of 2.53 × 10⁻¹⁸ Ci/L (Garner 2003). This compares with the maximum concentration of 239Pu calculated for the CCA evaluation of 5.85 × 10⁻¹² Ci/L. The concentration of 239Pu in the CRA-2004 evaluation is six orders of magnitude lower than that shown for the CCA evaluation. In the CRA-2004 evaluation, no other radionuclides are calculated in concentrations greater than the 10-18 cutoff, whereas americium-241 (241Am), uranium-234 (234U), and thorium-230 (230Th) all had concentrations exceeding the cutoff in the CCA. Because the CRA-2004 evaluation shows only one radionuclide contributing to a potential dose, and the concentration is six orders of magnitude lower than that shown for the CCA evaluation, the CCA dose estimates are bounding. No new dose calculations were necessary.
Table IGP-1. Maximum Concentrations of Radionuclides Within the Salado Interbeds at the Disposal System Boundary for the CCA Analysis
|
CCA |
Maximum Concentrations (Ci/L) |
|||||
|
Vector No.a |
241Am |
239Pu |
238Pu |
234U |
230Th |
|
|
1 |
Replicate 1 |
1.36 ´ 10-17 |
4.33 ´ 10-12 |
Negligibleb |
5.82 ´ 10-13 |
2.10 ´ 10-14 |
|
2 |
Replicate 2 |
Negligible |
5.13 ´ 10-14 |
Negligible |
6.77 ´ 10-15 |
1.89 ´ 10-17 |
|
3 |
Replicate 2 |
Negligible |
1.35 ´ 10-15 |
Negligible |
1.65 ´ 10-16 |
7.00 ´ 10-18 |
|
4 |
Replicate 2 |
1.32 ´ 10-17 |
7.18 ´ 10-14 |
Negligible |
9.76 ´ 10-15 |
9.36 ´ 10-16 |
|
5 |
Replicate 2 |
Negligible |
6.23 ´ 10-18 |
Negligible |
Negligible |
Negligible |
|
6 |
Replicate 2 |
Negligible |
5.20 ´ 10-16 |
Negligible |
7.40 ´ 10-17 |
Negligible |
|
7 |
Replicate 3 |
3.50 ´ 10-18 |
3.08 ´ 10-13 |
Negligible |
4.32 ´ 10-14 |
1.07 ´ 10-16 |
|
8 |
Replicate 3 |
5.98 ´ 10-17 |
7.41 ´ 10-14 |
Negligible |
9.09 ´ 10-15 |
2.30 ´ 10-15 |
|
9 |
Replicate 3 |
5.42 ´ 10-17 |
5.85 ´ 10-12 |
Negligible |
7.61 ´ 10-13 |
4.68 ´ 10-15 |
|
10-300 |
— |
Negligible |
Negligible |
Negligible |
Negligible |
Negligible |
|
a Parameter values applied to each vector may be found in the CCA, Appendix IRES, Table IRES-2, Table IRES-3, and Table IRES-4. b Values less than 10-18 Ci/L are considered negligible relative to the other values and are not reported. |
||||||
Table IGP-2. Maximum Concentrations of Radionuclides Within the Salado Interbeds at the Disposal System Boundary for the CRA-2004 Analysis
|
CRA-2004 |
Vector No.a |
Maximum Concentrations (Ci/L) |
||||
|
241Am |
239Pu |
238Pu |
234U |
230Th |
||
|
1 |
Replicate 1 |
Negligibleb |
2.53 ´ 10-18 |
Negligible |
Negligible |
Negligible |
|
2-300 |
— |
Negligible |
Negligible |
Negligible |
Negligible |
Negligible |
|
a Parameter values applied to each vector may be found in the CRA-2004, Appendix PA, Attachment PAR. b Values less than 10-18 Ci/L are considered negligible relative to the other values and are not reported. |
||||||
As with the CRA-2004 evaluation, the CRA-2009 evaluation shows that 1 of the 300 realizations results in concentrations of radionuclides greater than 0 reaching the accessible environment through the anhydrite interbeds (Ismail 2008a). All of the remaining 299 realizations show no radionuclides reaching the accessible environment during the 10,000-year period. The maximum concentrations of radionuclides calculated by the CRA-2009 evaluation to reach the accessible environment are shown in Table IGP-3.
Table IGP-3. Maximum Concentrations of Radionuclides Within the Salado Interbeds at the Disposal System Boundary for the CRA-2009 Analysisa,b
|
CRA-2009 |
Vector No.c |
Maximum Concentrations (Ci/L) |
||||
|
241Am |
239Pu |
238Pu |
234U |
230Th |
||
|
1 |
Replicate 1 |
1.71 ´ 10-18 |
3.83 ´ 10-13 |
Negligible |
1.14 ´ 10-15 |
1.83 ´ 10-16 |
|
2-300 |
— |
Negligible |
Negligible |
Negligible |
Negligible |
Negligible |
|
b Values less than 10-18 Ci/L are considered negligible relative to the other values and are not reported. c Parameter values applied to each vector may be found in Fox 2008. |
||||||
The increase in the maximum concentration of radionuclides reaching the accessible boundary in the CRA-2009 PA compared with the CRA-2004 PAis due to an error correction in the halite porosity parameter (Ismail 2007). In undisturbed conditions, pressure strongly influences the extent to which contaminated brine might migrate from the repository to the accessible environment. In general, pressure increased in the CRA-2009 PA compared with the CRA-2004 PA(see Nemer and Clayton, Table 6-10 [2008]). The increase was attributed to the correction in the halite porosity. The upper bound of the halite porosity distribution was increased from 0.03 to 0.05, while the lower bound and the mean remained the same. Halite porosity is positively correlated with pressure, so the increase in porosity resulted in an increase in pressure (Nemer and Clayton 2008).
As with the CRA-2004, the CCAdose calculations are bounding for the CRA-2009 evaluation. All of the radionuclide concentrations resulting from the CRA-2009 analysis are at least one order of magnitude smaller than the concentrations derived from the CCA analysis; no new dose calculations are necessary.
It is important to understand that the magnitude of the computed releases reported in Table IGP-1through Table IGP-3is smaller than the effective numerical precision of the transport calculations. As explained in Lowry (2005), the values for the single vector showing nonzero concentrations are believed to be the result of numerical dispersion inherent in the NUTS finite-difference solution method. The magnitude of the nonzero releases is indicative of numerical dispersion resulting from the coarse grid spacing between the repository and the LWB, rather than containment transport.
As quoted earlier, section 194.51 states that doses must be estimated for an individual who resides at the location in the accessible environment where that individual would be expected to receive the highest exposure to radionuclide releases from the disposal system. All potential pathways for exposure associated with the UP of the repository must be assessed (section 194.52).
To perform the required dose calculation for the CCA, it was necessary to select possible pathways for the transport of the contaminants from the anhydrite interbeds to a receptor. The chosen pathway is an abandoned, deep borehole that intersects the contaminant plume in the accessible environment. Consistent with assumptions described in the CRA-2004, Chapter 6.0, Section 6.4.7.2 and the information provided in the CCA, Appendix DEL, the hole is assumed to have the permeability of an uncased hole filled with silty sand after the degradation of a borehole plug in the Rustler Formation. A pressure gradient is assumed to exist because of the pressures in the anhydrite resulting from gas generation in the repository. The pressures are assumed to be greater than hydrostatic to force contaminants up the abandoned hole to the Culebra or the Dewey Lake Formation. The contaminants would then be available to a receptor through a well used to supply drinking water. This conceptual transport pathway is shown in Figure IGP-1. This is the only credible pathway that the DOE has been able to identify.
Figure IGP-1. Conceptual Transport Pathway
As specified in 40 CFR § 194.54(b), this pathway considers the presence of an existing borehole. As discussed in the CRA-2004, Chapter 6.0, Section 6.2.5, the influence of other existing boreholes has been evaluated in the FEPs screening for UP.
Uncertainty in calculating radionuclide concentrations in the anhydrite interbeds is described in the CRA-2004, Chapter 6.0, Section 6.1.2 and updated for the CRA-2009 by Ismail and Garner (2008). Additional uncertainty is involved in the calculation of doses resulting from the specified exposure pathway. Given this uncertainty, the DOE elected for the CCA evaluation to perform a bounding analysis using assumptions that do not represent reality, but that would result in a bounding estimate much greater than any reasonably expected dose to a receptor. If this bounding analysis results in calculated doses to the receptor that are below the regulatory limit, compliance with the standard is demonstrated. If subsequent analyses, such as those performed to support this application, have lower initial concentrations than the bounding CCA analysis, recalculating the doses is unnecessary because the results of the original bounding analysis are below regulatory limits.
The bounding analysis used for the CCA assessment was based on the following factors and assumptions:
1. No specific transport mechanism was postulated. Instead, it was assumed that all contaminants reaching the accessible environment within the anhydrite interbeds during the year of maximum releases (that is, year 10,000) were available to a receptor.
2. Brine derived from the anhydrite interbeds had total dissolved solids (TDS) concentrations of about 324,000 parts per million (ppm); this represents a concentration that could not be consumed by humans. For the bounding analysis, the calculation includes the dilution of this brine by a factor of 32.4 to a TDS concentration of 10,000 ppm, which is the upper limit for potable water.
3. The resulting annual committed effective dose was calculated based on a 50-year dose commitment. A 50-year dose commitment was selected because this period is specified in Part 191, Appendix B and because it is the duration for which published external dose-rate conversion factors are readily available in the literature (U.S. Department of Energy 1988).
4. The individual receptor was assumed to drink two liters of water each day (as specified in section 194.52) for one year (in accordance with the specification of an annual committed effective dose in Part 191, Appendix B).
Section 194.51 states that DOE shall assume an individual resides at the single geographic point where that individual would receive the highest dose. With the bounding analysis, the DOE complies with the intent of this criterion, but the specific location of the receptor is not identified because all contaminants reaching the accessible environment within the anhydrite interbeds during the year of maximum releases are assumed to be directly available to the receptor, regardless of the receptor’s location. The well from which the receptor drinks is assumed to be located where the contaminants reaching the anhydrite interbeds are delivered directly to the well.
The bounding analysis dose calculation was performed using the GENII-A code. The CCA,Appendix GENII describes the modeling method. GENII-A incorporates dose-calculation guidance provided in Part 191, Appendix B.
The maximum doses calculated from the releases listed in Table IGP-1, after applying the factors and assumptions listed above, are shown in Table IGP-4. These doses are greater than any realistic doses that could be delivered to a receptor. The calculated doses are well below the regulatory standard, which is an annual committed effective dose of 15 mrem.
Table IGP-4. Calculated Maximum Annual Committed Effective Doses for the CCA Evaluation
|
Realization No. |
Vector No.a |
Maximum Annual Committed Effective Dose (mrem) |
|
1 |
Replicate 1 |
3.4 ´ 10-1 |
|
2 |
Replicate 2 |
4.3 ´ 10-3 |
|
3 |
Replicate 2 |
1.1 ´ 10-4 |
|
4 |
Replicate 2 |
5.8 ´ 10-3 |
|
5 |
Replicate 2 |
5.1 ´ 10-7 |
|
6 |
Replicate 2 |
4.3 ´ 10-5 |
|
7 |
Replicate 3 |
2.5 ´ 10-2 |
|
8 |
Replicate 3 |
6.2 ´ 10-3 |
|
9 |
Replicate 3 |
4.7 ´ 10-1 |
|
10-300 |
— |
Negligibleb |
|
a Parameter values applied to each vector may be found in the CCA, Appendix IRES, Table IRES-2, Table IRES-3, and Table IRES-4. b Doses derived from Table IGP-1 concentration values of less than 10-18 Ci/L are considered negligible and are not reported. |
||
On February 26, 1997, the DOE submitted supplementary information to the EPA in response to an EPA request for additional information (Dials 1997b, Enclosure 2h). The supplementary information describes how the DOE extended its initial bounding analysis to account for exposure pathways other than direct ingestion of contaminated water by humans. Specifically, the analysis was expanded to include consumption of contaminated water by cattle (leading to the receptor’s consumption of contaminated milk and beef), consumption of crops irrigated with contaminated water, and inhalation of airborne dust from soil contaminated by irrigation. The DOE found that the contribution of these pathways added 0.46 mrem per year to the calculated groundwater dose associated with the realization showing the highest concentration of radionuclides reaching the boundary of the accessible environment under undisturbed conditions of 0.47 mrem per year. Thus, the maximum total dose calculated from all pathways was 0.93 mrem per year, well below the 15-mrem-per-year standard.
Given that the maximum concentration of radionuclides shown to reach the accessible environment for the CRA-2004 analysis is six orders of magnitude less than the maximum value calculated for the CCA evaluation, resulting potential doses to the receptor would also be well below the 15-mrem standard. As such, the CCA dose calculation bounded any possible dose to a receptor for the CRA-2004 evaluation, and new dose calculations were not needed to demonstrate compliance.
The CRA-2009 calculations show that radionuclides reach the accessible environment at a maximum concentration one order of magnitude smaller than the maximum concentration shown for the CCA analysis. As such, the CCA results continue to be bounding for the CRA-2009; continued compliance with the individual protection standard is demonstrated.
40 CFR § 194.55(d) specifies that the “number of estimates generated pursuant to paragraph (c) of this section shall be large enough such that the maximum estimates of doses and concentrations generated exceed the 99th percentile of the population of estimates with at least a 0.95 probability.” The probability that an individual estimate is below the 99th percentile is, by definition, 0.99. This means that only 1 in 100 estimates would have a value exceeding the 99th percentile, or conversely, 99 times out of 100 the estimate would have a value below the 99th percentile. It follows that for 2 independent estimates, the probability of both estimates having a value below the 99th percentile is equal to the product (0.99)(0.99), or (0.99)2, and that for n estimates, the probability that all estimates have a value below the 99th percentile is equal to (0.99)n. To ensure a value exceeds the 99th percentile with a specified probability, the complement (1 – 0.99n) is used to calculate the number of estimates required.
The probability specified by section 194.55(d) is 0.95, or 95% confidence, that the maximum estimates of doses and concentrations generated exceed the 99th percentile of the population of estimates. Therefore, the following equation can be solved for n, and the number of estimates required is
1 - 0.99n = 0.95 or (n)log(0.99) = log(0.05) (IGP.1)
which implies n > 298.
The solution requires n to be greater than 298 and was used to determine that 300 realizations of the modeling system is a sufficient number to meet the confidence level specified in section 194.55(d).
The 300 realizations of the modeling system (as described in Section IGP-2.1) report concentrations of radionuclides reaching the accessible environment within the Salado anhydrite interbeds and not doses to a receptor, as specified by section 194.55(d). Nevertheless, the maximum possible resulting annual dose to an individual for the CCA analysis is 0.93 mrem, the sum of 0.47 mrem (as reported in Table IGP-4) plus the additional value of 0.46 mrem determined to be contributed through additional dose pathways. All other calculated doses resulting from the 300 realizations of the modeling system for the CCA, CRA-2004, and CRA-2009 evaluations are below this value.
40 CFR § 194.55(f) specifies that the DOE shall
document that there is at least a 95 % level of statistical confidence that the mean and the median of the range of estimated radiation doses and the range of estimated radionuclide concentrations meet the requirements of § 191.15 and part 191, subpart C of this chapter, respectively.
The DOE has developed a bounding analysis that exceeds the mean and median doses, providing greater than 95% confidence that all potential doses will be below the 0.93 mrem value.
Parameter values applied to the CCA modeling assessment for UP are described in the CCA, Appendix PAR and Chapter 8.0, Section 8.1.5. Parameters used in the PA and compliance assessment modeling program for the CRA-2004 are described in the CRA-2004, Appendix PA, Attachment PAR. As provided by 40 CFR § 194.55(b), the CRA-2004, Appendix PA, Attachment PAR also identifies the probability distributions for these parameters, their units, the models and codes in which the parameters are used, the functional form of the probability distributions used for the sampled parameters, and associated input data. This same information is provided in support of the CRA-2009 in Fox (2008).
In performing the compliance assessment, the DOE applied a bounding-analysis approach using conservative assumptions that overestimate potential doses and contaminant concentrations. This conservative approach assumes that all contaminants reaching the accessible environment are directly available to a receptor. Using this very conservative approach, the calculated maximum potential dose to an individual from the CCA evaluation would be about one-sixteenth of the individual protection standard. Given that modeled maximum radionuclide concentrations in the accessible environment for the CRA-2004 and the CRA-2009 evaluations are well below those of the CCA evaluation, the CCA results are bounding and continued compliance with the individual protection standard is demonstrated.
The groundwater protection requirements are contained in Part 191 Subpart C. In particular, 40 CFR § 191.24(a)(1) requires the following:
General. Disposal systems for waste and any associated radioactive material shall be designed to provide a reasonable expectation that 10,000 years of undisturbed performance after disposal shall not cause the levels of radioactivity in any underground source of drinking water, in the accessible environment, to exceed the limits specified in 40 CFR Part 141 as they exist on January 19, 1994.
40 CFR Part 141 specifies the National Primary Drinking Water Standards. The levels of radioactivity (and dose equivalent, in the case of 40 CFR § 141.16(a)) specified as of January 19, 1994 were
1. Combined 226Ra and 228Ra (40 CFR § 141.15(a)): 5 pCi/L
2. Gross alpha particle activity, including 226Ra but excluding radon and uranium (40 CFR § 141.15(b)): 15 pCi/L
3. Annual dose equivalent to the total body or any internal organ from the average annual concentration of beta particle and photon radioactivity from man-made radionuclides (section 141.16(a)): 4 mrem per year
In addition, 40 CFR § 194.53 (U.S. Environmental Protection Agency 1996) applies to DOE’s consideration of USDWs. The criterion specifies
In compliance assessments that analyze compliance with part 191, subpart C of this chapter, all underground sources of drinking water in the accessible environment that are expected to be affected by the disposal system over the regulatory time frame shall be considered. In determining whether underground sources of drinking water are expected to be affected by the disposal system, underground interconnections among bodies of surface water, groundwater, and underground sources of drinking water shall be considered.
To assess compliance with these provisions of the regulations, it is first necessary to identify any USDW that may be located near the WIPP. The DOE’s evaluation of whether any USDW is located near the WIPP is provided in the CCA, Appendix USDW and is summarized in the CCA, Chapter 8.0, Section 8.2.2. In developing the CRA-2004, the DOE reevaluated the presence of USDWs near the WIPP and supplemented the information presented in the CCA, Appendix USDW. The supplemental information is provided in the CRA-2004, Chapter 8.0, Section 8.2.2. Based on the CRA-2004 review, the DOE concluded that no deviation from the findings and conclusions of the 1996 evaluation was warranted.
For the CRA-2009, the DOE has again reevaluated the presence of USDWs near the WIPP. Supplemental information is provided in Section IGP-3.2. Based on this reevaluation, the DOE again concludes that no deviation from the CCA findings and conclusions is warranted.
In evaluating the presence of any USDW, it is necessary to establish criteria for water quality and quantity data from wells in the vicinity of the WIPP. The criteria must be based on the regulatory definition of a USDW, as provided in 40 CFR § 191.22 (U.S. Environmental Protection Agency 1993). A USDW is defined in section 191.22 to mean an aquifer or its portion that
(1) Supplies any public water system; or
(2) Contains a sufficient quantity of groundwater to supply a public water system; and
(i) Currently supplies drinking water for human consumption; or
(ii) Contains fewer than 10,000 milligrams of total dissolved solids per liter.
“Public water system” means a system for the provision to the public of piped water for human consumption, if such system has at least fifteen service connections or regularly serves at least twenty-five individuals. Such term includes:
(1) Any collection, treatment, storage, and distribution facilities under control of the operator of such system and used primarily in connection with such system; and
(2) Any collection or pretreatment storage facilities not under such control which are used primarily in connection with such system.
“Total dissolved solids” means the total dissolved (filterable) solids in water as determined by use of the method specified in 40 CFR Part 136.
Criteria based on these definitions were developed by the DOE and are used to assess the presence of any USDW near the WIPP. These criteria are defined in the sections that follow.
Two subcriteria have been identified by the DOE and applied to the groundwater quantity definition.
1. An aquifer or its portion must be capable of producing water at an adequate rate.
2. An aquifer or its portion must be capable of producing water for a sufficient duration.
Water-consumption information was evaluated by the DOE to define the first subcriterion (the ability to produce at an adequate rate). The value to be applied is determined by obtaining the following information:
1. The rate, over a 24-hour period, at which water is consumed by 15 service connections
2. The rate, over a 24-hour period, at which water is consumed by 25 individuals
To define a USDW, the lower of these two values is assigned by the DOE to the first subcriterion. Based on calculations presented in the CCA, Appendix USDW and updated in support of the CRA-2004, a quantity of 5 gallons per minute (gpm) is assigned as the first subcriterion. Details on the derivation of the five-gpm value is provided below.
For the CCA evaluation, the rate of consumption by 15 service connections was calculated using the data provided in Table IGP-5. These are 1990 U.S. Bureau of the Census data for the number of persons per household in southeastern New Mexico communities, and water-consumption data for the same communities. The water-consumption data were obtained from the New Mexico State Engineer’s Office (Wilson and Lucero 1997).
Table IGP-5. Persons Per Household and Water Consumption Values Used in the CCA
|
Community |
Persons Per Household, 1990a |
Gallons Per Capita Per Dayb |
|
Artesia |
2.69 |
285 |
|
Carlsbad |
2.63 |
307 |
|
Hobbs |
2.81 |
267 |
|
Lovington |
2.96 |
264 |
|
Roswell |
2.66 |
285 |
|
Average |
2.75 |
282 |
|
Sources: a. U.S. Bureau of the Census (1990, pp. 15–16); b. Wilson and Lucero (1997). |
||
As reported in Wilson and Lucero (1997), the average water usage in these communities was 282 gallons per person per day. The 1990 census statistics for these communities show an average of 2.75 people per household. One household equals one service connection.
Therefore,
· 2.75 people ´ 282 gallons per person, per day = 775.5 gallons per service connection, per day
· 775.5 gallons per day (gpd), per service connection ´ 15 connections = 11,633 gpd
· 11,633 gpd/1,440 minutes per day = 8.08 gpm
The rate of consumption by 15 service connections, based on the 1990 and 1992 statistics, is calculated to be 8.08 gpm.
The rate at which water would be consumed by 25 individuals over a 24-hour period may be calculated using these same data. The average water usage was 282 gallons per person, per day in area communities. The consumption of water by 25 people equals
· 282 gallons per person, per day ´ 25 people = 7,050 gpd
· 7,050 gpd/1,440 minutes per day = 4.89 gpm
Based on these two calculations, the quantity consumed by 25 individuals (4.89 gpm; nominally 5 gpm) is smaller than the quantity consumed by 15 service connections (8.08 gpm). Therefore, the 5-gpm value was applied to the CCA evaluations.
In updating this calculation for the CRA-2004, more current census data and water consumption data were obtained (Wilson et al. 2003). These more current data are provided in Table IGP-6.
The average water usage in these communities is 305 gallons per person per day, and the 2000 census statistics for these communities show an average of 2.64 people per household (Table IGP-6). One household equals one service connection.
Table IGP-6. Persons Per Household and Water Consumption Values Used in the CRA-2004
|
Community |
Persons Per Household, 2001a |
Gallons Per Capita Per Day, 2000b |
|
Artesia |
2.61 |
390 |
|
Carlsbad |
2.51 |
277 |
|
Hobbs |
2.72 |
284 |
|
Lovington |
2.80 |
289 |
|
Roswell |
2.58 |
283 |
|
Average |
2.64 |
305 |
|
Sources: a. U.S. Bureau of the Census (2001); b. Wilson et al. (2003). |
||
Therefore,
· 2.64 people ´ 305 gallons per person, per day = 805.2 gallons per service connection, per day
· 805.2 gpd, per service connection ´ 15 connections = 12,078 gpd
· 12,078 gpd/1,440 minutes per day = 8.39 gpm
Using updated data, the rate of consumption by 15 service connections is calculated to be 8.39 gpm.
The rate at which water would be consumed by 25 individuals over a 24-hour period may be calculated using these same data. The current average water usage is 305 gallons per person, per day in area communities. The consumption of water by 25 people equals
· 305 gallons per person, per day ´ 25 people = 7,625 gpd
· 7,625 gpd/1,440 minutes per day = 5.30 gpm
Based on these two calculations, the quantity consumed by 25 individuals (5.30 gpm; nominally 5 gpm) is smaller than the quantity consumed by 15 service connections (8.39 gpm). To conservatively determine the quantity derived from a well that meets the quantity subcriterion, the 5-gpm value is applied. No change in this subcriterion is warranted as a result of applying current census and water consumption data to the calculation.
In updating this information for the CRA-2009, more recent water consumption data were obtained from the New Mexico Office of the State Engineer (Longworth et al. 2008). More recent persons-per-household data were not available. The water consumption data show that the average per capita consumption decreased to 273 gpd (Table IGP-7). When the calculation above is repeated with the updated average consumption value, the rate of consumption for 15 service connections is 7.51 gpm. For 25 people, the value is 4.74 gpm. Based on this rate, it is concluded that applying the 5-gpm subcriterion is still valid for a bounding analysis. No change in this subcriterion is warranted as a result of applying more current water-consumption data to the calculation.
Table IGP-7. Persons Per Household and Water Consumption Values Used in the CRA-2009
|
Community |
Persons Per Household, 2001a |
Gallons Per Capita Per Day, 2005b |
|
Artesia |
2.61 |
344 |
|
Carlsbad |
2.51 |
271 |
|
Hobbs |
2.72 |
257 |
|
Lovington |
2.80 |
235 |
|
Roswell |
2.58 |
256 |
|
Average |
2.64 |
273 |
|
Sources: a. U.S. Bureau of the Census (2001); b. Longworth et al. (2008). |
||
The definition of the second quantity subcriterion (the acceptable production duration of a well) is more subjective. Because the creation of a public water supply system involves considerable capital expense, it is reasonable to assume that such a water system would not be constructed unless the water source would continue to be available for some time, at least long enough to recover the capital expense. The Rural Utility Service of the U.S. Department of Agriculture provides loans to fund new rural water supply systems. The loan periods are generally 40 years in duration. Based on this, a duration of 40 years is applied by the DOE to the second quantity subcriterion.
A criterion of 10,000 milligrams per liter (mg/L) of TDS is specified in section 191.22. Any aquifer or its water-producing portion with TDS concentrations below this level is determined to produce water that meetsthe quality criterion for a USDW. Any aquifer or its water-producing portion with TDS concentrations at or above this level is determined to produce water that does not meet the quality criterion and the regulatory definition of a USDW.
For the CCA evaluation, current conditions and available hydrogeologic data were reviewed by the DOE to assess the presence of USDWs near the WIPP. This assessment compares current conditions and available data to the groundwater quantity and quality criteria described above. The results of this comparison are summarized below and provided in detail in the CCA, Appendix USDW.
Five geologic units within the vicinity of the WIPP could potentially meet the definition of a USDW under Part 191, Subpart C:
1. The Capitan Aquifer of the Guadalupian reef complex
2. The Culebra
3. The Magenta
4. The Dewey Lake
5. The Santa Rosa
Investigations conducted in the vicinity of the WIPP to characterize the hydrology of these formations are described in the CCA, Appendix USDW. Important sources of relevant information are identified and findings or conclusions related to the presence of USDWs are provided. Based on this work and the updates performed to support the CRA-2004 and the CRA-2009, the DOE has concluded that USDWs are present in the Culebra, and, because of inconclusive groundwater production data, possible USDWs are present in the Dewey Lake and the Santa Rosa. USDWs in the Culebra are located at WIPP water quality sampling program (WQSP) wells H-07b1, H-08b, and H-09b about 4.8, 14.5, and 10.5 kilometers (km) (3, 9, and 6.5 miles (mi)) to the south/southwest of the controlled area boundary, respectively. Possible USDWs may occur in the Dewey Lake, about 1.6 km (1 mi)south of the controlled area boundary, and the Santa Rosa, 12.4 to 14.5 km (7.7 to 9 mi)to the east of the controlled area boundary, where private wells (used predominantly for supplying water to livestock) have not generated sufficient available groundwater production data to assess their potential to meet section 191.22 requirements. In the absence of such data, these wells are designated as being located in possible USDWs.
In reevaluating the conclusions presented in the CCA, Appendix USDW for the CRA-2004,the DOE reviewed available groundwater quality and quantity data for the wells identified in the appendix to determine if any data collected since 1996 were available. In addition, a review was performed to determine if any wells not reported in the CCA, Appendix USDW were drilled that could provide groundwater quality (i.e., TDS concentrations) and groundwater quantity data. The CRA-2004 reports that one new well, identified as well C-2737, was developed at the WIPP site. This well was drilled during February and March of 2001 to replace well H-1, which was plugged and abandoned. In February of 2001, a water sample from the upper Dewey Lake Formation was obtained from this well. Laboratory analysis of this sample showed a TDS concentration of 2,590 ppm (Powers 2002).
The CRA-2004 also reports that additional wells were installed across the WIPP site to investigate the extent of anthropogenic groundwater at the contact of the Santa Rosa and Dewey Lake. Four monitoring wells and 12 piezometer wells were emplaced. The results of multiple rounds of sampling and analyses from these wells are reported in Duke Engineering & Services (1997). Samples from several of these wells show TDS concentrations both below and above 10,000 ppm, although it was not possible to pump water from any of these wells at rates of 5 gpm or more.
In addition, State of New Mexico records indicate that several new wells were drilled in the southwestern portion of the study area evaluated in the CCA, Appendix USDW. These records, however, include no TDS or production data.
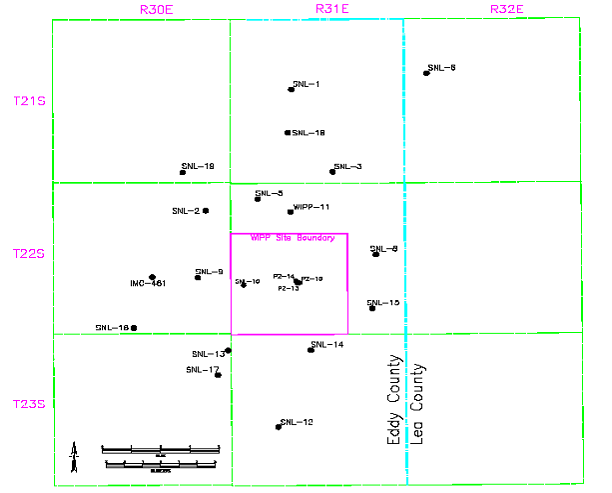
In developing the CRA-2009, available groundwater data were reviewed again to determine if any data from new or existing wells might influence USDW determinations. Since the submittal of the CRA-2004, 18 new wells have been completed in the Culebra. The locations of these wells are shown in Figure IGP-2. TDS concentrations and pumping rates observed from these
Figure IGP-2. Locations of Recent Culebra Wells and Shallow Piezometers
wells are provided in Table IGP-8. The table also shows USDW determinations based on the determination criteria. These data support the earlier conclusion that a USDW occurs in parts of the Culebra in the vicinity of the WIPP.
In 2007, three shallow (77 feet deep) piezometer wells were drilled on the WIPP site in the vicinity of the Site and Preliminary Design Validation salt pile to determine if shallow subsurface water exists in this area (U.S. Department of Energy 2008). Water samples from PZ-13 and PZ-14 showed TDS concentrations significantly in excess of 10,000 mg/L; PZ-15 showed levels below that concentration. Results from the first two samples are believed to indicate that this shallow water is associated with the salt pile, whereas the source of PZ-15 perched water is believed to be shallow infiltration from a topographic depression east of the salt pile. Despite the fact that the PZ-15 well showed a low TDS concentration, none of these wells meet the pumping rate subcriterion; all wells pumped dry within the sampling period. Therefore, none of these wells indicates the presence of a USDW.
Recent TDS data are also available through the WIPP WQSP, which is a detection monitoring program operated under the provisions of the WIPP Hazardous Waste Facility Permit. One WQSP well, WQSP-6A, shows TDS concentrations below 10,000 mg/L. This well is completed
Table IGP-8. Data Obtained from Recent Culebra Wells
|
Well |
Date Sample Collected |
TDS (mg/L) |
Pumping Test Dates |
Pumping Rate (gpm) |
Meets USDW Criteria? |
|
SNL-1a |
5/29/2004 |
36,000 |
5/24-5/29/2004 |
12.00 |
N |
|
— |
3/10/2005 |
34,000 |
— |
— |
N |
|
SNL-2 |
1/17/2004 |
11,000 |
1/19-1/24/2005 |
12.00 |
N |
|
— |
1/24/2005 |
9,500 |
— |
— |
Y |
|
SNL-3 |
4/16/2004 |
47,000 |
4/13-4/16/2004 |
10.00 |
N |
|
SNL-5 |
7/24/2004 |
130,000 |
7/19-7/24/2004 |
3.50 |
N |
|
SNL-6 |
NA |
NA |
NA |
NA |
NA |
|
SNL-8 |
8/2/2007 |
140,000 |
7/31-8/3/2007 |
0.50 |
N |
|
SNL-9 |
11/19/2004 |
25,000 |
10/22-11/23/2004 |
16.00 |
N |
|
SNL-10 |
11/3/2006 |
8,500 |
10/30-11/3/2006 |
0.25 |
N |
|
SNL-12 |
8/14/2004 |
4,200 |
8/9-8/14/2004 |
20.00 |
Y |
|
SNL-13 |
7/17/2006 |
21,000 |
NA |
NA |
N |
|
SNL-14 |
8/26/2005 |
83,000 |
8/4-8/26/2005 |
30.00 |
N |
|
— |
7/30/2007 |
86,000 |
— |
— |
N |
|
WIPP-15 |
3/30/2007 |
280,000 |
NA |
NA |
N |
|
WIPP-16 |
6/9/2006 |
18,000 |
6/5-6/9/2006 |
25.00 |
N |
|
WIPP-17 |
9/15/2006 |
3,200 |
9/11-9/15/2006 |
32.00 |
Y |
|
WIPP-18 |
8/18/2006 |
19,000 |
8/14-8/18/2006 |
30.00 |
N |
|
WIPP-19 |
7/28/2006 |
8,100 |
7/24-7/28/2006 |
30.00 |
Y |
|
WIPP-11 |
12/15/2004 |
50,000 |
2/1-2/20/2005 |
35.00 |
N |
|
— |
2/20/2005 |
49,000 |
— |
— |
N |
|
IMC-461b |
8/4/2006 |
9,900 |
NA |
NA |
Possible |
|
Source: CRA-2009, Appendix HYDRO-2009 a SNL = Sandia National Laboratories b IMC = International Minerals and Chemical |
|||||
in the Dewey Lake. All of the other WQSP wells, Wells 1 through 6, are completed in the Culebra. All of the recent data for the Culebra wells show TDS concentrations above 10,000 mg/L. All of the recent data from the WQSP wells are consistent with earlier data in the context of USDW determinations. No changes to the earlier USDW determinations are warranted based on the recent data.
As with the CRA-2004, it was found that State of New Mexico records indicate that several new wells were drilled in the study area evaluated in the CCA, Appendix USDW. These records, however, include no TDS or production data.
Based on this review, no modification of the USDW determinations reported in the CCA, Appendix USDW is warranted. The DOE concludes that in the vicinity of the WIPP, USDWs are present in the Culebra, and potential USDWs are present in the Dewey Lake and the Santa Rosa.
During its review of the CCA, the EPA requested that the DOE provide a map or maps showing the location of USDWs. The DOE responded to this request with supplementary information dated February 26, 1997 (Dials 1997b, Enclosure 1j). The supplementary information includes a map showing the boundaries of known USDWs nearest the WIPP in the Culebra and potential USDWs in the Santa Rosa and Dewey Lake. The EPA found the map sufficient for purposes of compliance assessment because it identifies potential USDWs near the WIPP (see Compliance Application Review Document [CARD] 53, U.S. Environmental Protection Agency 1998).
To provide additional assurance of the safety of the WIPP, the DOE prepared a bounding assessment of the concentrations of contaminants that could occur in a nearby USDW. Bounding doses that could be received by drinking from the USDW are also calculated. As with the individual protection standard, the analysis is bounding; the results illustrate the maximum, yet unrealistic, concentrations of contaminants in a hypothetical USDW and the maximum, yet unrealistic, resulting doses. As with the dose calculations, maximum concentrations were summed to develop concentrations for comparison with the National Primary Drinking Water Standards. The conclusions of this work, provided below, illustrate that the consequences of the undisturbed repository are negligible, even when conservative assumptions are applied to the performance evaluation. Because a hypothetical USDW is assumed to exist at the site boundary in these analyses, the results of the bounding analysis support the position that additional characterization of groundwater near the WIPP to make a more definitive USDW determination is not warranted.
Section IGP-2.2.1 describes the transport pathway assumed for the bounding analysis performed to evaluate compliance with the individual protection standard. This same transport pathway is assessed to evaluate compliance with the groundwater protection standard.
This pathway assumes that a hypothetical USDW is located where the maximum possible concentration of radionuclides could be realized in the USDW and the maximum possible dose to an individual who drinks from the USDW could be delivered to the individual. As such, the analysis bounds the section 194.53 criterion specifying that the DOE must consider underground interconnections among bodies of surface water, groundwater, and USDWs.
The modeling system employed to simulate the performance of the undisturbed repository tracks the transport of the most important radionuclides to releases in the accessible environment (see the CCA, Appendix WCA and the CRA-2004, Appendix TRU WASTE). These radionuclides, listed in Table IGP-1, are 241Am, 239Pu, 238Pu, 234U, and 230Th. They do not include 226Ra or 228Ra because these radionuclides are not a prevalent component of the projected inventory (Fox 2003a). However, an analysis of 226Ra and 228Rais required to evaluate compliance with the groundwater protection standard.
To perform the bounding analysis for the CRA-2004, the results of a NUTS code tracer exercise were used to scale the anticipated releases of 226Ra and 228Ra. The tracer exercise shows that an initial 1 kilogram/cubic meter (kg/m3) concentration of radionuclides in the repository results in a concentration at the accessible environment boundary of 1.025 × 10⁻⁷ kg/m3. By applying this scaling factor to the quantity of 226Ra and 228Ra projected to be emplaced in the repository, it was determined and reported in the CRA-2004 that the maximum concentration of these radionuclides in the accessible environment is 0.07 pCi/L (Wagner 2003), which is below the section 141.15(a) standard of 5 pCi/L.
This concentration was calculated by transporting the passive tracer in the flow field generated using the BRAGFLO code for Realization 1 (Replicate 1, Vector 82), shown in Table IGP-2. The calculation uses the mass and activity loads for 226Ra and 228Ra in the radionuclide inventory at closure and at 10,000 years. These values are provided in Table IGP-9. The ORIGEN 2.2 code was used to calculate the activity loads at 10,000 years; these loads are 51.43 curies (Ci) of 226Ra in contact-handled (CH-) and remote-handled- (RH-) transuranic (TRU) waste and 7.95 Ci of 228Ra in CH- and RH-TRU waste. The calculated concentration is based on the volume of brine, 5,577 cubic meters (m3) (169,924 ft3), in the repository at time zero in the BRAGFLO calculation.
Table IGP-9. Total Inventory and Mass Loading of 226Ra and 228Ra Reported in the CRA-2004
|
Radionuclide |
Waste Type |
Total Inventory at Closure (Ci) |
Total Inventory at 10,000 Years |
Mass Loading |
|
226Ra |
CH |
6.28 ´ 100 |
4.98 ´ 101 |
6.35 ´ 10-3 |
|
226Ra |
RH |
4.99 ´ 10-5 |
1.63 ´ 100 |
5.05 ´ 10-8 |
|
228Ra |
CH |
7.63 ´ 100 |
7.70 ´ 100 |
2.81 ´ 10-5 |
|
228Ra |
RH |
2.51 ´ 10-1 |
2.54 ´ 10-1 |
9.23 ´ 10-7 |
|
Source: Fox (2003b) |
||||
The total concentration (CH- and RH-TRU) of either 226Ra or 228Ra at 10,000 years at the accessible environment boundary was calculated using the following steps:
1. Calculate the total mass load at 10,000 years by multiplying the total mass load at decommissioning by the ratio of activity loadings at 10,000 years and decommissioning, respectively.
2. Calculate the total mass concentration at the accessible environment boundary by dividing by the value of brine from the BRAGFLO simulation and multiplying by the scaling factor.
3. Convert to total concentration of activity at the accessible environment boundary by multiplying by the ratio of activity loading to mass loading at decommissioning.
4. Divide the concentration by the dilution factor 32.4 (see Section IGP-2.2.2).
The 0.07 pCi/L maximum concentration calculated for the CRA-2004 occurs in the anhydrite interbeds within the Salado and not in a zone that could realistically be a source of drinking water.
In the CCA, this value is reported as 2 pCi/L. During the PAVT (U.S. Department of Energy 1997), it was determined that the CCA calculation used an inappropriate brine volume value and failed to account for the dilution factor. Accordingly, the PAVT analysis shows that the correct value that should have been reported in the CCA is 0.14 pCi/L (Dials 1997).
For the CRA-2009, a new derivation concept is applied to demonstrate that the combined 226Ra and 228Ra concentrations are below the regulatory limit of 5 pCi/L over the 10,000-year performance period (Ismail and Nemer 2008). The new method better represents the actinide (An) concentration at the LWB because it does not use the cumulative tracer scaling factor. Current PA calculations do not explicitly track Ra concentrations in the groundwater, so an alternate method was first used in the CCA to derive conservative estimates of potential Ra concentrations at the LWB. This method was also used in the CRA-2004. The original method overestimated the potential Ra concentration because the estimates used a cumulative scaling factor. An alternate method was chosen that is more consistent with the methods used to calculate An concentrations in PA.
As described in Section IGP-2.1, Ismail (2008) identifies only one vector in the CRA-2009 PA that has nonzero releases at the LWB. Replicate 1, Vector 53 showed a tracer concentration in the MB at the LWB of 1.24 × 10⁻⁴ kg/m3 (Ismail 2008). The maximum concentrations of radionuclides at the LWB during the 10,000-year regulatory period are shown in Table IGP-3.
As stated above, the Ra concentration was not previously calculated in PA. However, a new analysis was performed using the current PA methods and including Ra. The analysis shows a maximum 226Ra concentration of 1.7 × 10⁻⁵ pCi/L for the CRA-2009 PA and 6.5 × 10⁻⁷ for the CRA-2004 PABC. These concentrations of 226Ra are more than five orders of magnitude below the regulatory limit of 5 pCi/L (Ismail 2008b).
Based on this updated analysis, continued compliance with the combined 226Ra and 228Ra standard is demonstrated.
For the CCA evaluation, compliance with the section 141.15(b) standard was assessed by summing the maximum concentration values provided in Table IGP-1 for 241Am, 239Pu, 238Pu, and 230Th and adding the CCA value for 226Ra obtained to perform the section 141.15(a) assessment. The value obtained by this method is 7.81 pCi/L, which is below the section 141.15(b) standard of 15 pCi/L. This concentration occurs in the anhydrite interbeds within the Salado and not in a zone that could realistically be a source of drinking water.
For the CRA-2004 evaluation, the only contributing radionuclide is 239Pu, with a concentration of 2.53 × 10⁻⁶ pCi/L (Table IGP-2). This value, summed with the 0.07-pCi/L value derived for the section 141.15(a) assessment, is essentially 0.07 pCi/L, well below the 15-pCi/L standard.
For the CRA-2009 evaluation, there are four contributing radionuclides with a total concentration of 3.84 × 10⁻¹ pCi/L (Table IGP-3). As with the CRA-2004 analysis, this value, when summed with the 1.7 × 10⁻⁵ pCi/L value derived for the section 141.15(a) assessment, remains essentially 3.84 × 10⁻¹ pCi/L, well below the 15-pCi/L standard.
As described above, no contribution from 226Ra is expected. The gross alpha particle activity including 226Ra and excluding radon and U is expected to be zero. Continued compliance with the section 141.15(b) standard is demonstrated.
To assess compliance with the section 141.16(a) standard, an annual dose equivalent of 4 mrem per year, the transport of the following radionuclides was evaluated: 239Pu, 238Pu, 234U, and 230Th. The maximum annual committed effective dose calculated for the CCA evaluation from any of these radionuclides is 0.93 mrem, which is the value reported for transport through MB 139 and is well below the regulatory standard. The 0.93 mrem value includes alpha particle radioactivity, as well as beta particle and photon radioactivity. Thus, the value is very conservative, as the 4-mrem annual dose equivalent limit is only for beta particle and photon radioactivity.
By comparison, the maximum radionuclide concentration in the accessible environment calculated for the CRA-2004 evaluation is six orders of magnitude less than the maximum bounding value calculated for the CCA. Resulting doses for the CRA-2004 case would be correspondingly lower, as well.
For the CRA-2009 evaluation, the maximum radionuclide concentration in the accessible environment is one order of magnitude less than the maximum bounding CCA value. As such, resulting doses for the CRA-2009 case would be correspondingly lower, and continued compliance with the section 141.16(a) standard is demonstrated.
In performing the compliance assessment, the DOE applied a bounding-analysis approach using assumptions that overestimate potential doses and contaminant concentrations. To provide added assurance, the DOE assumed the presence of a USDW in close proximity to the WIPP LWB, even though available data indicate that none currently exists near the boundary. Using this conservative approach, the calculated maximum potential dose to an individual determined for the CCA evaluation would be about one-sixteenth of the individual protection standard.
For the CRA-2004 evaluation, this concentration is well below the CCA value. In addition, the maximum concentrations of contamination in the hypothetical USDW would be much less than half of the EPA groundwater protection limits, and the maximum potential dose to a receptor who drinks from the hypothetical USDW would be well below one-quarter of the standard.
For the CRA-2009 evaluation, the maximum potential dose remains below the CCA value and continued compliance with the individual protection standard is maintained. The potential concentrations of contaminants in the hypothetical USDW and the maximum potential dose to a receptor who drinks from the hypothetical USDW continue to be bounded by the CCA analysis.
This approach also conservatively assumes that all contaminants reaching the accessible environment are directly available to a receptor. The analysis bounds any potential impacts of underground interconnections among bodies of surface water, groundwater, and USDWs.
Dials, G.E. 1997a. Letter to L. Weinstock (Subject: Summary of the EPA-Mandated Performance Assessment Verification Test Results for the Individual and Groundwater Protection Requirements). 15 September 1997. U.S. Department of Energy, Carlsbad Area Office, Carlsbad, NM...\..\references\Others\Dials_1997_to_Wienstock_PAVT_Results_for_Individual_and_Groundwater_Protection_ERMS417309.pdf
Dials, G.E. 1997b. Letter to R. Trovato (1 Enclosure). 26 February 1997. U.S. Department of Energy, Carlsbad Area Office, Carlsbad, NM...\..\references\Others\Dials_February_26_1997_Letter_to_Travato.pdf
Duke Engineering & Services. 1997. Exhaust Shaft: Phase 2 Hydraulic Assessment Data Report Involving Drilling, Installation, Water-Quality Sampling, and Testing of Piezometers 1–12. DOE/WIPP 97-2278. Carlsbad, NM: Carlsbad Area Office...\..\references\Others\Duke_Engineering_Services_1997_Exhaust_Shaft_Phase_2_Hydraulic_Assessment_Data_Report_97_2278.pdf
Fox, B. 2003a. Radionuclides Expected to Dominate Potential Releases in the Compliance Recertification Application (Revision 1, August 26). ERMS 531086. Carlsbad, NM: Sandia National Laboratories...\..\references\Others\Fox_2003_Radionuclides_Expected_to_Dominate_Potential_Releases_Rev1_ERMS531086.pdf
Fox, B. 2003b. Calculation of Decayed Radionuclide Inventories for the Compliance Recertification Application (Revision 1, August 22). ERMS 530992. Carlsbad, NM: Sandia National Laboratories...\..\references\Others\Fox_2003_Calculation_of_Decayed_Radionuclide_Inventories_ERMS530992.pdf
Fox, B. 2008. Parameter Summary Report for the CRA-2009(Revision 0). ERMS 549747. Carlsbad, NM: Sandia National Laboratories...\..\references\Others\Fox_2008_Parameter_Report_CRA_2009_ERMS549747.pdf
Garner, J.W. 2003. Memorandum to Record (Subject: CRA Marker Bed Concentrations). 16 October 2003. ERMS 532402. Sandia National Laboratories, Carlsbad, NM...\..\references\Others\Garner_2003_CRA_Marker_Bed_Concentrations_ERMS532402.pdf
Ismail, A.E. 2007. Parameter Problem Report PPP-2007-002 for S_HALITE, DRZ_0. ERMS 545713. Carlsbad, NM: Sandia National Laboratories...\..\references\Others\Ismail_2007_Parameter_Problem_Report_for_S_HALITE_DRZ_0_ERMS545713.pdf
Ismail, A.E. 2008. Memorandum to the Records Center (Subject: Markerbed Concentrations for Undisturbed NUTS Scenarios in AP-137). 13 February 2008. ERMS 548150. Sandia National Laboratories. Carlsbad, NM...\..\references\Others\Ismail_2008_Markerbed_Concentrations_ERMS548150.pdf
Ismail, A.E., and J.W. Garner. 2008. Analysis Package for Salado Transport Calculations, Compliance Recertification Application 2009. ERMS 548845. Carlsbad, NM: Sandia National Laboratories...\..\references\Others\Ismail_Garner_2008_Analysis_Package_for_Salado_Transport_Calculations_CRA_2009_ERMS548845.pdf
Ismail, A.E., and M.B. Nemer. 2008. Radium-226 Concentrations in the CRA-2009 PA. ERMS 549387. Carlsbad, NM: Sandia National Laboratories...\..\references\Others\Ismail_Nemer_2008_Radium_226_Concentrations_ERMS549387.pdf
Longworth, J.W., J.M. Valdez, M.L. Magnuson, E.S. Albury, and J. Keller. 2008. New Mexico Water Use by Category, 2005 (June). Technical Report 52. Santa Fe, NM: New Mexico Office of the State Engineer...\..\references\Others\Longworth_et_al_2008_NM_Water_Use_by_Categories_2005_Tech_Report_52.pdf
Lowry, T.S. 2005. Analysis Package for Salado Transport Calculations: CRA-2004 PA Baseline Calculations (Revision 0). ERMS 541084. Carlsbad, NM: Sandia National Laboratories...\..\references\Others\Lowry_2005_Analysis_Package_for_Salado_Transport_Calculations_CRA_2004_PABC_ERMS541084.pdf
Nemer, M., and D. Clayton. 2008. Analysis Package for Salado Flow Modeling: 2009 Compliance Recertification Application Calculation. ERMS 548607. Carlsbad, NM: Sandia National Laboratories...\..\references\Others\Nemer_Clayton_2008_Analysis_Package_for_Salado_Flow_Modeling_ERMS548607.pdf
Powers, D.W. 2002. Basic Data Report for Drillhole C-2737. DOE/WIPP 01-3210. Carlsbad, NM: Carlsbad Area Office...\..\references\Others\Powers_2002_Basic_Data_Report_for_Drillhole_C2737_01_3210.pdf
U.S. Bureau of the Census. 1992. Population and Housing Unit Counts: New Mexico. 1990 CPH-2-33. 1990 Census of Population and Housing. Washington, DC: U.S. Department of Commerce...\..\references\Others\US_Census_Bureau_1990_Census_1990_Accessed_1995.htm
U.S. Bureau of the Census. 2001. American FactFinder. New Mexico by Place. Table GCT-PH1. Population, Housing Units, Area, and Density: 2000. <http://factfinder.census.gov/ servlet/GCTTable?_bm=y&-geo_id=04000US35&-_box_head_nbr=GCT-PH1&-ds_name= DEC_2000_SF1_U&-format=ST-7>...\..\references\Others\US_Census_Bureau_Census_2000_Gateway.htm
U.S. Department of Energy (DOE). 1988. Internal Dose-Rate Conversion Factors for Calculation of Dose to the Public. DOE/EH-0071. Washington, DC: Office of Environmental Guidance and Compliance...\..\references\Others\DOE_1988_Internal_Dose_Rate_Conversion_Factors_for_Calculation_EH0071.pdf
U.S. Department of Energy (DOE). 1996. Title 40 CFR Part 191 Compliance Certification Application for the Waste Isolation Pilot Plant (October). 21 vols. DOE/CAO 1996-2184. Carlsbad, NM: Carlsbad Area Office...\..\references\CCA\CCA.htm
U.S. Department of Energy (DOE). 1997. Summary of the EPA-Mandated Performance Assessment Verification Test Results for the Individual and Groundwater Protection Requirements (September 12). WPO 47258. Carlsbad, NM: Carlsbad Area Office...\..\references\Others\DOE_1997_Summary_of_the_EPA_Mandated_Performance_Assessment_Verification_Test_Results_ERMS417309.pdf
U.S. Department of Energy (DOE). 2004. Title 40 CFR Part 191 Compliance Recertification Application for the Waste Isolation Pilot Plant (March). 10 vols. DOE/WIPP 2004-3231. Carlsbad, NM: Carlsbad Field Office...\..\references\CRA-2004\CRA-2004.htm
U.S. Department of Energy (DOE). 2008. Basic Data Report for Piezometers PZ-13, PZ-14, and PZ-15 and Shallow Subsurface Water (Revision 1, April). DOE/WIPP 08-3375. Carlsbad, NM: Carlsbad Field Office...\..\references\Others\DOE_Shallow_Subsurface_Water_08_3375.pdf
U.S. Environmental Protection Agency (EPA). 1993. “40 CFR Part 191: Environmental Radiation Protection Standards for the Management and Disposal of Spent Nuclear Fuel, High-Level and Transuranic Radioactive Wastes; Final Rule.” Federal Register, vol. 58 (December 20, 1993): 66398–416...\..\references\Others\EPA_58_FR_66398_416_December_20_1993.pdf
U.S. Environmental Protection Agency (EPA). 1996. “40 CFR Part 194: Criteria for the Certification and Recertification of the Waste Isolation Pilot Plant’s Compliance with the 40 CFR Part 191 Disposal Regulations; Final Rule.” Federal Register, vol. 61 (February 9, 1996): 5223–45...\..\references\Others\EPA_61_FR_5224_5245_February_9_1996.pdf
U.S. Environmental Protection Agency (EPA). 1998. “CARD No. 53: Consideration of Underground Sources of Drinking Water.” Compliance Application Review Documents for the Criteria for the Certification and Recertification of the Waste Isolation Pilot Plant’s Compliance with the 40 CFR 191 Disposal Regulations: Final Certification Decision (May) (pp. 53-1 through 53-6). Washington, DC: Office of Radiation and Indoor Air...\..\references\Others\EPA_CCA_CARD_53.pdf
Wagner, S.W. 2003. Memorandum to Cliff Hansen (Subject: Calculation of Combined 226Ra and 228Ra Concentrations at Boundary for Chapter 8 Compliance Assessment). 6 November 2003. ERMS 532804. Sandia National Laboratories, Carlsbad, NM...\..\references\Others\Wagner_to_Hansen_2003_November_6_Calculation_of_Combined_ERMS532804.pdf
Wilson, B.C., and A.A. Lucero. 1997. Water Use by Categories in New Mexico Counties and River Basins, and Irrigated Acreage in 1995 (September). Technical Report 49. Santa Fe, NM: New Mexico State Engineer Office...\..\references\Others\Wilson_Lucero_1997_Water_Use_by_Categories_in_NM_Counties_in_1995.pdf
Wilson, B.C., A.A. Lucero, J.T. Romero, and P.J. Romero. 2003. Water Use by Categories in New Mexico Counties and River Basins, and Irrigated Acreage (February). Technical Report 51. Santa Fe, NM: New Mexico Office of the State Engineer...\..\references\Others\Wilson_et_al_2003_Water_Use_by_Categories_in_NM_Counties_in_2000.pdf