|
§ 194.34 Results of Performance Assessments
(a) The results of performance assessments shall be assembled into complementary, cumulative distribution functions (CCDFs) that represent the probability of exceeding various levels of cumulative release caused by all significant processes and events.
(b) Probability distributions for uncertain disposal system parameter values used in performance assessments shall be developed and documented in any compliance application.
(c) Computational techniques, which draw random samples from across the entire range of the probability distributions developed pursuant to paragraph (b) of this section, shall be used in generating CCDFs and shall be documented in any compliance application.
(d) The number of CCDFs generated shall be large enough such that, at cumulative releases of 1 and 10, the maximum CCDF generated exceeds the 99th percentile of the population of CCDFs with at least a 0.95 probability. Values of cumulative release shall be calculated according to Note 6 of Table 1, Appendix A of Part 191 of this chapter.
(e) Any compliance application shall display the full range of CCDFs generated.
(f) Any compliance application shall provide information which demonstrates that there is at least a 95 percent level of statistical confidence that the mean of the population of CCDFs meets the containment requirements of 40 CFR 191.13.
|
The radioactive waste disposal regulations of 40 CFR Part 191 Subparts B and C (U.S. EPA 1993) include containment requirements for radionuclides. The containment requirements of 40 CFR § 191.13 specify that releases from a disposal system to the accessible environment must not exceed the release limits set forth in Part 191 Appendix A, Table 1. Assessment of the likelihood that the Waste Isolation Pilot Plant (WIPP) will meet the release limits is conducted through a process known as a performance assessment (PA). The WIPP PA consists of a series of computer simulations that model the physical attributes of the repository (site, geology, waste forms and quantities, engineered features) in a manner that captures the expected behaviors and interactions among its various components over the 10,000-year regulatory time frame.
The PA must consider all significant processes and events that may affect the disposal system (see Section 32 of this application), and it must be structured and conducted in a way that (1) demonstrates an adequate understanding of the physical conditions at the disposal system and its surroundings, and (2) shows that the future performance of the system can be predicted with reasonable assurance. In addition, it must include simulations for both undisturbed conditions and human intrusion scenarios. The results of the PA are used to demonstrate compliance with the containment requirements of section 191.13.
The containment requirements place limits on the likelihood of radionuclide releases from a disposal system. A radionuclide release to the accessible environment is defined in terms of the location of the release and its magnitude. Any release of radionuclides to the ground surface, atmosphere, or surface water is considered a release to the accessible environment. In addition, any subsurface transport of radionuclides beyond the boundary of the WIPP controlled area is also considered a release to the accessible environment.
The results of the WIPP PA are required to be expressed as complementary cumulative distribution functions (CCDFs). A CCDF indicates the probability of exceeding various levels of cumulative release. The CCDFs must be generated using random sampling techniques that draw upon the full range of values established for each uncertain parameter.
To meet the requirements of 40 CFR § 194.34(a) (U.S. EPA 1996), the U.S. Environmental Protection Agency (EPA) expected the U.S. Department of Energy (DOE) to demonstrate that:
1. The results of the PA were assembled into CCDFs.
2. The CCDFs represent the probability of exceeding various levels of cumulative release caused by all significant processes and events.
3. All significant processes and events that may affect the repository during the 10,000-year period after closure have been incorporated into the CCDFs presented.
The EPA reviewed the features, events, and processes for the WIPP disposal system and the construction of the CCDFs for the Compliance Certification Application (CCA) (U.S. DOE 1996). The EPA concluded that the DOE appropriately captured the significant processes and events that could occur during the regulatory period in the CCDFs and thus complied with the requirements of section 194.34(a).
A complete description of the EPA's 1998 Certification Decision for section 194.34(a) can be obtained from Compliance Application Review Document (CARD) 34, Section 34.A.6
(U.S. EPA 1998a).
The DOE developed CCDFs for the 2004 Compliance Recertification Application (CRA-2004) (U.S. DOE 2004) using the same methodology as used for the CCA and the CCA Performance Assessment Verification Test (PAVT) (U.S. EPA 1998b); the only changes were in the values of some parameters and modeling assumptions. See the CRA-2004, Chapter 6.0, Table 6-1.
The DOE used selected computer codes and input parameters to generate estimates of radionuclide releases for a large number of scenarios. A review of the CRA-2004 PA identified several errors, as discussed in Section 34.7.4, resulting in the development of the CRA-2004 Performance Assessment Baseline Calculation (PABC). In total, 300 CCDFs (100 for each of the 3 replicates) were constructed and presented in the PABC report (Leigh et al. 2005) for total normalized releases. Three hundred realizations were needed to satisfy the criteria of 40 CFR § 194.34(d). Normalized release results for 10,000 simulations of possible futures were used to calculate each of the 300 CCDF curves. In addition, the DOE provided CCDFs for individual pathways.
The EPA's analysis concluded that the DOE adequately presented the PA results in CCDFs, which show the probability of exceeding various levels of cumulative releases (U.S. EPA 2006a, Section 12.0
).
Based on a review and evaluation of the CRA-2004 and supplemental information provided by the DOE, the EPA determined that the DOE continued to comply with the requirements of section 194.34(a) (see Recertification CARD No. 34: Results of Performance Assessments [194.34(a)]) (U.S. EPA 2006b).
There were changes in the CRA-2009 related to parameter updates, error corrections, and code improvements made since the CRA-2004 decision (see Appendix PA-2009, Section PA-2.1.1
for more details). The DOE developed CCDFs for the CRA-2009 using the same sampling process and CCDF computational technique as in the CCA and the CRA-2004 (see the CCA, Chapter 6.0, Section 6.1).
In total, 300 CCDFs (100 for each of the 3 replicates) for total normalized releases were constructed and presented in Appendix PA-2009 (Figure 34-1). Thus, the DOE continued to demonstrate compliance with the provisions of section 194.34(a).
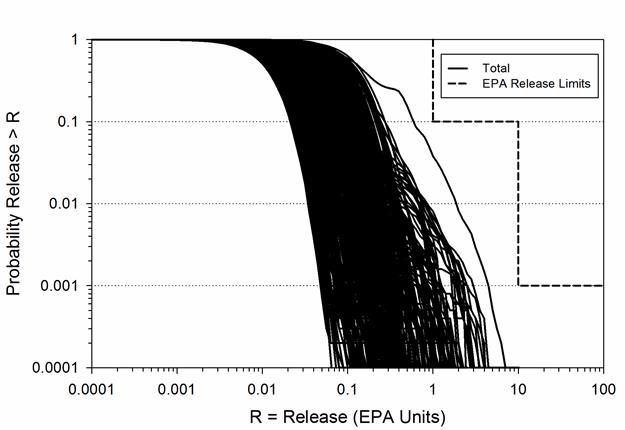
Figure 34-1. 300 CCDFs for Total Normalized Releases: CRA-2009 PA (from Figure 6-6 in Clayton et al. [2008], replotted with a maximum of 1 on the probability scale)
In addition to the 300 CCDFs constructed for the CRA-2009 PA, 300 CCDFs were also constructed for total normalized releases for the CRA-2009 PABC (Figure 34-2) (Clayton et al. 2010; Camphouse 2010). Normalized release results for ten thousand future simulations were again used to calculate each of the 300 CCDF curves. In addition, the DOE provided CCDFs for individual pathways and by replicate. The EPA's analysis (U.S. EPA 2010a) concluded that the DOE adequately presented the PA results in CCDFs, which show the probability of exceeding various levels of cumulative releases.
Based on a review and evaluation of the CRA-2009 and supplemental information provided by the DOE, the EPA determined that the DOE continued to comply with the requirements of section 194.34(a) (see Recertification CARD No. 34: Results of Performance Assessments [194.34(a)]) (U.S. EPA 2010b).
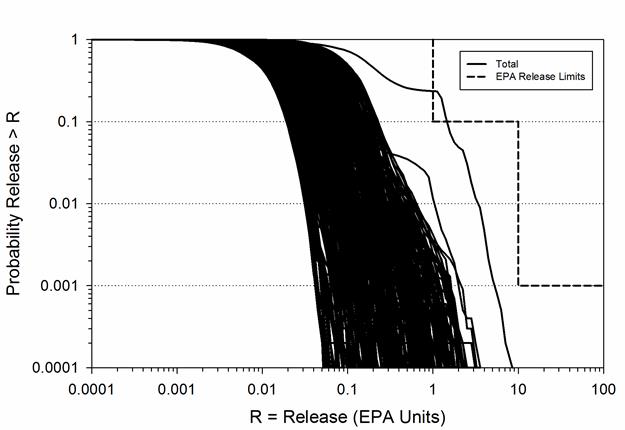
Figure 34-2. CRA-2009 PABC: Total Normalized Releases in EPA Units Replicates R1, R2, and R3 (Clayton et al. 2010, Figure 6-6
, replotted with EPA release limits)
There are changes in the CRA-2014 related to repository planned changes, parameter updates, and refinements to PA implementation made since the CRA-2009 decision (see Appendix PA-2014, Section PA-1.1
for more details). The DOE developed CCDFs for the CRA-2014 using the same sampling process and CCDF computational technique as in the CCA, CRA-2004, and CRA-2009 (see the CCA, Chapter 6.0, Section 6.1).
In total, 300 CCDFs (100 for each of the 3 replicates) for total normalized releases were constructed and presented in Camphouse et al. 2013 (Figure 34-3). Thus, the DOE continues to demonstrate compliance with the provisions of section 194.34(a).
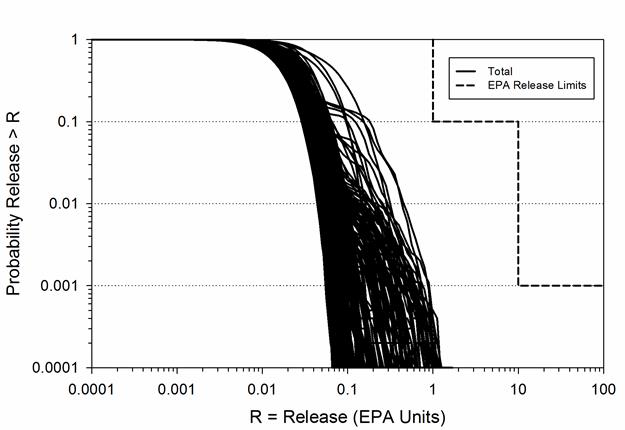
Figure 34-3. 300 CCDFs for Total Normalized Releases: CRA-2014 PA (Camphouse et al. 2013, Figure 6-51
, replotted with EPA release limits)
There is uncertainty associated with many of the parameters used in PA. 40 CFR § 194.34(b) addresses the need for the uncertain parameters to be sampled from a probability distribution (e.g., uniform, normal, etc.) that has been appropriately documented and justified.
To meet the criteria in section 194.34(b), the EPA expected the DOE to:
1. Discuss the sources used and the methods by which each of the probability distributions was developed (e.g., experimental data, field data, etc.)
2. Identify the functional form of the probability distributions (e.g., uniform, lognormal) used for the sampled parameters
3. Describe the statistics of each probability distribution, including the values for lower and upper ranges, mean (geometric mean when appropriate), and median
4. Demonstrate that the data used to develop the input parameter probability distribution were qualified and controlled in accordance with 40 CFR § 194.22
Upon reviewing the DOE's parameters, the EPA found that the DOE adequately documented the probability distributions in the CCA, Appendix PAR. In addition, the DOE discussed the data and method used to create the probability distribution of each of the 57 sampled variables. The DOE provided general information on probability distributions, data sources for parameter distribution, forms of distributions, bounds, and importance of parameters to releases. The EPA identified inconsistencies with some of the parameter values and probability distributions, but these were resolved for the CCA PAVT the EPA required the DOE to conduct (U.S. EPA 1998b, Section 5.0
).
The EPA determined that the DOE complied with the requirements of section 194.34(b). A complete description of the EPA's 1998 Certification Decision for section 194.34(b) can be obtained from the CARD 34, Section 34.B.5
(U.S. EPA 1998a).
Some parameter values and probability distributions in the CRA-2004 PA changed from those in the CCA PAVT. Many of these changes are related to inventory changes, but some are related to modeling assumption changes (see Leigh et al. 2005, Section 2.0
). However, the basic process the DOE used to develop the parameter information and sample the parameters did not change from the CCA methodology.
The DOE documented its selection of parameters and probability distributions for the key parameters in the CRA-2004, Chapter 6.0, Appendix PA-2004, Attachment PAR-2004, the CRA-2004 PABC report (Leigh et al. 2005), and associated references. The CRA-2004 PABC sampled 56 parameters whose values were obtained through random sampling in the PA (Kirchner 2005). There were changes to several of the parameters from the CRA-2004 PA for the CRA-2004 PABC (Leigh et al. 2005). The ultimate goal of parameter sampling was to capture uncertainties in the parameters and show their effects on the CCDFs, which the DOE discussed in the CRA-2004, Chapter 6.0, Sections 6.4 and 6.5, and in the CRA-2004 PABC report (see Leigh et al. 2005, Section 2.9
).
The EPA reviewed the DOE's parameter selection and probability distributions in several technical support documents related to computer codes (U.S. EPA 2006c and U.S. EPA 2006d), parameters (U.S. EPA 2006e, U.S. EPA 2006f, and U.S. EPA 2006g), and chemistry (U.S. EPA 2006a, U.S. EPA 2006f, and U.S. EPA 2006g). The EPA found that the DOE adequately documented the probability distributions. In addition, the DOE discussed the data and method used to create the probability distribution of each sampled variable.
Based on a review and evaluation of the CRA-2004 and PABC-2004 provided by the DOE, the EPA determined that the DOE continued to comply with the requirements of section 194.34(b) (see Recertification CARD No. 34: Results of Performance Assessments [194.34(b)]) (U.S. EPA 2006b).
Although 15 parameters were modified and 90 were added (Fox 2008, Table 6), the process that the DOE used to develop the parameter information and sample the parameters did not change from the EPA-approved CCA methodology (see Fox 2008 for parameter sample distribution information). Thus, the DOE continued to demonstrate compliance with the provisions of section 194.34(b).
The DOE documented its selection of parameters and probability distributions for the key parameters in Fox 2008 (Table 6), the Appendix PA-2009, the CRA-2009 PABC report (Clayton et al. 2010), and associated references. The CRA-2009 PABC also sampled 56 parameters; there were changes to several of the parameters for the CRA-2009 PABC (Clayton et al. 2010; Clayton 2010). The ultimate goal of parameter sampling continued to be to capture uncertainties in the parameters and show their effects on the CCDFs, which the DOE discussed in Fox (Fox 2008), Clayton et al. (Clayton et al. 2010), and Clayton (Clayton 2010).
The EPA reviewed the DOE's parameter selection and probability distributions in several Technical Support Documents related to computer codes (U.S. EPA 2010c), parameters (U.S. EPA 2010d), and chemistry (U.S. EPA 2010e). The EPA found that the DOE continued to adequately document the probability distributions and discussed the data from which, and the method by which, the probability distribution of each of the sampled variables was created.
Based on a review and evaluation of the CRA-2009 and supplemental information provided by the DOE, the EPA determined that the DOE continued to comply with the requirements of section 194.34(b) (see Recertification CARD No. 34: Results of Performance Assessments [194.34(b)) (U.S. EPA 2010b).
Although 105 parameters were modified and 100 were added (Kicker and Herrick 2013, Table 3) since the CRA-2009 PABC, the process that the DOE used to develop the parameter information and sample the parameters did not change from the EPA-approved CCA methodology (see Kicker and Herrick (Kicker and Herrick 2013) for parameter sample distribution information). Thus, the DOE continues to demonstrate compliance with the provisions of section 194.34(b).
The intent of 40 CFR § 194.34(c) is to ensure that the sampled parameters were appropriately selected for use in PA.
To demonstrate compliance with section 194.34(c), the EPA expected the DOE to do the following:
1. Discuss the computational techniques used for random sampling
2. Demonstrate that sampling occurred across the entire range of each parameter
The EPA agreed it was appropriate to use the Latin hypercube sampling (LHS) method for the 57 sampled parameters described in the CCA, Appendix PAR. The EPA concluded that the DOE adequately discussed the computational techniques and sampling ranges.
A complete description of the EPA's 1998 Certification Decision for section 194.34(c) can be obtained from CARD 34, Section 34.C.5
(U.S. EPA 1998a).
In the CRA-2004, the DOE used the same LHS methodology for sampling uncertain parameters as in the CCA. There was no change in the methodology.
The EPA determined during the CCA review that the LHS method ensures parameter values will be selected from the entire range of the probability distributions because LHS stratifies the probability distributions into a number (100, in this case) of equal-probability regions and then samples one value from each region. The EPA noted that the LHS method is appropriate for generating random samples (CARD 34, Section 34.C.5
) (U.S. EPA 1998a). The DOE used the same approach in the CRA-2004.
Based on a review and evaluation of the CRA-2004 and supplemental information provided by the DOE, the EPA determined that the DOE continued to comply with the criteria for section 194.34(c) (see Recertification CARD No. 34: Results of Performance Assessments [194.34(c)]) (U.S. EPA 2006b).
In the CRA-2009, the DOE used the same LHS methodology for sampling uncertain parameters as in the CCA and CRA-2004. There was no change in the methodology. Thus, the DOE continued to demonstrate compliance with provisions of section 194.34(c).
The EPA determined in the CCA and the CRA-2004 that the LHS sampling methodology ensures that parameter values will be selected from the entire range of the probability distributions because LHS stratifies the probability distributions into a number (100, in this case) of equal-probability regions and then samples one value from each region. The EPA noted that the LHS sampling continued to be appropriate for generating random samples in the 2009 PAs.
Based on a review and evaluation of the CRA-2009 and supplemental information provided by the DOE, the EPA determined that the DOE continued to comply with the requirements of section 194.34(c) (see Recertification CARD No. 34: Results of Performance Assessments [194.34(c)]) (U.S. EPA 2010b).
In the CRA-2014, the DOE uses the same LHS methodology for sampling uncertain parameters as in the CCA, CRA-2004, and CRA-2009 (Kirchner 2013). Thus, the DOE continues to demonstrate compliance with the provisions of section 194.34(c).
The intent of 40 CFR § 194.34(d) is to ensure that PA modeling appropriately sampled uncertain parameters and that future scenarios were appropriately used in PA.
To demonstrate compliance with section 194.34(d), the EPA expected the DOE to do the following:
1. Identify the number of CCDFs generated
2. Discuss how the DOE determined the number of CCDFs to be generated
3. Demonstrate that the maximum CCDF generated, at cumulative normalized releases of 1 and 10, exceeds the 99th percentile with at least a 0.95 probability, including examples of calculations
The EPA found the analysis presented in the CCA, Chapter 8.0, sufficient to show that 298 CCDF curves would satisfy the statistical criterion. The EPA's independent analysis also verified that the 300 CCDF curves computed and presented in the CCA were sufficient (CARD 34, Section 34.D.5
) (U.S. EPA 1998a). The DOE correctly interpreted the definition of the 99th percentile value, and applied standard mathematical expressions for deriving the probability of an outcome of multiple events (i.e., the generation of multiple CCDF curves). The probabilistic analysis was found to be appropriate for sampling with the LHS method, which achieves better coverage than nonstratified random sampling of parameter ranges.
A complete description of the EPA's 1998 Certification Decision for section 194.34(d) can be obtained from CARD 34, Section 34.D.5
(U.S. EPA 1998a).
In the CRA-2004, the DOE used the same methodology as in the CCA to generate 300 CCDFs in three sets (replicates) of 100. There was no change in the methodology.
The EPA noted that the DOE generated 3 sets of 100 CCDFs each and discussed the statistical confidence levels based on the entire set of CCDFs. Based on the analysis in the CCA and the fact that the DOE used the same approach in the CRA-2004, the EPA concurred with the DOE's CRA-2004 analyses.
Based on a review and evaluation of the CRA-2004 and supplemental information provided by the DOE, the EPA determined that the DOE continued to comply with the requirements of section 194.34(d) (see Recertification CARD No. 34: Results of Performance Assessments [194.34(d)]) (U.S. EPA 2006b).
In the CRA-2009, the DOE used the same methodology as in the CCA and CRA-2004 to generate 300 CCDFs in 3 sets (replicates) of 100. Thus, the DOE continued to demonstrate compliance with provisions of section 194.34(d).
The DOE generated three sets of 100 CCDFs each and discussed the statistical confidence levels for the set of CCDFs (Clayton et al. 2010; Camphouse 2010). Based on the analysis in the CRA-2009 and the fact that the DOE used the same approach in the CRA-2009 as in the CCA and CRA-2004 PAs, the EPA concurred with the DOE's CRA analyses.
Based on a review and evaluation of the CRA-2009 and supplemental information provided by the DOE, the EPA determined that the DOE continued to comply with the requirements of section 194.34(d) (see Recertification CARD No. 34: Results of Performance Assessments [194.34(d)]) (U.S. EPA 2010b).
In the CRA-2014, the DOE uses the same methodology as in the CCA, CRA-2004, and CRA-2009 to generate 300 CCDFs in 3 sets (replicates) of 100 (Zeitler 2013). Thus, the DOE continues to demonstrate compliance with provisions of section 194.34(d).
The intent of 40 CFR § 194.34(e) is to show the full range of CCDFs in order to provide an indication of the nature of the releases.
To demonstrate compliance with section 194.34(e), the EPA expected the DOE to do the following:
1. Display the full range of CCDFs generated
2. Include descriptive statistics such as the range, mean, median, etc., for the estimated CCDFs at cumulative releases of 1 and 10
The DOE employed LHS to create 3 independent replicates of 100 realizations each, yielding 300 CCDF curves. The DOE concluded that the requirement of section 194.34(e) was met. The EPA concurred with this conclusion.
A complete description of the EPA's 1998 Certification Decision for section 194.34(e) can be obtained from CARD 34, Section 34.E.5
(U.S. EPA 1998a).
There were no changes to the approach used by the DOE with regard to section 194.34(e) in the CRA-2004. The DOE presented and discussed the results of the PA analysis in the CRA-2004, Chapter 6.0, and the CRA-2004 PABC report (Leigh et al. 2005, Chapter 6), which display the full range of CCDFs generated. Furthermore, appropriate information needed to confirm the analysis and descriptive statistics for the estimated CCDFs was provided.
Based on a review and evaluation of the CRA-2004 and supplemental information provided by the DOE, the EPA determined that the DOE continued to comply with the requirements of section 194.34(e) (see Recertification CARD No. 34: Results of Performance Assessments [194.34(e)]) (U.S. EPA 2006b).
There were no changes to the approach used by the DOE with regard to section 194.34(e) in the CRA-2009. The full range of CCDFs generated for the CRA-2009 PA is shown in Figure 34-1. Thus, the DOE continued to demonstrate compliance with the provisions of section 194.34(e).
The DOE presented and discussed the results of the performance assessment analysis in the CRA-2009, Section 34 and
the 2009 PABC report (Clayton et al. 2010). Figure 34-2 shows the 300 CCDFs (100 for each of the 3 replicates) for total normalized releases that were constructed and presented in the 2009 PABC (Clayton et al. 2010). It is discussed further in CARD 34, Section 34.29.1
(U.S. EPA 2010b).
Based on a review and evaluation of the CRA-2009 and supplemental information provided by the DOE and the fact that the DOE included the full range of CCDFs as required by this section, the EPA determined that the DOE continued to comply with the requirements of section 194.34(e) (see Recertification CARD No. 34: Results of Performance Assessments [194.34(e)]) (U.S. EPA 2010b).
There are no changes to the approach used by the DOE with regard to section 194.34(e) in the CRA-2014 (Zeitler 2013). The full range of CCDFs generated for the CRA-2014 PA is shown in Figure 34-3. Thus, the DOE continues to demonstrate compliance with the provisions of section 194.34(e).
Because of the unique nature of the WIPP disposal system, the EPA wanted to ensure that the PA results could be used to adequately support a certification decision. To this end, the EPA required the DOE to demonstrate compliance with a high statistical confidence. For 40 CFR § 194.34(f), the DOE must show, in effect, that the mean of its 300 CCDF curves, and the 95th percentile upper confidence limit of the population mean, meet the containment requirements of section 191.13 for the cumulative releases at 1 and 10 times the quantities in Part 191 Appendix A, Table 1.
To demonstrate compliance with section 194.34(f), the EPA expected the DOE to present appropriate information, including steps used to arrive at the result and the data used in the analysis, allowing the EPA to confirm that the mean of the CCDF population meets the containment requirements of section 191.13 with a 95% statistical confidence level.
Upon analysis of the CCA PA, the EPA identified inconsistencies with some of the parameter values and probability distributions, and so the EPA required the DOE to conduct the CCA PAVT, which resolved the issues (U.S. EPA 1998b, Section 5.0
). The Certification Decision was based on the CCA PAVT results. The CCA PAVT results demonstrated that the mean of the CCDFs met the section 191.13 containment requirements and that the level of statistical confidence is significantly greater than 95%. Therefore, the EPA concluded that the final result of the CCA PAVT was in compliance with the containment requirements of section 191.13 and that the results were presented in accordance with section 194.34(f) (see CARD 34, Section 34.F.5
) (U.S. EPA 1998a).
In the CRA-2004, the DOE used the same general approach for calculating the statistical confidence for release limits as was used in the CCA. The DOE provided the CCDFs and uncertainty information in the CRA-2004 documentation.
The EPA's and the DOE's review of the CRA-2004 identified several errors that may have affected the CRA-2004 PA's compliance with section 194.34(f) (Cotsworth 2005). Incorrect LHS transfer files were used as input to PRECCDFGF for Replicates 2 and 3; thus, some of the same parameter inputs were used multiple times instead of being appropriately sampled for each replicate. A spallings release calculation for the volume fraction of contact-handled transuranic waste was omitted from CCDFGF, and an error in the input control file for the computer code SUMMARIZE affected spallings results. Finally, only 50 vectors for DRSPALL calculations were run for the CRA-2004 PA, instead of a full set of 100 vectors for each of the three replicates, thus potentially reducing the range of spallings releases.
Because of these problems, the EPA required the DOE to run a full set of DRSPALL vectors and correct the problem with LHS transfer files in the CRA-2004 PABC. The results of the CRA-2004 PABC are provided in the DOE's CRA-2004 PABC report (Leigh et al. 2005). In its review of the CRA-2004 PABC, the EPA concurred that the errors were corrected (see Recertification CARD No. 34: Results of Performance Assessments [194.34(f)]) (U.S. EPA 2006b).
Based on a review and evaluation of the CRA-2004 and supplemental information provided by the DOE, the EPA determined that the DOE continued to comply with the requirements of section 194.34(f) (Recertification CARD No. 34: Results of Performance Assessments [194.34(f)]) (U.S. EPA 2006b).
For the CRA-2009, the DOE used the same approach to calculate the statistical confidence for evaluation against the release limits as was used in the CCA and CRA-2004. The mean of the 300 CCDFs, along with the 95% confidence levels about the overall mean for the total normalized releases of the CRA-2009 PA, are shown in Figure 34-4.
Table 34-1 lists the overall mean total normalized release CCDF values of the CRA-2009 PA at the compliance probabilities of 0.1 and 0.001, along with the values of the upper and lower 95% confidence limit CCDFs at the same probabilities. More details on the normalized release results of the CRA-2009 PA are discussed in Appendix PA-2009, Section PA-9.0.
As seen in Figure 34-4 and Table 34-1, the results of the PA demonstrated a greater than 95% level of statistical confidence that the overall mean of the population of CCDFs is in compliance with the containment requirements of section 191.13, and thus the DOE continued to comply with provisions of section 194.34(f).
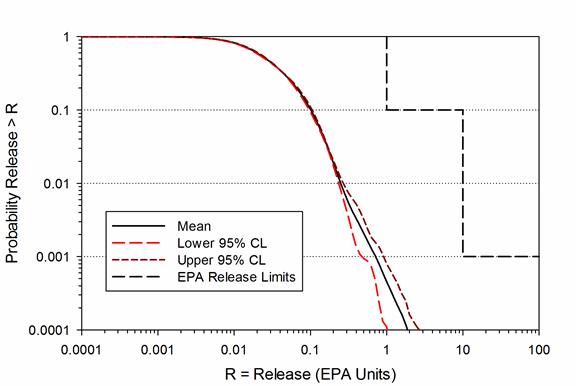
Figure 34-4. Mean and Confidence Interval CCDFs for Total Normalized Releases: CRA-2009 PA (from Figure 6-7 in Clayton et al. [2008])
Table 34-1. CRA-2009 PA Statistics on the Overall Mean for Total Normalized Releases at Probabilities of 0.1 and 0.001, All Replicates Pooled Compared with Release Limits (from Table 6-1 in Clayton et al. [2008])
|
Probability
|
Mean Total
Release
|
Lower 95% Confidence Limit
|
Upper 95% Confidence Limit
|
Regulatorya Limit
|
|
0.1
|
0.10
|
0.10
|
0.11
|
1
|
|
0.001
|
0.72
|
0.48
|
0.92
|
10
|
|
a Releases divided by the release limits in Part 191 Appendix A, Table 1.
|
The DOE believed that the information presented in this section and additional information in Appendix PA-2009 demonstrated continued compliance with section 194.34.
Figure 34-5 shows the overall mean of the total normalized releases for the 300 CCDFs, along with the 95% confidence levels about the overall mean, for the CRA-2009 PABC.
Figure 34-5. CRA-2009 PABC: Confidence Limits on Overall Mean for Total Normalized Releases (Camphouse 2010, Figure 3-33
).
As seen in Figure 34-2, one CCDF differed considerably from the other 299, and exceeded the compliance release limit (1 EPA unit) at a probability of 0.1. The CCDF in question was dominated by direct brine releases (DBRs) (Clayton et al. 2010). Increases in radionuclide solubilities as a result of inventory changes in the CRA-2009 PABC led to greater amounts of mobilized radionuclides calculated by the PANEL code and available for DBR (Garner 2010). DBR releases were overestimated because the volume of brine used in PANEL to calculate mobilized radionuclides per brine volume did not limit the volume of brine available for DBR in CCDFGF. The EPA examined this CCDF and determined that it did not affect disposal system compliance, which is determined by the mean of the 300 vectors.
Table 34-2 shows the overall mean total normalized release CCDF values for the CRA-2009 PA and CRA-2009 PABC at the compliance probabilities of 0.1 and 0.001 and the upper and lower 95% confidence values. These are compared to the CCA and CRA-2004 PAs. The EPA examined the CRA-2009 Section 34, CRA-2009 Appendix PA-2009, and the CRA-2009 PABC report (Clayton et al. 2010) to verify that there is at least a 95% level of statistical confidence that the mean of the population of CCDFs meets the containment requirements of 40 CFR 191.13.
Table 34-2. For Various PAs: Statistics on the Overall Mean for Total Normalized Releases (in EPA Units) at Probabilities of 0.1 and 0.001, All Replicates Pooled (from Section Evaluation of Compliance for 2004 Recertification of U.S. EPA 2010b)
|
Probability
|
PA Analysis
|
Mean Total Release
|
90th Quantile Total Release
|
Lower 95% CL
|
Upper 95% CL
|
Release Limit
|
|
0.1
|
CCA PAVT
|
0.124
|
0.192
|
0.123
|
0.137
|
1
|
|
|
CRA-2004
|
0.096
|
0.157
|
0.081
|
0.110
|
1
|
|
|
PABC-2004
|
0.088
|
0.148
|
0.085
|
0.091
|
1
|
|
|
CRA-2009
|
0.100
|
0.170
|
0.100
|
0.110
|
1
|
|
|
PABC-2009
|
0.090
|
0.160
|
0.090
|
0.100
|
1
|
|
0.001
|
CCA PAVT
|
0.382
|
0.391
|
0.281
|
0.436
|
10
|
|
CRA-2004
|
0.507
|
0.858
|
0.278
|
0.552
|
10
|
|
|
PABC-2004
|
0.601
|
0.809
|
0.518
|
0.681
|
10
|
|
|
CRA-2009
|
0.720
|
0.810
|
0.480
|
0.920
|
10
|
|
|
PABC-2009
|
1.100
|
1.000
|
0.370
|
1.770
|
10
|
|
CL = Confidence Limit
|
Based on a review and evaluation of the CRA-2009 and supplemental information provided by the DOE, the EPA determined that the DOE continued to comply with the requirements of section 194.34(f) (see Recertification CARD No. 34: Results of Performance Assessments[194.34(f)]) (U.S. EPA 2010b).
For the CRA-2014 PA, the DOE uses the same approach to calculate the statistical confidence for evaluation against the release limits as was used in the CCA, CRA-2004, and CRA-2009. The mean of the 300 CCDFs, along with the 95% confidence levels about the overall mean for the total normalized releases of the CRA-2014 PA, are shown in Figure 34-6.
Table 34-3 lists the overall mean total normalized release CCDF values of the CRA-2014 PA at the compliance probabilities of 0.1 and 0.001, along with the values of the upper and lower 95% confidence limit CCDFs at the same probabilities. More details on the normalized release results of the CRA-2014 PA are discussed in Appendix PA-2014, Section PA-9.5.
As seen in Figure 34-6 and Table 34-3, the results of the PA demonstrate a greater than 95% level of statistical confidence that the overall mean of the population of CCDFs is in compliance with the containment requirements of section 191.13, and thus the DOE continues to comply with provisions of section 194.34(f).
The overall mean CCDF is computed as the arithmetic mean of the three mean CCDFs from each replicate. Confidence limits are computed about the overall mean CCDF using the Student's t-distribution, the mean CCDFs from each replicate, and the standard error based on the three replicate means. Confidence limits, as they are implemented in PA, are defined vertically about the mean, rather than horizontally. An artifact of this convention is that lower confidence limits can sometimes assume negative values, which cannot be plotted on a logarithmic scale. When this occurs, the resulting lower confidence curve appears incomplete (Zeitler 2013).
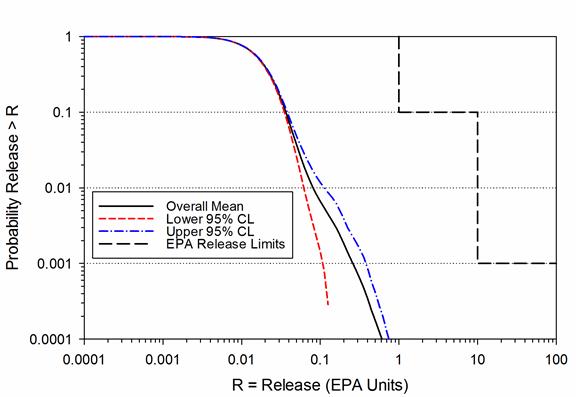
Figure 34-6. Mean and Confidence Interval CCDFs for Total Normalized Releases: CRA-2014 PA (from Figure 3-50 in Zeitler 2013)
Table 34-3. CRA-2014 PA Statistics on the Overall Mean for Total Normalized Releases at Probabilities of 0.1 and 0.001, All Replicates Pooled Compared with Release Limits (from Table 1 in Zeitler 2013)
|
Probability
|
Mean Total
Release
|
Lower 95% Confidence Limit
|
Upper 95% Confidence Limit
|
Regulatorya Limit
|
|
0.1
|
0.0367
|
0.0352
|
0.0384
|
1
|
|
0.001
|
0.261
|
0.109
|
0.384
|
10
|
|
a Releases divided by the release limits in Part 191 Appendix A, Table 1.
|
(*Indicates a reference that has not been previously submitted.)
Camphouse, R.C. 2010. Analysis Package (AP) for CCDFGF: CRA-2009 Performance Assessment Baseline Calculation (PABC). ERMS 553027. Carlsbad, NM: Sandia National Laboratories.* [PDF / Author]
Camphouse, R.C., D.C. Kicker, S. Kim, T.B. Kirchner, J.J. Long, B.N. Malama, and T.R. Zeitler. 2013. Summary Report of the 2014 Compliance Recertification Application Performance Assessment. Carlsbad, NM: Sandia National Laboratories.* [PDF / Author]
Clayton, D.J., S. Dunagan, J.W. Garner, A.E. Ismail, T.B. Kirchner, G.R. Kirkes, and M.B. Nemer. 2008. Summary Report of the 2009 Compliance Recertification Application Performance Assessment. ERMS 548862. Carlsbad, NM: Sandia National Laboratories. [PDF / Author]
Clayton, D.J., R.C. Camphouse, J.W. Garner, A.E. Ismail, T.B. Kirchner, K.L. Kuhlman, and M.B. Nemer. 2010. Summary Report of the CRA-2009 Performance Assessment Baseline Calculations. ERMS 553039. Carlsbad, NM: Sandia National Laboratories.* [PDF / Author]
Clayton, D.J. 2010. Parameter Summary Report: CRA-2009 PABC. ERMS 552889. Carlsbad, NM: Sandia National Laboratories.* [PDF / Author]
Cotsworth, E. 2005. Letter to U.S. Department of Energy (1 Enclosure). March 4, 2005. ERMS 538858. Washington, DC: U.S. Environmental Protection Agency, Office of Air and Radiation. [PDF / Author]
Fox, B. 2008. Parameter Report for the CRA-2009 PA (Revision 0). ERMS 549747. Carlsbad, NM: Sandia National Laboratories. [PDF / Author]
Garner, J.W. 2010. AP for PANEL: CRA-2009 PABC. ERMS 553032. Carlsbad, NM: Sandia National Laboratories.* [PDF / Author]
Kicker, D.C. and C.G. Herrick. 2013. Parameter Summary Report for the 2014 Compliance Recertification Application. Carlsbad, NM: Sandia National Laboratories.* [PDF / Author]
Kirchner, T.B. 2005. Generation of the LHS Samples for the CRA 2004 PA Baseline Calculations. ERMS 540279. Carlsbad, NM: Sandia National Laboratories. [PDF / Author]
Kirchner, T. 2013. Generation of the LHS Samples for the CRA-2014 (AP-164) PA Calculations, Revision 0. ERMS 559950. Carlsbad, NM: Sandia National Laboratories. [PDF / Author]
Leigh, C., J. Kanney, L. Brush, J. Garner, G. Kirkes, T. Lowry, M. Nemer, J. Stein, E. Vugrin, S. Wagner, and T. Kirchner. 2005. 2004 Compliance Recertification Application Performance Assessment Baseline Calculation (Revision 0). ERMS 541521. Carlsbad, NM: Sandia National Laboratories. [PDF / Author]
U.S. Department of Energy (DOE). 1996. Title 40 CFR Part 191 Compliance Certification Application for the Waste Isolation Pilot Plant (October). 21 vols. DOE/CAO 1996-2184. Carlsbad, NM: Carlsbad Area Office. [Author]
U.S. Department of Energy (DOE). 2004. Title 40 CFR Part 191 Compliance Recertification Application for the Waste Isolation Pilot Plant (March). 10 vols. DOE/WIPP 2004-3231. Carlsbad, NM: Carlsbad Field Office. [Author]
U.S. Environmental Protection Agency (EPA). 1993. "40 CFR Part 191: Environmental Radiation Protection Standards for the Management and Disposal of Spent Nuclear Fuel, High-Level and Transuranic Radioactive Wastes; Final Rule." Federal Register, vol. 58 (December 20, 1993): 66398-416. [PDF /Author]
U.S. Environmental Protection Agency (EPA). 1996. "40 CFR Part 194: Criteria for the Certification and Recertification of the Waste Isolation Pilot Plant's Compliance with the 40 CFR Part 191 Disposal Regulations; Final Rule." Federal Register, vol. 61 (February 9, 1996): 5223-45. [PDF /Author]
U.S. Environmental Protection Agency (EPA). 1998a. "CARD No. 34: Results of Performance Assessments." Compliance Application Review Documents for the Criteria for the Certification and Recertification of the Waste Isolation Pilot Plant's Compliance with the 40 CFR Part 191 Disposal Regulations: Final Recertification Decision (May) (pp. 34-1 through 34-29). Washington, DC: Office of Radiation and Indoor Air. [PDF / Author]
U.S. Environmental Protection Agency (EPA). 1998b. Technical Support Document: Overview of Major Performance Assessment Issues (May). Washington, DC: Office of Radiation and Indoor Air. [PDF / Author]
U.S. Environmental Protection Agency (EPA). 2006a. Technical Support Document for Section 194.23: Review of the 2004 Compliance Recertification Performance Assessment Baseline Calculation (March). Washington, DC: Office of Radiation and Indoor Air. [PDF / Author]
U.S. Environmental Protection Agency (EPA). 2006b. "Recertification CARD No. 34: Results of Performance Assessments." Compliance Application Review Documents for the Criteria for the Certification and Recertification of the Waste Isolation Pilot Plant's Compliance with the 40 CFR Part 191 Disposal Regulations: Final Recertification Decision (March) (pp. 34-1 through 34-12). Washington, DC: Office of Radiation and Indoor Air. [PDF / Author]
U.S. Environmental Protection Agency (EPA). 2006c. Technical Support Document for Section 194.23: Models and Computer Codes (March). PABC Code Changes Review. Washington, DC: Office of Radiation and Indoor Air. [PDF / Author]
U.S. Environmental Protection Agency (EPA). 2006d. Technical Support Document for Section 194.23: Review of WIPP Recertification Performance Assessment Computer Codes (March). CRA Code Review. Washington, DC: Office of Radiation and Indoor Air. [PDF / Author]
U.S. Environmental Protection Agency (EPA). 2006e. Technical Support Document for Section 194.23: Review of Changes to the WIPP Performance Assessment Parameters from the Compliance Recertification Application to Performance Assessment Baseline Calculation (March). PABC Parameter Review. Washington, DC: Office of Radiation and Indoor Air. [PDF / Author]
U.S. Environmental Protection Agency (EPA). 2006f. Technical Support Document for Section 194.24: Evaluation of the Compliance Recertification Actinide Source Term and Culebra Dolomite Distribution Coefficient Values (March). Washington, DC: Office of Radiation and Indoor Air. [PDF / Author]
U.S. Environmental Protection Agency (EPA). 2006g. Technical Support Document for Section 194.24: Review of the Baseline Inventory Used in the Compliance Recertification Application and the Performance Assessment Baseline Calculation (March). Washington, DC: Office of Radiation and Indoor Air. [PDF / Author]
U.S. Environmental Protection Agency (EPA). 2010a. Technical Support Document for Section 194.23: Review of the 2009 Compliance Recertification Performance Assessment Baseline Calculation (PABC-2009). Washington, DC: Office of Radiation and Indoor Air. Docket A-98-49, II-B2-23.* [PDF / Author]
U.S. Environmental Protection Agency (EPA). 2010b. "Results of Performance Assessments." 2009 Compliance Recertification Application (2009 CRA) Compliance Application Review Document (CARD) No. 34 (pp. 34-1 through 34-18). Washington, DC: Office of Radiation and Indoor Air.* [PDF / Author]
U.S. Environmental Protection Agency (EPA). 2010c. Technical Support Document for Sections 194.22 and 194.23: Review of WIPP Performance Assessment Computer Code Migration Activities. Docket A-98-48, II-B1-22. Washington, DC: Office of Radiation and Indoor Air.* [PDF / Author]
U.S. Environmental Protection Agency (EPA). 2010d. Technical Support Document for Section 194.23: Review of Changes to the WIPP Performance Assessment Parameters Since the 2004 PABC. Docket A-98-49, II-B1-21.* Washington, DC: Office of Radiation and Indoor Air.* [PDF / Author]
U.S. Environmental Protection Agency (EPA). 2010e. Technical Support Document for Section 194.24: Evaluation of the Compliance Recertification Actinide Source Term, Backfill Efficacy and Culebra Dolomite Distribution Coefficient Values. Docket A-98-49, II-B1-25. Washington, DC: Office of Radiation and Indoor Air.* [PDF / Author]
Zeitler, T.R. 2013. Analysis Package for CCDFGF: 2014 Compliance Recertification Application Performance Assessment (CRA-2014 PA). ERMS 560074. Carlsbad, NM: Sandia National Laboratories.* [PDF / Author]