Title 40 CFR Part
191
Subparts B and C
Compliance Recertification
Application
for the
Waste Isolation Pilot Plant
Appendix
MgO-2009
Magnesium Oxide as an Engineered Barrier
United States
Department of Energy
Waste Isolation Pilot Plant
Carlsbad Field
Office
Carlsbad, New Mexico
Appendix MgO-2009
Magnesium Oxide as an Engineered Barrier
MgO-2.0 Description of the Engineered Barrier System
MgO-2.1.3 Changes Since the CRA-2004 in Emplacement of MgO
MgO-2.2 Vendors That Provided or Are Providing MgO
MgO-2.2.1 Changes since the CRA-2004 in Vendors Proving MgO
MgO-3.0 Characteristics of MgO
MgO-3.1 Production of National Magnesia MgO
MgO-3.2.3 Results since the CRA-2004 in Characteristics of MgO
MgO-4.0 Hydration and Carbonation of MgO
MgO-4.1.1 Hydration of Premier MgO
MgO-4.1.2 Results since the CRA-2004 Regarding Hydration of MgO
MgO-4.2.1 Carbonation of Premier Chemicals MgO
MgO-4.2.2 Formation of Magnesite in the WIPP
MgO-4.2.3 Possible Passivation of MgO in the WIPP
MgO-5.0 Effects of MgO on the WIPP Disposal System
MgO-5.1 Effects of MgO on Brine Composition, fCO2, pH, and Actinide (An) Solubilities
MgO-5.1.1.1 Elimination of Chemical Conditions for Nonmicrobial Vectors
MgO-5.1.1.2 Substitution of GWB for Brine A
MgO-5.2 Effects of MgO on Colloidal Actinide (An) Concentrations
MgO-5.2.1 Results since the CRA-2004
MgO-5.3 Effects of MgO on Other Near-Field Processes and Conditions
MgO-5.3.1 Effects of MgO on Repository H2O Content
MgO-5.3.2 Effects of MgO on Gas Generation
MgO-5.3.2.1 Gas Generation from Anoxic Corrosion
MgO-5.3.2.2 Microbial Gas Generation
MgO-5.3.3 Effects of MgO on Room Closure
MgO-5.4 Effects of MgO on Far-Field An Transport
MgO-6.1 Effects of Microbial Respiratory Pathways on the MgO Excess Factor
MgO-6.2 History of the MgO Excess Factor
MgO-6.2.1 Establishment of the MgO Excess Factor
MgO-6.2.2 Reduction of the MgO Excess Factor from 1.95 to 1.67
MgO-6.2.3 Additional Developments Relevant to the MgO Excess Factor Prior to the CRA-2004
MgO-6.2.3.1 Additional Evidence for Microbial Methanogenesis under Expected WIPP Conditions
MgO-6.2.3.2 The DOE’s Analysis of Transport of Naturally Occurring SO42- into WIPP Disposal Rooms
MgO-6.2.4 Changes since the CRA-2004 in the MgO Excess Factor
MgO-6.2.4.1 The RSI’s Expert Review of the DOE’s Use of MgO
MgO-6.2.4.2 The DOE’s PCR for EPA Approval of Reducing the MgO Excess Factor from 1.67 to 1.2
MgO-6.2.4.4 The DOE’s Assessment of the Uncertainties Related to the MgO Excess Factor
MgO-6.2.4.4.1 Uncertainties in the CO2 Yield From Microbial Consumption of CPR Materials
MgO-6.2.4.4.2 Uncertainties in the Quantity of MgO that will be Available to Consume CO2
MgO-6.2.4.4.3 Uncertainties in the Number of Moles of CO2 Consumed per Mole of Available MgO
MgO-6.2.4.4.4 Conclusions Regarding the Uncertainties Related to the MgO Excess Factor
MgO-6.2.4.5 Revision of the DOE’s Assessment of the Uncertainties Related to the MgO Excess Factor
Figure MgO-1. Supersacks of MgO Emplaced on Top of the Waste Stack
% percent
mm micrometer
AISinR a synthetic brine representative of fluids sampled from the Culebra Member of the Rustler Formation in the WIPP air intake shaft
ALARA as low as reasonably achievable
am amorphous
AMWTP Advanced Mixed Waste Treatment Program
An(III) actinide element(s) in the III oxidation state
An(IV) actinide(s) in the IV oxidation state
An(V) actinide(s) in the V oxidation state
aq aqueous
ASTM American Society for Testing and Materials
atm atmosphere(s)
BNL Brookhaven National Laboratory
BRAGFLO Brine and Gas Flow
Brine A a synthetic brine representative of intergranular Salado brines
C Celsius
CCA Compliance Certification Application
CCDF complementary cumulative distribution function
CH-TRU contact-handled transuranic
CPR cellulosic, plastic, and rubber
CRA Compliance Recertification Application
DI deionized
DOE U.S. Department of Energy
DRZ disturbed rock zone
E. coli Escherichia coli
EPA U.S. Environmental Protection Agency
EQ3/6 a geochemical software package for speciation and solubility calculations (EQ3NR) and reaction-path calculations (EQ6)
ERDA-6 Energy Research and Development Administration (WIPP Well) 6
FMT Fracture-Matrix Transport
ft foot
g gaseous or gram
gal gallon
g/mol grams per mole
GWB Generic Weep Brine
HDPE high-density polyethylene
ICP-AES inductively coupled plasma-atomic emission spectroscopy
INEEL Idaho National Engineering and Environmental Laboratory
Kd matrix distribution coefficient
kg kilogram
kg/g kilograms per gram
kg/lb kilograms per pound
L liter
lb pound
LOI loss-on-ignition
m meter or molal
M molar
m/s meters per second
m2/s meters squared per second
m3 cubic meters
mL milliliter
mm millimeter
mM millimolar
mol mole
mol % mole percent
ND not determined
nm nanometer
NRC National Research Council
OECD Organisation for Economic Cooperation and Development
PA performance assessment
PABC Performance Assessment Baseline Calculations
PAVT Performance Assessment Verification Test
PCR Planned Change Request
pH the negative, common logarithm of the activity of H+
RCRA Resource Conservation and Recovery Act
RH relative humidity
RSI Institute for Regulatory Science
RTR real-time radiography
s second(s) or solid
SCA S. Cohen and Associates
SEM scanning electron microscopy
SNL Sandia National Laboratories
SPC Salado Primary Constituents, a synthetic brine similar to Brine A
STTP Source Term Test Program
SWB standard waste box
TDOP ten-drum overpack
TEA Trinity Engineering Associates
TGA thermal gravimetric analysis
TIC total inorganic carbon
TRU transuranic
VE visual examination
vol % volume percent
WIPP Waste Isolation Pilot Plant
wt % weight percent
WTS Washington TRU Solutions, LLC
XRD X-ray diffraction
Al2O3 aluminum oxide or alumina
Am americium
An actinide
Br bromine
C carbon
Ca calcium
CaCl2 calcium chloride
Ca2+ calcium ion
CaCO3 calcite
CaMg(CO3)2 dolomite
CaMg3(CO3)4 huntite
CaMgSiO4 monticellite
CaO calcium oxide or lime
CaO×MgO dolime
CaSO4 anhydrite
CH4 methane
Cl- chloride ion
Cl chlorine
CO2 carbon dioxide
CO32- carbonate ion
fco2 fugacity of CO2
Fe iron
Fe2O3 Fe(III) oxide, ferric oxide, or hematite
FeAl2O4 hercynite
FeCr2O4 chromite
H+ hydrogen ion
H2O water (aq or g)
H2S hydrogen sulfide
K+ potassium ion
Mg magnesium
Mg(OH)2 brucite
Mg2+ magnesium ion
Mg2SiO4 forsterite
Mg4(CO3)3(OH)2×3H2O hydromagnesite (4323)
Mg5(CO3)4(OH)2×4H2O hydromagnesite (5424)
MgAl2O4 spinel
MgCO3 magnesite
MgCO3×3H2O nesquehonite
MgCr2O4 magnesiochromite
MgO magnesium oxide
Mn manganese
N2 nitrogen
Na sodium
Na+ sodium ion
Na2Ca(SO4)2 glauberite
NaCl sodium chloride or halite
NO3- nitrate ion
Np neptunium
O2 oxygen
O2× - anionic dioxygenyl radical
OH- hydroxide ion
OH• hydroxyl radical(s)
Pb lead
periclase pure, crystalline MgO, the primary constituent of the WIPP engineered barrier
Pu plutonium
SiO2 silicon dioxide or silica
SO4 sulfate
SO42- sulfate ion
Ti(Fe,Mg)2O4 ulvöspinel
Th thorium
U uranium
The U.S. Department of Energy (DOE) is emplacing magnesium oxide (MgO) in the Waste Isolation Pilot Plant (WIPP) repository to provide an engineered barrier that decreases the solubilities of the actinide (An) elements in transuranic (TRU) waste in any brine present in the postclosure repository (U.S. Department of Energy 1996a, Appendix BACK; Appendix SOTERM; U.S. Department of Energy 2004, Appendix BARRIERS; Appendix PA, Attachment SOTERM). Because it will decrease An solubilities, MgO helps meet the U.S. Environmental Protection Agency’s (EPA’s) requirement for multiple natural and engineered barriers, one of the assurance requirements in its regulations for radioactive waste repositories at 40 CFR § 191.14(d) (U.S. Environmental Protection Agency 1993).
In 40 CFR § 191.12 (U.S. Environmental Protection Agency 1993), the EPA defined barriers as “any material or structure that prevents or substantially delays movement of water or radionuclides toward the accessible environment. For example, a barrier may be a geologic structure, a canister, a waste form…or a material placed over and around waste provided that the material or structure substantially delays movement of water or radionuclides.”
The DOE proposed four engineered barriers in its Compliance Certification Application (CCA) for the WIPP, submitted to the EPA in October 1996 (U.S. Department of Energy 1996a). The four engineered barriers proposed by the DOE were MgO, panel closures, shaft seals, and borehole plugs. The EPA, however, specified MgO as the only engineered barrier in the WIPP disposal system that meets the assurance requirement in its May 1998 certification rulemaking (U.S. Environmental Protection Agency 1998a; 1998b). The EPA specified MgO as the only engineered barrier because it considered panel closures, shaft seals, and borehole plugs to be part of the disposal-system design.
MgO as used in the WIPP will decrease An solubilities by consuming essentially all of the carbon dioxide (CO2) that would be produced should microbial activity consume all of the cellulosic, plastic, and rubber (CPR) materials in the TRU waste, waste containers, and waste-emplacement materials in the repository. Although MgO will consume essentially all the CO2, minute quantities (relative to the quantity that would be produced by microbial consumption of all of the CPR materials) will persist in the aqueous and gaseous phases. The residual quantities would be so small relative to the initial quantity that the adverb “essentially” is hereafter omitted in this appendix.
Consumption of CO2 will decrease An solubilities by (1) buffering the fugacity of CO2 (fCO2) at a value or within a range of values favorable from the standpoint of the speciation and solubilities of the An elements (the fugacity of a gaseous species, fi, is similar to the partial pressure of that species, pi); (2) controlling the pH at a value favorable from the standpoint of An solubilities; and (3) preventing the production of carbonate ion (CO32-) in significant quantities. The effect of this residual CO32- on the solubilities of An elements is described in Appendix SOTERM-2009, Section SOTERM-3.2.1 and Section SOTERM-3.3.1.3.
The effects of MgO carbonation (consumption of CO2) have been included in WIPP performance assessment (PA) calculations by assuming that there will be no CO2 in the repository. This assumption has been implemented in PA by (1) removing CO2 from the gaseous phase in the Brine and Gas Flow (BRAGFLO) calculations, thereby somewhat reducing the predicted pressurization of the repository; and (2) using the values of fCO2 and pH predicted for reactions among MgO, brine, and aqueous or gaseous CO2 to calculate An solubilities. The assumption that there will be no CO2 has been implemented in all compliance-related WIPP PA calculations. These include (1) the CCA PA calculations (Novak et al. 1996; the CCA, Appendix SOTERM), (2) the CCA Performance Assessment Verification Test (PAVT) (Novak 1997; U.S. Environmental Protection Agency 1998c, 1998d, and 1998e), (3) the PA calculations for the 2004 WIPP Compliance Recertification Application (CRA-2004) (U.S. Department of Energy 2004; the CRA-2004, Appendix PA, Attachment SOTERM), (4) the CRA-2004 Performance Assessment Baseline Calculations (PABC) (Brush and Xiong 2005a and 2005b, Brush 2005, Leigh et al. 2005), and (5) the CRA-2009 PA.
In this appendix, “MgO” refers to the bulk, granular material being emplaced in the WIPP to serve as the engineered barrier. MgO comprises periclase (pure, crystalline MgO–the main, reactive constituent of the WIPP engineered barrier) and various impurities described in Section MgO-3.0. Pure, crystalline MgO is always referred to as “periclase” in this Appendix. The term “periclase” and other mineral names used herein are, strictly speaking, restricted to naturally occurring forms of the materials that meet all the other requirements of the definition of a mineral (see, for example, Bates and Jackson 1984). However, mineral names are used in this report for convenience.
This section describes the emplacement of MgO in WIPP disposal rooms (Section MgO-2.1) and the vendors that provided or are providing MgO to the WIPP (Section MgO-2.2).
Washington TRU Solutions, LLC (WTS) (2005) provides the current specifications for the prepackaged MgO emplaced in the WIPP.
The DOE emplaced MgO in both supersacks and minisacks from the opening of the WIPP in March 1999 until January 2001. During this period, the MgO emplaced in supersacks and that emplaced in minisacks constituted about 85% and 15%, respectively, of the total quantity of MgO emplaced in the repository.
In 2000, however, the DOE requested EPA approval to eliminate the minisacks (Triay 2000, U.S. Department of Energy 2000); the EPA approved this request in 2001 (Marcinowski 2001, U.S. Environmental Protection Agency 2001). Section MgO-2.1.1 describes the supersacks; Section MgO-2.1.2 describes the minisacks and the reasons for their elimination; and Section MgO-2.1.3 describes changes since the CRA-2004.
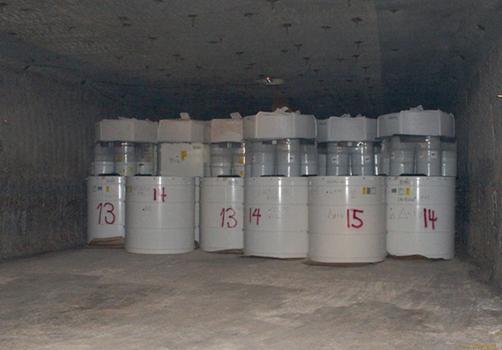
The DOE is emplacing MgO in polypropylene supersacks atop each stack of 3 7-packs of 55-gallon (gal) (208-liter [L]) drums, 3 standard waste boxes (SWBs), or various combinations of these and other waste containers. Other such containers include ten-drum overpacks (TDOPs), 4-packs of 85-gal (321-L) drums, and 3-packs of 100-gal (379-L) drums. According to WTS specifications, each supersack must contain 4200 ± 50 pounds (lb) (1905 ± 23 kilograms [kg]) of MgO (WTS 2005). Forklifts are used to place the supersacks on top of the waste stacks. Figure MgO-1 shows supersacks of MgO emplaced on top of the waste stack.
Emplacement of MgO in supersacks (1) facilitates handling and emplacement of MgO, (2) minimizes potential worker exposure to dust, and(3) minimizes the exposure of periclase (the main reactive constituent of MgO) to atmospheric CO2 and H2O during handling and emplacement, and prior to panel closure. Washington TRU Solutions (2005) provides detailed specifications for the supersacks. In particular, Washington TRU Solutions (2005) specifies that the supersacks “shall provide a barrier to atmospheric moisture and carbon dioxide (CO2) … equivalent to or better than that provided by a standard commercial cement bag” and “must be able to retain [their] contents for a period of two years after emplacement without rupturing from [their] own weight.” The specifications also require a certificate of compliance with all requirements of Washington TRU Solutions (2005) for every shipment of MgO (see below), and a certified chemical analysis for each new lot of MgO. The supersacks are subject to random receipt inspection at the WIPP to ensure compliance with the dimensions and labeling specified by Washington TRU Solutions (2005), and to identify any damage incurred during shipping.
Figure MgO-1. Supersacks of MgO Emplaced on Top of the Waste Stack
The supersacks contain dry, granular MgO, of which less than 0.5% can exceed 3/8 inches (9.5 millimeters [mm]) in diameter (Washington TRU Solutions 2005). Emplacement of granular MgO instead of powder (1) results in a bulk density high enough that sufficient MgO can be emplaced without causing major operational difficulties, (2) reduces the likelihood of dust formation and release in the event of premature supersack rupture, and (3) ensures that the permeability of the material is high enough to promote complete reaction with aqueous or gaseous CO2.
Creep closure of WIPP disposal rooms will rupture the supersacks and disperse the MgO among and within the ruptured waste containers. This will, in turn, expose the MgO to the room’s atmosphere, to any CO2 produced by the microbial consumption of CPR materials, and to H2O vapor and any brine present.
Initially, the DOE emplaced MgO in both supersacks and 25-lb (11-kg) minisacks. The minisacks were emplaced among the waste containers and between the waste containers and the ribs (sides) of the disposal rooms.
In its request for EPA approval to eliminate the minisacks (Triay 2000 and U.S. Department of Energy 2000), the DOE emphasized the need to reduce the industrial and radiological hazards associated with the manual emplacement of the minisacks. The DOE (U.S. Department of Energy 2000, p. 2) stated
Elimination of the mini-sacks will reduce the industrial hazards associated with the lifting and handling of the mini-sacks. While the bulk of the MgO backfill (85%) is contained in the supersacks which are emplaced using a forklift, each mini-sack of MgO must be emplaced manually. This requires that personnel emplace eighteen twenty-five pound mini-sacks around the drums for each waste stack, and 11 mini-sacks against the rib at the end of each row, a process which will be repeated for the more than 108,000 estimated waste stacks (about 2,142,000 mini-sacks) to be emplaced during the life of the facility. Handling and emplacing the mini-sacks requires excessive bending and lifting, as well as climbing ladders on an uneven surface to emplace mini-sacks in the upper tiers. Each of these actions [has] a risk of physical injury.
Also, elimination of the mini-sacks will reduce the potential radiation exposure to workers. This exposure has been evaluated by timing the steps associated with emplacement and estimating the radiological exposure over this time period (WID [Westinghouse Waste Isolation Division] 1997). Although the total potential dose is not excessive, particularly when spread over the life of the facility, any potential reduction of dose supports the ALARA (As Low As Reasonably Achievable) concept, which defines [the] DOE’s basic operating philosophy regarding radiation exposure. It is the installation of the mini-sacks that is responsible for most of the radiological dose associated with backfill emplacement. Elimination of the mini-sacks from the backfill system will result in the elimination of associated radiological exposure.
The DOE also demonstrated that eliminating the minisacks would (1) not affect the ability of MgO to function as an effective engineered barrier, thus meeting the EPA’s assurance requirement for multiple natural and engineered barriers; and (2) “[r]etain an acceptable safety factor ...” (U.S. Department of Energy 2000, p. 3). Section MgO-6.0 defines the MgO excess factor; Section MgO-6.2.2 describes the effect of eliminating the minisacks on the MgO excess factor.
Wang (2000a and 2000b) supported the DOE’s request to eliminate the minisacks by justifying the DOE assertion that doing so would not affect the ability of MgO to function as an effective engineered barrier and would not reduce the MgO excess factor to an unacceptable extent. Wang (2000a) (1) described new evidence from laboratory studies of microbial gas generation, which demonstrated that microbial methanogenesis could be an important process in the WIPP; and (2) showed that, if methanogenesis were the dominant microbial respiratory pathway, a smaller amount of CO2 would be generated and the MgO excess factor would increase from values of 1.95 prior to and 1.67 after the proposed elimination of the minisacks to values of 3.73 prior to and 3.23 after minisack elimination. Section MgO-6.1 describes the effects of microbial respiratory pathways on the MgO excess factor; Section MgO-6.2.2 discusses the effects of eliminating the minisacks on the MgO excess factor and the laboratory results demonstrating that methanogenesis could be an important respiratory pathway.
In addition, Wang (2000b) used a bounding calculation to demonstrate that, even in the absence of the minisacks, molecular diffusion in WIPP brines would be fast enough for MgO to control chemical conditions in the repository.
In its 2001 approval of the DOE’s request to eliminate the minisacks, the EPA stated, “… this change, … proposed to improve operational safety, will not significantly impact the WIPP’s long-term performance” (Marcinowski 2001). After inspecting the waste emplaced in Panel 1, the EPA also “found that DOE accurately represented the steps required to attach minisacks to the waste containers and the worker safety considerations involved in this activity” (U.S. Environmental Protection Agency 2001). Furthermore, the EPA (U.S. Environmental Protection Agency 2001) noted that “DOE’s conceptualization of MgO performance in the repository was very conservative,” and cited the following as examples:
· The DOE did not take credit for the beneficial effects of MgO hydration on the long-term performance of the repository.
· The “DOE proposes to reduce only excess MgO, which was not used in the [PA] calculations” and “there would still be a large excess of MgO relative to any potential evolved carbon [C].”
· “Attachment 4 [Wang (2000b)] concludes that molecular diffusion alone can effectively mix brine with MgO from degraded super-sacks in a repository that has experience[d] salt creep closure.… We reviewed DOE’s calculations and agree these processes will function as expected and sufficient MgO will be available to react.”
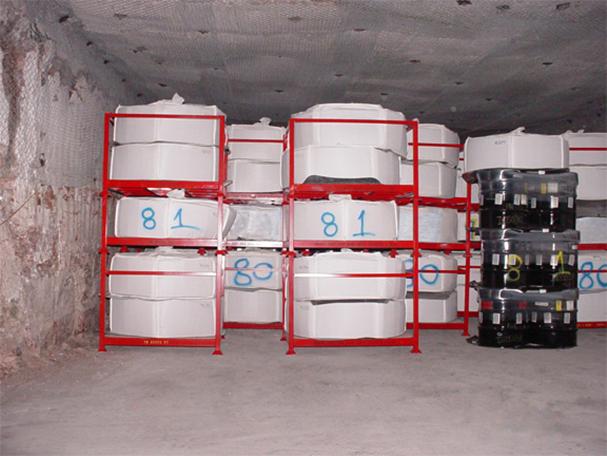
In March 2004, the EPA approved the emplacement in the WIPP of compressed (supercompacted) waste from the Advanced Mixed Waste Treatment Project (AMWTP) at the Idaho National Engineering and Environmental Laboratory (INEEL) (Marcinowski 2004, Trinity Engineering Associates 2004, and U.S. Environmental Protection Agency 2004). However, the EPA required that the DOE maintain an MgO excess factor (Section MgO-6.0) of 1.67 on a room-by-room basis. Some of the AMWTP waste contains concentrations of CPR materials that are high relative to the average concentration of CPR materials in TRU waste, thereby necessitating the emplacement of additional MgO in the repository. To account for this, the DOE has emplaced additional MgO supersacks on racks among the waste containers. Each rack contains 5 supersacks identical to those placed on top of the waste containers, and spans the same vertical distance normally occupied by the waste stack (3 7-packs of 55-gal [208-L] drums, 3 SWBs, or various combinations of these and other waste containers) and the supersack emplaced atop the waste stack. Thus, emplacing additional MgO in the repository uses space normally occupied by contact-handled (CH) transuranic (TRU) (CH-TRU) waste. Figure MgO-2 shows a rack used to emplace additional MgO in the WIPP.
National Magnesia Chemicals in Moss Landing, CA, was the first vendor to provide MgO for the WIPP. National Magnesia supplied MgO from the opening of the WIPP in March 1999 through mid-April 2000; during this period, waste was emplaced only in Panel 1, Room 7. This vendor was sometimes referred to as National Refractory Materials (e.g., Papenguth 1999). Note that in every seven-room WIPP panel, waste is emplaced in Room 7, at the back of the panel first and in Room 1 last.
After National Magnesia stopped producing MgO,
WTS considered Martin Marietta Magnesia Specialties LLC,
currently headquartered in Baltimore, MD, and Premier Chemicals
of Gabbs, NV, as
potential vendors. At the request of the DOE’s
Carlsbad Area Office, Papenguth (1999)
Figure MgO-2. Racks Used to Emplace Additional MgO
carried out a technical evaluation of MgO from both Martin Marietta and Premier to support WTS’s selection of a new vendor. The criteria used for this evaluation included density; particle size; purity; and reactivity, quantified using a test developed by Krumhansl et al. (1997) . Based on cost and the results of the technical evaluation, WTS selected Premier Chemicals. This vendor supplied MgO from mid-April 2000 (Panel 1, Room 7) through January 2005 (Panel 2, Room 2).
Section MgO-3.2 presents the results of the Premier MgO characterization.
Premier Chemicals informed WTS in 2004 that it would soon be unable to provide MgO that met the requirement for the minimum concentration of MgO specified by Washington TRU Solutions (2003): “The sum of MgO plus calcium oxide (CaO) shall be a minimum of 95%, with MgO being no less than 90%.”
Martin Marietta Magnesia Specialties, LLC, was selected and has supplied the MgO emplaced since January 2005 (Panel 2, Room 2). Martin Marietta MgO was selected based on cost and a technical evaluation of its suitability by Wall (2005). The results of this study and additional characterization of Martin Marietta MgO are described in more detail in Section MgO-3.3.2.
Because Martin Marietta did not begin supplying MgO until January 2005, all results reported for Martin Marietta MgO have been obtained since the CRA-2004 (Section MgO-3.3 and Section MgO-4.1.2).
This section describes the characteristics of the MgO provided to the WIPP by National Magnesia Chemicals (Section MgO-3.1), Premier Chemicals (Section MgO-3.2), and Martin Marietta Magnesia Specialties, LLC (Section MgO-3.3).
This section is based on a brief description provided by Papenguth (1999).
National Magnesia produced MgO for the WIPP by mixing seawater (the source of Mg(OH)2) with calcined limestone at their plant in Moss Landing, CA. Limestone is a rock that mainly comprises the mineral calcite (CaCO3) or other polymorphs of CaCO3. In some cases, this rock can comprise nearly pure calcite. Clay minerals and quartz commonly occur as impurities in limestone.
The calcination reaction for limestone is
CaCO3(s) ® CaO(s) + CO2(g). (MgO.1)
The formula for limestone on the left-hand side of Reaction (MgO.1) does not include impurities such as clay minerals and quartz, which presumably occur in small quantities in the material quarried to produce National Magnesia MgO.
National Magnesia then mixed seawater with the lime (CaO) obtained from Reaction (MgO.1). Although Papenguth (1999) did not describe the reaction(s) that occurred upon mixing, brucite (Mg(OH)2) presumably precipitated via a reaction similar to that discussed in Section MgO-3.3.1, except that National Magnesia used seawater instead of brine, and lime instead of dolime (CaO×MgO(solid[s])). Seawater solutes, such as sodium (Na+), calcium (Ca2+), chlorine (Cl-), and SO42-, presumably remained mainly in solution.
After filtering and washing the precipitate to remove all the seawater, National Magnesia hard-burned (calcined at 1000-1500 ºC [1832-2732 ºF]) the brucite to convert it to periclase via the reaction
Mg(OH)2(s) ® MgO(s) + H2O(g). (MgO.2)
Hard burning produces MgO that is more reactive than dead-burned MgO (calcined at 1500-2000 ºC [2732-3632 ºF]), but less reactive than light-burned MgO (calcined at 700-1000 ºC [1292-1832 ºF]).
This section describes the process that Premier Chemicals used to manufacture MgO for the WIPP (Section MgO-3.2.1), the DOE’s characterization of this product (Section MgO-3.2.2), and changes in the WIPP project’s understanding of its characteristics since the CRA-2004 (Section MgO-3.2.3).
This section is based on a brief description provided by the DOE (the CRA-2004, Appendix BARRIERS, Section BARRIERS-2.3.1).
Premier Chemicals produced MgO for the WIPP by mining ore from a sedimentary magnesite (MgCO3) deposit and calcining it to expel all CO2, thereby producing periclase directly instead of from calcined brucite:
MgCO3(s) ® MgO(s) + CO2(g). (MgO.3)
Calcination of accessory CaCO3 produced small quantities of lime. Calcination of other accessory minerals in the ore, such as clay minerals and quartz, created minor quantities of oxide and silicate minerals, such as spinel (MgAl2O4), ulvöspinel (Ti(Fe,Mg)2O4), forsterite (Mg2SiO4), and monticellite (CaMgSiO4). Calcination also drove off any H2O in the ore.
This section is based on the summary of the DOE’s characterization of Premier Chemicals MgO provided in the CRA-2004, Appendix BARRIERS, Section BARRIERS-2.3.1 and Section BARRIERS-2.3.2.1.
This section emphasizes the DOE’s identification and quantification of the reactive constituents periclase and lime, and the nonreactive constituents of Premier Chemicals MgO. In this appendix, reactive constituents refers to those solids that hydrate and carbonate to a significant extent on the time scales of the accelerated or WIPP-relevant laboratory experiments described below (Section MgO-4.1 and Section MgO-4.2). It is possible that the nonreactive constituents of Premier MgO (or the MgO provided by other vendors) could significantly hydrate and carbonate during the 10,000-year WIPP regulatory period. However, these experiments were designed to investigate the hydration and carbonation of the reactive constituents of MgO, not the relatively minor nonreactive constituents. Therefore, credit is not taken for possible CO2 uptake by the nonreactive constituents.
Bryan and Snider (2001a) reported that a typical chemical analysis of Premier Chemicals MgO yielded about 91 weight percent (wt %) MgO, 1 wt % alumina (Al2O3), 3 wt % silica (SiO2), 4 wt % CaO, and 1 wt % iron(III) (Fe(III)) oxide (Fe2O3). These chemical analyses did not differentiate between the MgO contained in the reactive constituent periclase and that contained in the nonreactive constituents spinel, ulvöspinel, forsterite, and monticellite; or between the CaO contained in the reactive constituent lime and that contained in the nonreactive constituent monticellite. However, most of the MgO and CaO occurred as periclase and lime, respectively, in Premier Chemicals MgO. On the other hand, some of the MgO and CaO, and most, if not all, of the Al2O3, SiO2, and Fe2O3 were present in the accessory oxide and silicate minerals described above.
Snider (2002, Figure 1, Figure 2, Figure 6, and Figure 7) observed that the hydration of Premier Chemicals MgO reached completion after formation of about 85 mole % (mol %) brucite in accelerated experiments. Snider (2003a) calculated that the average brucite concentration in this lot of Premier Chemicals MgO was 84.6 mol % after complete hydration, based on the last 8 data points of the inundated hydration experiment with deionized (DI) H2O at 90 ºC (194 ºF) (Snider 2002, Figure 1 and Figure 2) and the last 16 data points of the humid hydration run at 95% relative humidity (RH) and 80 ºC (176 ºF) (Snider 2002, Figure 6 and Figure 7). Therefore, it was assumed in the CRA-2004 that this lot of Premier Chemicals MgO contained 84.6 mol % periclase prior to hydration.
It is important to note that Snider (2002) determined the brucite concentration of the MgO hydration products by loss-on-ignition (LOI) analysis, which quantified the mass of H2O released by brucite upon heating to 500 ºC (932 ºF). However, based on the results of Deng et al. (2006) and Deng, Xiong, and Nemer (2007) (Section MgO-3.3.2), it is now clear that LOI or thermal gravimetric analysis (TGA) cannot readily differentiate between the H2O lost by brucite and portlandite. Therefore, Deng et al. (2006) and Deng, Xiong, and Nemer (2007) reported their results as mole percent brucite and portlandite or weight percent brucite and portlandite. Thus, the results of Snider (2002) are described as mole percent brucite and portlandite in this appendix, which correspond to the concentration in mole percent of periclase and lime prior to hydration.
Snider (2003b) used inductively coupled plasma-optical atomic spectroscopy (ICP-AES) and gravimetric analysis to quantify the mineralogical composition of one of the lots of Premier Chemicals MgO used for the hydration and carbonation experiments (Section MgO-6.0). Based on the assumption that the silicate in this MgO was forsterite, this lot of MgO contained 86.9 wt % periclase, 2.39 wt % lime, 2.07 wt % spinel, and 5.02 wt % forsterite. If the silicate was monticellite, this lot contained 88.7 wt % periclase, 1.27 wt % lime, 2.07 wt % spinel, and 5.76 wt % monticellite. Given the uncertainties inherent in quantifying the mineralogical composition of materials such as Premier Chemicals MgO, it is reasonable to conclude that this material contained about 90 wt % reactive constituents (periclase and lime) and 10 wt % nonreactive constituents (oxides and silicates).
Bryan and Snider (2001a) carried out particle-size analyses of two batches of MgO used for their experiments. Table MgO-1 provides the results of these analyses.
Snider and Xiong (2004) reported the results of experiments on the inundated hydration and the inundated carbonation of Premier Chemicals MgO. The objectives of this study were to determine why Snider (2002, 2003a) had observed that the hydration of Premier Chemicals MgO reached completion after formation of about 85 mol % brucite in three sets of experiments (Experiments 1, 2, and 3) and why the extent of Premier Chemicals MgO hydration in accelerated tests was less than expected (Snider 2002, 2003a, 2003b).
Snider and Xiong (2004, Section 3.1.2.1 and Section 3.3.2.1) conducted Experiment 1 to examine the effects of particle size on the extent of hydration and it yielded no useful data. The cause of the unexpectedly low extent of hydration was identified by Experiments 2 and 3 (below).
Table MgO-1. Particle-Size Distribution of Two Batches of Premier MgO (from Bryan and Snider [2001a])
|
Size Range (mm) |
Batch 1 |
Batch 2 |
|
< 0.15 |
31.0% |
9.89% |
|
0.15 to 0.30 |
8.36% |
29.4% |
|
0.30 to 0.50 |
4.59% |
29.7% |
|
0.50 to 0.71 |
3.50% |
15.0% |
|
0.71 to 2.00 |
14.2% |
14.5% |
|
> 2.00 |
37.4% |
1.53% |
Snider and Xiong (2004, Section 3.1.2.2 and Section 3.3.2.2) conducted Experiment 2 to test the validity of LOI analysis at 500 ºC (932 ºF). For this experiment, 22 separate runs were conducted with 5 grams (g) of reagent grade Fisher MgO and 100 milliliters (mL) of DI water in 125-mL polypropylene bottles at 90 ºC (194 ºF) for 1 to 15 days, followed by LOI analysis at 500 ºC (932 ºF). These runs yielded results from 87 to 99 mol % brucite, with no apparent increase in the extent of hydration from 1 to 15 days (Snider and Xiong 2004, Figure 8). Snider and Xiong (2004, p. 16) concluded, “The most likely reason for why hydration of Fisher MgO did not produce 100 mol % brucite in this experiment is that LOI analysis at 500 ºC (932 ºF) did not drive off all bound H2O (see Experiment 3 below).”
Snider and Xiong (2004, Section 3.1.2.3 and Section 3.3.2.3) performed Experiment 3 to further test the validity of LOI at 500 ºC (932 ºF) by conducting 8 runs with either 5 g of Fisher or Premier Chemicals MgO and 100 mL of DI water in 125 mL polypropylene bottles at 90 ºC (194 ºF) for 29 days, followed by LOI analysis at 500 or 750 ºC (932 or 1382 ºF). Table MgO-2 provides the results of Experiment 3. These results imply that (1) not all of the bound H2O is released during LOI analysis at 500 ºC (932 ºF), and (2) the concentration of brucite and portlandite in their hydration products and the concentration of periclase and lime for Premier Chemicals MgO prior to reaction were about 89 mol % and 92 wt % for the LOI analysis at 750 ºC (1382 ºF), thus confirming the impact of higher temperature on the LOI analysis.
This section discusses the process that Martin Marietta Magnesia Specialties LLC uses to produce MgO for the WIPP (Section MgO-3.3.1) and the DOE’s characterization of this product (Section MgO-3.3.2). Because Premier Chemicals was replaced by Martin Marietta in January 2005 (Section MgO-2.2.1), all the information described in this section has been obtained since the CRA-2004.
This section summarizes the process Martin Marietta Magnesia Specialties, LLC, uses to produce its MgO. This summary is based on information provided by Martin Marietta (Martin Marietta Magnesia Specialties 2006) and the text in Brush and Roselle (2006, Section 2.3.1).
Table MgO-2. Effects of LOI Analysis Temperature on the Extent of Hydration under Accelerated Conditions on Fisher and Premier Chemicals MgO
|
Type of MgO |
Brucite, 500 ºC |
Brucite, 500 ºC |
Brucite, 750 ºC (1382 ºF) (mol %) |
Brucite, 750 ºC (1382 ºF) (wt %) |
|
Fisher |
90.5 |
93.2 |
NAa |
NA |
|
Fisher |
90.2 |
93.0 |
NA |
NA |
|
Fisher |
NA |
NA |
97.3 |
98.2 |
|
Fisher |
NA |
NA |
98.5 |
99.0 |
|
Premier |
84.2 |
88.5 |
NA |
NA |
|
Premier |
83.0 |
87.6 |
NA |
NA |
|
Premier |
NA |
NA |
88.7 |
91.9 |
|
Premier |
NA |
NA |
89.4 |
92.4 |
|
a NA = not analyzed. |
||||
Martin Marietta pumps brine from a depth of about 762 m (2,500 feet (ft)) in the Michigan Basin. According to their website, this brine consists of CaCl2 + MgCl2 + H2O. This simplified composition of the brine does not include solutes such as Na+, K+, and SO42-, which are important constituents of WIPP brines and which presumably are present at least to some extent in brines from the Michigan Basin.
Martin Marietta produces dolime by calcining dolomite (CaMg(CO3)2) quarried in Ohio. Dolomite, which is also commonly referred to as “dolomitic limestone,” is a rock that mainly comprises the mineral dolomite. In some cases, this rock can comprise nearly pure dolomite.
The calcination reaction for dolomite is
CaMg(CO3)2(s) ® CaO×MgO(s) + 2CO2(g). (MgO.4)
The formula for dolomite on the left-hand side of Reaction (MgO.4) does not include impurities such as clay minerals and quartz, which presumably occur in small quantities in the rock quarried to produce Martin Marietta MgO.
Martin Marietta then mixes the brine, dolime, and water to produce a slurry containing dissolved CaCl2 and particulate Mg(OH)2 produced via the following reaction:
(CaCl2(aq) + MgCl2(aq) +
H2O(aq)) + CaO×MgO(s) +
2H2O(aq) ®
2Mg(OH)2(s) + 2CaCl2(aq) +
H2O(aq).
(MgO.5)
Note that CaCl2 and MgCl2 are written as neutral complex species instead of ionic species in Reaction (MgO.5), and that H2O is included on both sides of Reaction (MgO.5) to be consistent with the information on the Martin Marietta website.
Next, Martin Marietta allows the brucite to settle. They filter and wash it to remove all of the brine and the CaCl2 dissolved in this brine.
Finally, Martin Marietta hard-burns (calcines at 1000-1500 ºC [1832-2732 ºF]) the brucite to convert it to periclase via Reaction (MgO.2) (Section MgO-3.1).
This subsection reviews the DOE’s characterization of Martin Marietta Magnesia Specialties MgO, hereafter called Martin Marietta MgO. It is based on the text in Brush and Roselle (2006, Section 2.3).
This section emphasizes the DOE’s identification and quantification of the reactive and nonreactive constituents of Martin Marietta MgO. The meanings of reactive and nonreactive constituents are explained in Section MgO-3.2.
Wall (2005) carried out a technical evaluation on the suitability of Martin Marietta MgO. This evaluation, which supported the 2004 selection of Martin Marietta as the vendor of MgO for the WIPP (Section MgO-2.2.1), emphasized quantifying the concentration of the reactive phases periclase and lime, but also considered the rate at which these phases hydrate in accelerated tests.
Wall (2005) conducted accelerated hydration experiments (hydration of MgO in DI water at 90 ºC [194 ºF]) to (1) measure the concentrations of periclase and lime in these materials and compare them to those of Premier Chemicals MgO (Snider and Xiong 2004); (2) measure the accelerated hydration rates of the Martin Marietta products and compare them to those of Premier Chemicals MgO; (3) improve, if possible, the LOI technique used to measure the brucite and portlandite contents of MgO hydration products. Wall (2005) evaluated three materials from Martin Marietta: MagChem 10 WTS-20, MagChem 10 WTS-30, and MagChem 10 WTS-60. (“MagChem 10” is omitted hereafter.) All of these products are hard-burned MgO (calcined at 1000-1500 ºC [1832-2732 ºF]) with a specified MgO content of 95 wt % and a bulk density of 87 lb/cubic foot (ft3) (1,400 kg/cubic meter (m3)). Assay results are typically 97 wt % MgO. However, these results include MgO in phases other than periclase, such as other oxides or silicates (Section MgO-3.2.2).
Table MgO-3 compares Wall’s (2005) results for sample products WTS-20, WTS-30, and WTS-60 with those obtained by Snider and Xiong (2004) for Premier Chemicals MgO. Snider and Xiong (2004) and Wall (2005) reported the results of their MgO hydration product LOI analysis as mole percent brucite or weight percent brucite. However, based on the results of Deng et al. (2006) and Deng, Xiong, and Nemer (2007) (see below), it is now clear that LOI or TGA cannot readily differentiate between the H2O lost by brucite and portlandite. Therefore, Deng et al. (2006) and Deng, Xiong, and Nemer (2007) reported their results as mole percent brucite and portlandite or weight percent brucite and portlandite. Thus, the results of Snider and Xiong (2004) and Wall (2005) are described as mole percent brucite and portlandite or weight percent brucite and portlandite in this appendix, which corresponds to the mole percent or weight percent concentration of periclase and lime prior to hydration.
Table MgO-3 illustrates the effects of the materials used for the accelerated hydration experiments and the temperature used for LOI on the brucite and portlandite contents of the hydration products and—by assumption—the periclase and lime contents of these materials. Two important conclusions can be drawn from these results:
Table MgO-3. Effects of Temperature Used for LOI Analyses of MgO Hydration Products on the Brucite + Portlandite Concentrations of the Hydrated Samples. From Wall (2005, Table 1), Unless Otherwise Noted.
|
Material |
Temperature Used for LOI |
|||
|
500 ºCa |
750 ºCa |
|||
|
Mol % |
Wt % |
Mol % |
Wt % |
|
|
WTS-20 |
87 ± 5b |
91 ± 4b |
NDc |
NDc |
|
WTS-30 |
87 ± 5b |
91 ± 4b |
96 ± 5b |
97 ± 3b |
|
WTS-60 |
90 ± 3b |
93 ± 2b |
NDc |
NDc |
|
Premier |
85d |
89d |
89d |
92d |
|
a Snider and Xiong (2004) and Wall (2005) reported their results of LOI analysis of MgO hydration products as mole percent brucite or weight percent brucite. However, Deng et al. (2006a) and Deng, Xiong, and Nemer (2007) report their results as mole percent brucite + portlandite or weight percent brucite + portlandite (see text). In this appendix, all of these results are reported as mole percent brucite + portlandite or weight percent brucite + portlandite. b Reported uncertainties represent two standard deviations (2σ). c ND = not determined. d Snider and Xiong (2004). |
||||
1. All three materials from Martin Marietta have the same or higher contents of reactive constituents (periclase and lime) than Premier Chemicals MgO.
2. LOI at 750 ºC (1382 ºF) yields higher brucite and portlandite contents (and, by assumption, higher initial periclase and lime contents) than LOI at 500 ºC (932 ºF). The results obtained for Premier MgO since the CRA-2004 (Section MgO-3.2.3) imply that the 750 ºC (1382 ºF) results are more accurate than the 500 ºC (932 ºF) results.
Wall (2005) reported that LOI at 750 ºC (1382 ºF) was unsuccessful for WTS-20 and WTS-60 due to decrepitation of these samples at this temperature. Wall (2005) was unable to develop a procedure for LOI at 750 ºC (1382 ºF) that prevented decrepitation of these samples. However, the fact that LOI for WTS-60 at 500 ºC (932 ºF) yielded a higher brucite and portlandite content than LOI with WTS-30 at this temperature strongly suggested that the sample of WTS-60 tested by Wall (2005) had a periclase and lime content greater than or equal to that of WTS-30, and that the brucite and portlandite content of WTS-60 from LOI at 750 ºC (1382 ºF) would equal or exceed 96 ± 5 mol %, or 97 ± 3 wt % (see Table MgO-3). Therefore, it is reasonable to conclude based on these results that WTS-60, the MgO currently being emplaced in the WIPP, contains 96 ± 5 mol % (97 ± 3 wt %) periclase and lime.
Another important result of Wall’s (2005) work is that Martin Marietta MgO hydrated significantly faster in accelerated hydration experiments than Premier Chemicals MgO at the same temperature (90 ºC [194 ºF]). Although the DOE does not have any 25 ºC (77 ºF) hydration data for Martin Marietta MgO, comparison of the 90 ºC (194 ºF) data suggests that Martin Marietta MgO will hydrate faster—and carbonate faster—than Premier MgO at 28 ºC (82 ºF), the temperature in the undisturbed Salado Formation at the repository horizon and hence the temperature expected in the repository after it is filled and sealed (Munson et al. 1987).
Deng et al. (2006) and Deng, Xiong, and Nemer (2007) carried out additional characterization of Martin Marietta WTS-60 MgO, the MgO currently being emplaced in the WIPP. Their characterization included the following analyses, all of which were conducted on Lot SL2980076 of this material:
1. Particle-size analysis
2. Analysis of the chemical composition
3. Preliminary identification of the nonreactive constituents
4. LOI analysis and TGA of the reactive constituents in Martin Marietta WTS-60
This work was part of an ongoing laboratory study on the efficacy of Martin Marietta MgO (Deng, Nemer, and Xiong [2006] and Deng, Xiong, and Nemer [2007]).
Deng, Xiong, and Nemer (2007, Section 3.1) carried out particle-size analysis of Martin Marietta WTS-60 MgO by sieving. Table MgO-4 provides the results of their analysis.
Table MgO-4. Particle-Size Distribution of 10 Samples from One Lot of Martin Marietta MgO. Adapted from Deng, Xiong, and Nemer (2007, Table 3).
|
Size Range (mm) |
Average (wt %) |
Standard Deviation (wt %) |
|
> 2.0 mm |
7.02 |
0.91 |
|
1.0 to 2.0 mm |
32.5 |
1.76 |
|
600 micrometer (μm) to 1.0 mm |
20.2 |
1.28 |
|
300 μm to 600 μm |
12.7 |
2.19 |
|
150 μm to 300 μm |
5.4 |
0.70 |
|
75 μm to 150 μm |
3.4 |
0.35 |
|
< 75 μm |
17.9 |
1.88 |
Deng et al. (2006, Section 3.1 and Appendix B, Section B.1) and Deng, Xiong, and Nemer (2007, Section 3.2 and Appendix B, Section B.1) determined the overall chemical composition of Martin Marietta WTS-60 MgO by dissolving it in nitric acid, analyzing the liquid by ICP-AES, and weighing the remaining solids. They reported the following concentrations of oxides (average concentrations and standard deviations) based on 12 analyses of Lot SL2980076:
1. MgO: 98.5 ± 2.5 wt %
2. Al2O3: 0.13 ± 0.02 wt %
3. SiO2: 0.31 ± 0.01 wt %
4. CaO: 0.87 ± 0.03 wt %
5. Fe2O3: 0.12 ± 0.01 wt %
6. Total: 99.9 ± 2.5 wt %
These chemical analyses did not differentiate between the MgO and CaO contained in the reactive constituents periclase and lime and those contained in the nonreactive constituents. Preliminary characterization of the nonreactive constituents in WTS-60 suggests that they comprise (1) a spinel-group mineral that appears to be a solid solution of the four end members chromite (FeCr2O4), hercynite (FeAl2O4), magnesiochromite (MgCr2O4), and spinel; (2) hematite (Fe2O3); and (3) SiO2 (polymorph was not determined). The relative proportions of these phases also have not been determined. It is possible that one or more of these nonreactive constituents could also consume significant quantities of CO2 and H2O in the WIPP, albeit at lower rates than periclase and lime.
Deng et al. (2006, Section 3.2; Section 4; and Appendix B, Section B.2) and Deng, Xiong, and Nemer (2007, Section 3.3; Section 4; and Appendix B, Subsection B.2) established the concentration of reactive constituents in Martin Marietta WTS-60 MgO by (1) hydrating samples of this material in DI H2O at 90 ºC (194 ºF) for at least 3 days; (2) using LOI analysis and TGA to determine the quantity of H2O released by hydrated MgO from 150-800 ºC (302-1472 ºF); and (3) assuming that nonreactive components did not hydrate to a significant extent, and that any unbound water was lost at temperatures below 150 °C (302 ºF). In addition, they conducted a total carbon (C) analysis on samples of WTS-60 by C coulometry before and after hydration to ensure that precipitation of CaCO3, which might have occurred during hydration, did not affect the results of the LOI analyses and TGA. Based on eight LOI analyses and TGA, they reported that WTS-60 contains 96.0 ± 1.9 mol % (95.6 ± 1.7 wt %) periclase and lime (see Table MgO-5).
Table MgO-5. Results of LOI Analysis and TGA on WTS-60. From Deng et al. (2006), Table 7 and Table 8, and Deng, Xiong, and Nemer (2007), Table 8 and Table 9.
|
Reactive Constituent |
Average |
Standard Deviation |
Average |
Standard Deviation |
|
Periclase |
95.2a |
1.82a |
94.8b |
1.72b |
|
Lime |
0.6a |
0.04a |
0.9b |
0.02b |
|
Periclase + lime |
95.8a |
1.86a |
95.7c |
1.74b |
|
a From Deng et al. (2006a, Table 7). b From Deng et al. (2006a, Table 8). c Value corrected from the value of 95.6 provided by Deng et al. (2006a, Table 8). |
||||
This section reviews the results of the DOE’s studies on the hydration and carbonation of MgO (Section MgO-4.1 and Section MgO-4.2, respectively).
The DOE carried out extensive studies on the hydration of Premier Chemicals MgO under four versions of Test Plan 00-07 (Wang and Bryan 2000; Wang, Bryan, and Wall 2001; Snider and Xiong 2002b; Snider, Xiong, and Wall 2004); Section MgO-4.1.1 describes the results of these studies obtained prior to the CRA-2004. Since then, the DOE completed its studies on the hydration of Premier Chemicals MgO and initiated new studies with MgO from Martin Marietta Magnesia Specialties LLC (Deng, Nemer, and Xiong 2006; Deng, Nemer, and Xiong 2007); Section MgO-4.1.2 discusses the results of these studies.
This section, which reviews the results of studies on the hydration of Premier Chemicals MgO completed prior to the CRA-2004, is based on the text in the CRA-2004, Appendix BARRIERS, Section BARRIERS-2.3.2.1.
Bryan and Snider (2001a and 2001b), Snider (2002 and 2003b), and Xiong and Lord (2008) studied the hydration of Premier Chemicals MgO under humid and inundated conditions. They carried out humid experiments with 3 g of uncrushed Premier Chemicals MgO at an RH of 35, 50, 75, or 95% and temperatures of 25, 40, 60, or 80 ºC (77, 104, 140, or 176 ºF) for up to 460 days (Snider 2003b). Inundated experiments were conducted with 5 g of uncrushed Premier Chemicals MgO in 100 mL of DI H2O, 4.00 molar (M) sodium chloride (NaCl), Energy Research and Development Administration (ERDA)-6, or Generic Weep Brine (GWB) at temperatures of 25, 50, 70, and 90 °C (77, 122, 158, and 194 ºF) for up to 360 days (Snider 2003b). ERDA-6 brine is a synthetic brine representative of fluids in brine reservoirs in the Castile Formation (Popielak et al., 1983). Snider (2003c) verified that GWB is the average composition of intergranular fluids collected from the Salado at the original stratigraphic horizon of the repository and analyzed by Krumhansl, Kimball, and Stein (1991).
Based on these experiments with Premier Chemicals MgO, the most important hydration reaction expected in the WIPP is
MgO(s) + H2O(aq or g) ![]() Mg(OH)
2(s).
(MgO.6)
Mg(OH)
2(s).
(MgO.6)
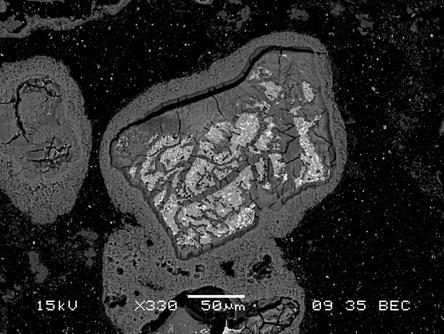
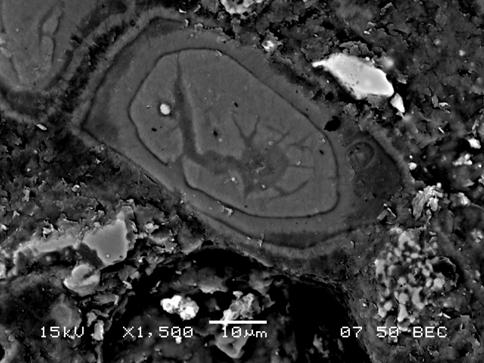
Reaction (MgO.6) was the only hydration reaction observed in the humid experiments. Reaction (MgO.6) was also the only hydration reaction observed in the inundated runs with ERDA-6 brine (Snider 2003b). In inundated experiments with GWB, hydration produced both brucite and an amorphous or crystalline Mg-OH-Cl-H2O phase (Snider 2003b). In most of the runs with GWB, the Mg-OH-Cl-H2O phase was amorphous and its exact composition was not determined. In a few experiments at 25 ºC (77 ºF), however, a crystalline phase with the composition Mg3(OH)5Cl×4H2O was identified by X-ray diffraction (XRD) analysis (Snider 2003b). The thermodynamic speciation and solubility code Fracture-Matrix Transport (FMT) (Babb and Novak 1997 and addenda; Wang 1998) also predicts that both brucite and a similar Mg-OH-Cl-H2O phase, Mg2(OH)3Cl×4H2O, would be present in GWB and Salado Primary Constituents (SPC) brine after these brines equilibrate with the solids in WIPP disposal rooms (Section MgO-5.1). SPC brine (Novak 1997) is similar to Brine A, another synthetic fluid that was used to represent intergranular Salado brines (see Section MgO-5.1.1.2 and Molecke 1983). The FMT thermodynamic database contains the phase Mg2(OH)3Cl×4H2O, but not Mg3(OH)5Cl×4H2O; if Mg3(OH)5Cl×4H2O were in the database, FMT might predict that Mg3(OH)5Cl×4H2O would be present in GWB instead of or along with Mg2(OH)3Cl×4H2O. However, long-term experiments with GWB suggested that brucite might be replacing the amorphous Mg-OH-Cl-H2O phase, possibly because the Mg(II)(aq) concentration of this brine was decreasing with time. Figure MgO-3 is a scanning electron microscope (SEM) image of Premier Chemicals MgO after hydration in GWB; Figure MgO-4 shows Premier Chemicals MgO after hydration in ERDA-6 brine. Figure MgO-3 and Figure MgO-4 provide visual evidence that the passivation of MgO will not occur in the repository.
Figure MgO-3. SEM Image of Premier Chemicals MgO after Hydration in GWB at 90 ºC (194 ºF) for 21 Days (SNL Experiment CC-GW-90-30-5). The Light-Gray Phase Inside the Large Grain at the Center of This Image is Unhydrated Periclase. The Bright Inclusions in this Periclase are Oxides and Silicates Such as Spinel, Ulvöspinel, Forsterite, and Monticellite (Section MgO-3.2.1 and Section MgO-3.2.2). The Dark-Gray Material Surrounding and Penetrating the Fractures in the Periclase is a Mg-OH-Cl-H2O Phase, Probably Amorphous or Crystalline Mg3(OH)5Cl×4H2O (Section MgO-4.1.1). Abundant Fractures are Seen Penetrating the Mg-OH-Cl-H2O Phase. The Dark-Gray Material Surrounding the Mg-OH-Cl-H2O Phase is Brucite. This Layer of Brucite Appears to be Loosely Attached to the Mg-OH-Cl-H2O Phase, Thus Facilitating the Continued Access of Brine to the Mg-OH-Cl-H2O Phase and Unhydrated Periclase.
Figure MgO-4. SEM Image of Premier Chemicals MgO after Hydration in ERDA-6 Brine at 70 ºC (158 ºF) after 21 days (SNL Experiment CC-ER-70-30-5). Two Concentric Layers of Brucite Surround an Inner Core of Brucite. The Outer Layers of Brucite Appear to be Loosely Attached to the Core.
Deng, Xiong, and Nemer (2007, Section 5) carried out accelerated hydration experiments with Martin Marietta MgO. The primary objective of the accelerated hydration experiments was to determine which factors (see below) have a significant effect on MgO hydration and carbonation kinetics. Deng, Xiong, and Nemer (2007, Section 5) also conducted experiments to assess the advantages and disadvantages of different types of containers, and the utility of tracer dyes for their ongoing study of the efficacy of Martin Marietta MgO (Deng, Nemer, and Xiong (2006) and Deng, Nemer, and Xiong (2007)). Fernández et al. (1999) identified particle size, solid-to-solution ratio, and stirring speed as important factors that affect the kinetics of carbonation of MgO slurries.
Therefore, Deng, Xiong, and Nemer (2007, Section 5) conducted an accelerated, inundated hydration study using a fractional factorial matrix to determine which of these three factors are important enough to include in their long-term hydration and carbonation studies. For the study, they used MgO with particle sizes less than 75 μm, which constituted about 18 wt % of their as-received material (see Table MgO-4); or 1.0 to 2.0 mm, which accounted for about 32 wt % of their material (Lot SL2980076 of Martin Marietta MagChem WTS-60 MgO, the material currently being emplaced in the WIPP). These are the particle-size ranges with the most particles in this lot of Martin Marietta WTS-60 MgO. Deng, Xiong, and Nemer (2007, Section 5) used MgO-to-brine ratios of 0.05, 0.4, or 1 g/mL; these values are within the range of 0.001 to 10 g/mL expected in the WIPP (Nemer 2006). Furthermore, the previous studies of the inundated hydration and carbonation of Premier Chemicals MgO (Section MgO-4.1.1 and Section MgO-4.2.1, respectively) were performed at an MgO-to-brine ratio of 0.05 g/mL; inclusion of this ratio in the accelerated hydration experiments with Martin Marietta MgO thus facilitated comparison with these results. Finally, the samples were placed in an oven or in a water-bath shaker at a shaking speed of 150 revolutions per minute to determine the effect of agitation. Deng, Xiong, and Nemer (2007, Section 5) carried out these experiments by placing Martin Marietta WTS-60 MgO and DI water in 30-mL high-density polyethylene (HDPE) centrifuge tubes or 125-mL HDPE serum bottles, depending on the MgO-to-brine ratio, and placed these containers in a water-bath shaker or an oven at 70 ºC (158 ºF) for periods of up to 43 days.
Deng, Xiong, and Nemer (2007, Section 5.4, p. 33) concluded,
[T]he small-particle-size samples hydrated faster than the large particle size during the first few days, which is probably due to the larger specific surface area … of the small particles. However for the remainder of the experiment, the large-particle-size samples hydrate faster than the small particle size. There are no obvious differences between experiments that were continuously stirred in a water-bath shaker and those that were kept in the oven. The MgO-water ratio did not significantly influence the hydration rate either. These visual observations have been confirmed by the Minitab [statistical] analysis...
Finally, Deng, Xiong, and Nemer (2007, Section 5.7) fitted the results of the accelerated, inundated-hydration experiments described above to one kinetic model in which the hydration rate is controlled by the surface area of the MgO particles, and to three models in which the rate is controlled by the diffusion of H2O through the layer of brucite that formed on the surfaces of the MgO particles. They concluded that the results obtained with the Martin Marietta WTS-60 MgO with small particle sizes (< 75 μm) are consistent with control by diffusion, but that the results obtained with the large (1.0 to 2.0 mm) particles are consistent with surface-area control.
The DOE also conducted extensive studies on the carbonation of Premier Chemicals MgO under Test Plan 00-07 (Wang and Bryan 2000; Wang, Bryan, and Wall 2001; Snider and Xiong 2002b; Snider, Xiong, and Nemer 2004); Section MgO-4.2.1 describes the results of these studies obtained prior to the CRA-2004. Since then, the DOE completed its carbonation studies with Premier Chemicals MgO (Section MgO-4.2.2) and started new work with Martin Marietta MgO (Deng, Nemer, and Xiong 2006 and 2007).
This section, which reviews the results of studies on the carbonation of Premier Chemicals MgO completed prior to the CRA-2004, is based on the text in the CRA-2004, Appendix BARRIERS, Section BARRIERS-2.3.2.2.
Bryan and Snider (2001a and 2001b), Snider (2002), Snider and Xiong (2002a), Xiong and Snider (2003), and Xiong and Lord (2008) studied the carbonation of Premier Chemicals MgO and reagent-grade materials under inundated conditions. Experiments were carried out with 5 g of uncrushed Premier Chemicals MgO in 100 mL of DI H2O, 4.00 M NaCl, ERDA-6 brine, or GWB under an atmosphere of compressed, ambient, laboratory air at room temperature for up to 327 days (Snider and Xiong 2002a). Inundated experiments were also conducted with uncrushed Premier Chemicals MgO; crushed, prehydrated Premier Chemicals MgO; Fisher reagent-grade periclase; or prehydrated Fisher periclase in 100 mL of ERDA-6 brine or GWB under an atmosphere containing 5% CO2 for periods up to 91 days (Snider and Xiong 2002a). Humid experiments were performed with 2.5 g of prehydrated Fisher periclase in an atmosphere consisting of compressed, ambient, laboratory air at an RH of 33, 58, 75, or 95% at room temperature and 40 ºC (104 ºF).
Based on these experiments, the carbonation reaction expected in the WIPP in the short term (a few hundred to a few thousand years) is
5Mg(OH)2(s) + 4CO2(aq or g) ![]() Mg
5(CO3)4(OH)2×4H2O(s).
(MgO.7)
Mg
5(CO3)4(OH)2×4H2O(s).
(MgO.7)
In experiments with ERDA-6 brine and atmospheric CO2, Snider and Xiong (2002a) detected hydromagnesite with the composition Mg5(CO3)4(OH)2×4H2O by XRD analysis. This solid is referred to as “hydromagnesite (5424)” in this appendix. No other magnesium (Mg) carbonates were detected in runs with ERDA-6 brine and atmospheric CO2. Snider and Xiong (2002a) detected both hydromagnesite (5424) and nesquehonite (MgCO3×3H2O) by XRD analysis in the experiments with ERDA-6 brine and 5% CO2, but hydromagnesite (5424) was clearly replacing nesquehonite as these experiments proceeded. In experiments with GWB, hydromagnesite (5424) was the only Mg carbonate detected by XRD analysis (Snider and Xiong 2002a). Therefore, there is strong evidence that hydromagnesite (5424) will be the dominant Mg carbonate for at least part of the 10,000-year regulatory period (the first few hundred to few thousand years).
There are at least two forms of hydromagnesite: hydromagnesite (5424) (see above) and hydromagnesite with the composition Mg4(CO3)3(OH)2×3H2O. The latter is referred to as “hydromagnesite (4323)” in this appendix. Thermodynamic data for both of these forms of hydromagnesite are available; geochemical modeling carried out for the WIPP project (see Section MgO-5.1) has always predicted that hydromagnesite (5424) will form under expected WIPP conditions instead of hydromagnesite (4323) if magnesite is suppressed (i.e., prevented from forming by switching off magnesite in the EQ36 or FMT input file). Moreover, hydromagnesite (5424) was the only form of hydromagnesite produced in laboratory experiments on the carbonation of Premier Chemicals MgO (i.e., hydromagnesite (4323) was not reported). However, predictions of the effects of MgO on the chemical conditions in WIPP disposal rooms and the solubilities of An elements under these conditions suggest that the effects of hydromagnesite (5424) and hydromagnesite (4323) would be similar (compare Table MgO-7 and Table MgO-8 in Section MgO-5.1).
Section MgO-4.2.2 describes the conversion of hydromagnesite (5424) to magnesite in the WIPP.
The DOE stated in the CCA, Appendix BACK and Appendix SOTERM, that magnesite would be the Mg carbonate present throughout the 10,000-year regulatory period. This conclusion was based on calculations by Novak et al. (1996) with the geochemical speciation component of the FMT code (Babb and Novak 1995), which demonstrated that magnesite is thermodynamically stable with respect to hydromagnesite and other Mg carbonates under expected WIPP conditions. Because magnesite is the stable Mg carbonate, the DOE maintained that the brucite-magnesite or the hydromagnesite (5424)-magnesite carbonation reaction
Mg(OH)2(s) + CO2(aq or g) ![]() MgCO
3(s) + H2O(aq or
g)
(MgO.8)
MgCO
3(s) + H2O(aq or
g)
(MgO.8)
Mg5(CO3)4(OH)2×4H2O(s) +
CO2(aq or g) ![]() 5MgCO
3(s) + 5H2O(aq or g) (MgO.9)
5MgCO
3(s) + 5H2O(aq or g) (MgO.9)
would buffer fCO2 in the repository at a value of 1.26 × 10⁻⁷ atmospheres (atm), and used this value of fCO2 (along with other parameters) to calculate An speciation and solubilities for the CCA PA (CCA, Appendix SOTERM, p. SOTERM-6).
Recent thermodynamic calculations carried out by Brush and Xiong (2003a), Brush (2005), and Brush et al. (2006) with FMT (Babb and Novak 1997 and addenda; Wang 1998) and the EQ3/6 geochemical software package (Daveler and Wolery 1992; Wolery 1992a and 1992b; Wolery and Daveler 1992) have also predicted that magnesite is stable with respect to hydromagnesite (5424), hydromagnesite (4323), and other Mg carbonates under expected WIPP conditions.
Furthermore, magnesite is commonly observed in the Salado (Lang 1939; Adams 1944; Lowenstein 1983 and 1988; Stein 1985) and in other formations in the Delaware Basin (Garber, Harris, and Borer 1990). Lowenstein (1988, p. 598) describes the siliciclastic-carbonate mudstone, in which magnesite is most abundant, as a “non-evaporitic sediment,” and attributes its origin to subaqueous “settling of fine-grained, suspended material in the center of the Salado basin where the energy of inflow waters had largely dissipated.” Therefore, the magnesite observed in the Salado did not necessarily form in situ. However, Garber, Haris, and Borer (1990), who reported that magnesite “occurs pervasively” throughout an 82-meter (m) (270-ft) interval of core recovered from a stratigraphic test well located along the subsurface trend of the Capitan Reef 27 kilometers (km) (17 miles) northeast of Carlsbad, concluded, “the most likely origin for the magnesite in the core is the downward movement of dense fluids from the Ochoan Series, Salado into the underlying, and [at the time] shallowly buried Tansil and Yates formations.” Clearly, magnesite either formed or persisted for long periods in the Delaware Basin.
During its review of the CCA, the EPA questioned the DOE’s conclusion that magnesite will be present throughout the entire 10,000-year regulatory period. For the CCA, the DOE based this conclusion on the fact that magnesite is the thermodynamically stable Mg carbonate under expected WIPP conditions (the CCA, Appendix BACK and Appendix SOTERM). The EPA accepted the DOE’s conclusion that magnesite is stable, but questioned whether the kinetics of the hydromagnesite (5424)-magnesite reaction are fast enough to produce enough magnesite in 10,000 years for the brucite-magnesite reaction to buffer fCO2 at 1.26 × 10⁻⁷ atm.
A literature review on the formation of dolomite and magnesite in the natural environment and laboratory studies of the formation of magnesite was completed (Sandia National Laboratories 1997, Section 5.2.1, pp. 32-37). Section MgO-4.2.3 describes other aspects of this study. The literature review report (Sandia National Laboratories 1997, Section 5.2.1, pp. 32-35) provides several examples of naturally occurring dolomite and magnesite that may have formed in the last several hundred to few thousand years. Nevertheless, this report states that “the most quantitative rates for precipitation kinetics of magnesite come from laboratory experiments.” Therefore, the data on magnesite formation from Sayles and Fyfe (1973) and Usdowski (1989 and 1994) obtained in laboratory experiments conducted at temperatures of 60, 126, and 180 °C was used to perform an Arrhenius extrapolation to 28 °C, the temperature expected in the WIPP after it is filled and sealed (Munson et al. 1987). Based on this extrapolation, it was concluded “Under WIPP conditions, magnesite should form in several hundred years” (Sandia National Laboratories 1997, Figure 5-4).
Based on this evidence, the EPA (U.S. Environmental Protection Agency 1998f) concluded:
The available rate data indicate that some portion, perhaps all, of the hydromagnesite will be converted to magnesite over the 10,000-year period for repository performance. The exact time required for complete conversion has not been established for all chemical conditions. However, the available laboratory and field data clearly indicate that magnesite formation takes from few hundred to, perhaps, a few thousand years. Thus, the early repository conditions can be best represented by the equilibrium between brucite and hydromagnesite. These conditions will eventually evolve to equilibrium between brucite and magnesite.
The EPA (U.S. Environmental Protection Agency 1998f) went on to describe the sequence of reactions that it expected to occur in WIPP disposal rooms:
[T]he sequence of events resulting from brine infiltration and reaction with the MgO backfill in the repository may be conceptualized by the following reactions, in order:
1. Rapid reaction (hours to days) between the brine and MgO to produce brucite.
2. Rapid carbonation (hours to days) of the brucite to produce nesquehonite and possibly hydromagnesite.
3. Rapid conversion (days to weeks) of the nesquehonite to hydromagnesite.
4. Slow conversion (hundreds to thousands of years) of the hydromagnesite to magnesite”
However, the EPA (U.S. Environmental Protection Agency 1998f) also stated in the same document:
These estimates of conversion rate are confounded by the fact that deposits of hydromagnesite are found in some evaporite basins dated as late Quaternary in age (<23.7 million years) (Stamatakis, 1995), indicating that the hydromagnesite has persisted in a metastable state for a long period with only partial conversion to magnesite and other magnesium carbonates.
Based at least in part on its interpretation of the implications of the huntite (CaMg3(CO3)4)-hydromagnesite deposits described by Stamatakis (1995) for the kinetics of the hydromagnesite-magnesite reaction, the EPA stipulated that the brucite-hydromagnesite (5424) reaction be used to buffer fCO2 for the An-solubility calculations in the CCA PAVT (Trovato 1997a; U.S. Environmental Protection Agency 1998f). This reaction would buffer fCO2 at a value of 3.14 × 10⁻⁶ atm, a value somewhat higher than the value of 1.26 × 10⁻⁷ atm maintained by the brucite-magnesite reaction that was used for the CCA PA. The DOE has used a value of 3.14 × 10⁻⁶ atm for fCO2 in WIPP PA since the CCA PAVT. Brush and Roselle (2006) reconsidered the implications of Stamatakis (1995) for the kinetics of the hydromagnesite-magnesite reaction; their conclusions are described later in this section.
Experiments carried out for the WIPP project in the late 1990s by Zhang et al. (1999) imply that magnesite will replace hydromagnesite (5424) rapidly enough to be the dominant Mg carbonate for most of the 10,000-year regulatory period. Zhang et al. (1999) studied the conversion of hydromagnesite (5424) to magnesite in a saturated NaCl solution and GWB at high temperatures and used the Arrhenius equation to extrapolate the results to 25 ºC (77 ºF), close to the expected WIPP temperature of 28 ºC (82.4 ºF) (Munson et al. 1987). Zhang et al. (1999) reacted 0.3 g of reagent-grade hydromagnesite (5424) with 1.5 g of saturated NaCl solution or GWB in autoclaves (type unspecified) at 110, 150, or 200 ºC (230, 302, or 392 ºF). They then quantified the extent of conversion attained in their experiments by comparing XRD patterns for their samples with XRD calibration curves obtained by running premixed samples of their reagent-grade hydromagnesite (5424) and reagent-grade magnesite.
Conversion from hydromagnesite (5424) to magnesite took place in days to weeks at 110 and 150 ºC (230 and 302 ºF) (Zhang et al. 1999). This was preceded by an induction period that persisted for nearly half of the time required for essentially complete conversion of hydromagnesite (5424) to magnesite, during which only a few percent of the hydromagnesite (5424) reacted to form magnesite. At 200 ºC (392 ºF), conversion took place in a few hours. (At room temperature, formation of magnesite has not been observed in experiments carried out for the WIPP project, even in experiments that lasted for a few years.) Conversion of hydromagnesite (5424) to magnesite appeared to be a first-order reaction. The induction period, during which about 4-5% of the hydromagnesite (5424) formed magnesite, may have resulted from slow nucleation of magnesite, after which magnesite formed rapidly.
Zhang et al. (1999) also observed that conversion was faster in saturated NaCl than in GWB. (All experiments carried out subsequently with Premier Chemicals MgO have also shown that the rates of hydration and carbonation of periclase and brucite occurred faster in simpler, less concentrated solutions than in complex solutions with higher ionic strengths; i.e., the rates of reaction decrease in the order DI H2O > 4 M NaCl > ERDA-6 brine > GWB.)
Based on their extrapolations to 25 ºC (77 ºF), Zhang et al. (1999) concluded that after an induction period of 18 or 200 years in saturated NaCl or GWB, respectively, the “half-life” of hydromagnesite (5424) (the time required for half of the hydromagnesite (5424) to convert to magnesite) would be 4.7 years (saturated NaCl) or 73 years (GWB). A period of about 1000 years, the approximate sum of the 200-year induction period and 730 years (10 half-lives), would result in conversion of over 99.9% of any hydromagnesite (5424) present to magnesite.
The applicability of the extrapolated results from Zhang et al. (1999) to the WIPP is probably more defensible than that of the extrapolated results in Sandia National Laboratories (1997) because Zhang et al. (1999) used high-ionic-strength brines—including one WIPP brine (GWB)—for their experiments, but SNL (Sandia National Laboratories 1997) used only low-ionic-strength (~0.05 M) results obtained from the literature.
Recently, Brush and Roselle (2006) reconsidered the implications of Stamatakis (1995) for the kinetics of the hydromagnesite (5424)-magnesite reaction and concluded the following:
1. It is unclear—based on the poorly constrained age(s) of the huntite-hydromagnesite (4323) deposits in the Kozani Basin, Greece—that the hydromagnesite (4323) there has persisted longer than expected based on the results of Zhang et al. (1999).
2. It is unclear that any conclusions regarding the kinetics of the hydromagnesite (5424)-magnesite reaction based on the hydromagnesite (4323) present in the Kozani Basin are applicable to the conversion of the hydromagnesite (5424) produced in WIPP-relevant laboratory experiments.
Stamatakis (1995) reported various ages or ranges of ages for the huntite-hydromagnesite deposits in the Kozani Basin. He referred to the sedimentary rocks that host these deposits as “late Neogene” and, on two occasions, “uppermost Neogene.” He referred to the alkaline, saline, spring-fed lakes, and ponds from which these evaporite deposits precipitated as “Tertiary to Recent” and “Neogene.” He did not provide any absolute (radiometric) ages for these deposits.
According to the current geologic time scale established by the International Commission on Stratigraphy, the Neogene Period has lasted from 23.03 million years ago to the present (Gradstein et al. 2005). Therefore, the ages Neogene, late Neogene, uppermost Neogene, and Tertiary to Recent do not place a lower limit on the possible range of ages of these deposits, especially in the absence of absolute (radiometric or astronomical) ages. Furthermore, the description of the deposits provided by Stamatakis (1995) is consistent with a postdepositional origin for at least some of the deposits. Therefore, it is not clear that the hydromagnesite there has persisted longer than expected based on the results of Zhang et al. (1999).
The hydromagnesite in the huntite-hydromagnesite deposits of the Kozani Basin is hydromagnesite (4323). Zhang et al. (1999) used hydromagnesite (5424) in their study on the conversion of hydromagnesite to magnesite. Therefore, any conclusions regarding the rate of the hydromagnesite-to-magnesite reaction based on the hydromagnesite (4323) present in the Kozani Basin do not apply to the conversion of the hydromagnesite (5424) used by Zhang et al. (1999) and observed in the laboratory experiments with Premier Chemicals MgO.
Laboratory studies on the carbonation of MgO were carried out to determine if (1) MgO would rapidly neutralize the mildly acidic brines that would form if microbial consumption of CPR materials in WIPP disposal rooms produces significant quantities of CO2; and (2) reaction rims would form on periclase and prevent this phase from effectively consuming all of the CO2 that could be produced by microbial consumption of CPR materials (Sandia National Laboratories 1997). A literature review on the formation of dolomite and magnesite in the natural environment, laboratory studies on the formation of magnesite to determine the timescale on which hydromagnesite (5424) would convert to magnesite, and the results of this activity are described above (Sandia National Laboratories 1997 and Section MgO-4.2.2). It was demonstrated that MgO would rapidly neutralize mildly acidic solutions; therefore, the remainder of this discussion focuses on whether reaction rims would form on periclase and prevent this phase from consuming CO2 (Sandia National Laboratories 1997, Section 3.2, p. 7 and Figure 3-1, p. 8).
Short-term “scoping” experiments were carried out by placing MgO pellets in beakers containing Salado or Castile brine and bubbling CO2 through them for “less than a week.” (See Sandia National Laboratories 1997, Section 3.2, p. 7.) The report states:
To provide as much latitude as possible in final materials selection, a material that had undergone calcination at the higher end of the [temperature] range was chosen for testing. Because reactivity typically decreases with increasing calcination temperature, selection of a material at the upper end of the range will provide a worst case.
XRD analysis indicated that nesquehonite and hydromagnesite (polymorph unspecified) rapidly formed on the surfaces of the pellets, and “After a few days of treatment, these layers coalesced to cement the pellets together.” SEM analysis “suggested the presence of other phases as well.” (See Sandia National Laboratories 1997, Section 3.2, p. 7)
Longer-term “final” experiments were also carried out (Sandia National Laboratories 1997, Section 3.3.1 and Section 3.3.2, pp. 7-13). The primary objective of these experiments was “to demonstrate that the formation of [Mg] carbonate surface coatings, if any, do not impact the efficacy of the MgO backfill enough to impede the backfill’s ability to function as conceptualized within the CCA PA.” A secondary objective was “to demonstrate that after coatings form the MgO remaining inside the pellet will still be reasonably accessible to the outside brine” (Sandia National Laboratories 1997, Section 3.3.1, p. 7). In the first set of these longer-term experiments, about 8 g of 1- to 2-mm-diameter MgO pellets were placed in beakers containing 250 mL of Salado or Castile brine and pure CO2 was bubbled through the beakers for up to 28 days, during which individual pellets were analyzed for their C content with a C coulometer. In a larger, follow-on set of experiments, 0.5- to 1-mm and 2- to 4-mm-diameter pellets were placed in beakers containing 100 mL of Salado or Castile brine. Manifolds were used to bubble pure CO2 through brines for up to 28 days, during which “the entire charge” was removed from the beakers and analyzed for its C content. In the follow-up experiments, triplicate experiments were run for every reaction time at which the C content was analyzed, and triplicate C analyses were carried out on the solids in every beaker.
In addition, “tea-bag” experiments were conducted, in which MgO pellets (size unspecified) were placed in porous bags about the size of a tea bag, the bottom third of the bags were immersed in Salado or Castile brine, and pure CO2 bubbled through the brines for periods of 3-85 days. During these experiments, brine wicking moistened all of the pellets in these bags (Sandia National Laboratories 1997, Section 3.3.2, p. 14).
“Carbonation curves” (plots of the conversion of their solids to Mg carbonates versus time) that were “S-shaped” were reported (Sandia National Laboratories 1997, Section 4, pp. 17-18). The data showed (1) “an initial incubation period of slow [CO2] uptake, which is probably preceded by a short period [during which] MgO actually dissolves to saturate the solution” and during which the surfaces of the pellets hydrate to form brucite; (2) “a period of accelerated [CO2] uptake during which the [CO2] content of the samples increases by several percent … in a few days”; and (3) “a long period [during which] the [CO2] uptake rate is much slower than earlier in the test, though the process does not seem to completely stop.” The incubation period was correlated to dissolution of the MgO pellets, formation of a thin layer of brucite on the pellets, and formation of “an incipient [Mg] carbonate phase … consisting of fine platy crystals,” possibly “protohydromagnesite.” (See Sandia National Laboratories 1997, Section 4.2, pp. 20-29.) The period of rapid CO2 uptake was correlated with the formation of nesquehonite needles, both on the surfaces of the pellets exposed to the brines and in the pores among the pellets. Finally, the final period of slower CO2 uptake was correlated with reduced access of the brines to the pores caused by intergrowth of the nesquehonite needles and concomitant cementation of the pellets. However, cementation did not stop the carbonation of the pellets, even in the pores. Furthermore, “exfoliation” of nesquehonite and formation of protohydromagnesite or magnesite platy crystals was observed, possibly at the expense of nesquehonite (see Section MgO-4.2.1). Both of these processes would promote continued, albeit reduced, access of brine to the pores.
It was pointed out that, although “isolating reaction rims at high extents of conversion (15-30 mol %) were not observed,” the lower values of fCO2 expected in WIPP disposal rooms would result in a lower concentration gradient of dissolved CO2-bearing species from the brine to the surfaces of the MgO pellets, which would in turn localize the precipitation of Mg carbonates in the brines instead of on the surfaces of the pellets (see Sandia National Laboratories 1997, Section 5.1, pp. 30-32, and especially Figure 5-1). The experiments bubbled pure CO2 through their brines (Sandia National Laboratories 1997, Section 3.3.2, pp. 8-14). This, in turn, established values of fCO2 in the brines that were orders of magnitude greater than those expected in the repository, currently from 3.14 × 10⁻⁶ atm (both GWB and ERDA-6) down to 1.20 × 10⁻⁷ atm (GWB) or 1.23 × 10⁻⁷ atm (ERDA-6), the values characteristic of the brucite-hydromagnesite (5425) and the brucite-magnesite carbonation reactions (see Section MgO-5.1).
In addition to the laboratory experiments described above, MgO was added to one of the liter-scale experiments (L-28) in the WIPP Source Term Test Program (STTP) with actual TRU waste (Villarreal, Bergquist, and Leonard 2001a and 2001b; Villarreal, King, and Leonard 2001; Villarreal et al. 2001). (The STTP comprised 39 L-scale and 15 drum-scale experiments.) Because the dissolved plutonium (Pu) concentration in L-28 increased after the addition of MgO, the New Mexico Environmental Evaluation Group cited this experiment as an example of the inefficacy of MgO, possibly because of passivation (Oversby 2000). The experiment in L-28 was carried out at a CO2 pressure of 60 bars, 7 orders of magnitude higher than that expected in the WIPP (from 3.14 × 10⁻⁶ atm down to 1.20 × 10⁻⁷ atm; see Section MgO-5.1). The partial pressure of CO2 in the WIPP will not exceed 3.14 × 10⁻⁶ atm because the rate of CO2 consumption by the periclase and brucite in MgO is much higher than the microbial CO2 production rate. Therefore, the conditions in L-28 were not representative of those expected in the WIPP, and the results are irrelevant to the WIPP (Brush, Moore, and Wall 2001).
Bryan and Snider (2001b, p. 5-9) and Snider (2002, pp. 3.1 through 3.15) conducted a series of “cemented-cake” experiments to determine whether lithification of MgO will occur in the WIPP and, if so, whether it would affect the rate of MgO hydration. For the experiments, 15, 30, or 45 g of Premier Chemicals MgO were placed in 125-mL plastic containers with ERDA-6 brine or GWB. This resulted in a 5-, 10-, or 15-mm thick layer of Premier Chemicals MgO at the bottom of the containers. The containers were then placed in ovens at 25, 50, 70, or 90 ºC (77, 122, 158, or 194 ºF) for periods of up to about 6 months. They were not agitated. (Agitation apparently prevented any lithification of MgO in their other inundated experiments.) Snider (2002, Figure 12, Figure 13, and Figure 14) reported results from cemented-cake experiments that lasted for periods of about four to six months. She observed lithification of some samples; however, others remained “very friable,” even after inundation at 70 and 90 ºC (Snider 2002, p. 3.1 through 3.15). Snider (2002, p. 3.13) had “anticipated that the thicker layers would hydrate at a slower rate,” especially if lithification occurred. However, “MgO thickness has not affected the hydration rate under inundated conditions in ERDA-6 brine (Figure-12)” (Snider 2002, p. 3.1 through 3.13); and “in GWB at 50, 70, and 90 ºC (Snider 2002, Figure 13) thickness does not affect hydration” (Snider 2002, p. 3.1 through 3.15). Furthermore, the 5-mm-thick samples in GWB at 25 ºC (77 ºF) hydrated at the slowest rate, the 15-mm-thick samples hydrated at an intermediate rate, and the 10-mm-thick samples hydrated at the fastest rate (Snider 2002, Figure 13). Therefore, these experiments showed that lithification might occur, but, if it does, it will not decrease the MgO hydration rate.
The results obtained all imply that the periclase in MgO and the brucite that forms from the hydration of this periclase will be available to react, and will continue to react, until all CO2 in the repository has been consumed (Sandia National Laboratories (1997), Bryan and Snider (2001b), and Snider (2002)). Nevertheless, Brush and Roselle (2006, Section 5.1 and Section 5.2) carried out a literature search for anthropogenic or natural analogs or experimental studies that provide insight into whether hydration of periclase to form brucite, and carbonation of brucite to form hydromagnesite and magnesite, will proceed to completion if H2O or CO2, respectively, are present in the repository. The literature they found included studies of several different types of chemical and geochemical systems:
1. Hydration of periclase in Portland cement
2. Hydration of periclase in magnesia sinters
3. Hydration of periclase formed in contact-metamorphosed dolomite and Mg-bearing limestone
4. Laboratory studies of periclase hydration in metamorphic rocks formed at high pressures and temperatures (these conditions are far from those expected in the WIPP, but provide valuable insight because of the challenges involved in preventing periclase hydration during and after “quenching” these experiments to ambient laboratory conditions)
5. Field studies of brucite carbonation during serpentinization of ultramafic rocks and the weathering of the resulting serpentinites
6. The use of brucite to scrub CO2 from the smokestacks of power plants, or for deep-geologic sequestration of CO2
7. The weathering of an approximately 4,000-year-old statue carved from a rock known as predazzite, a brucite- or periclase-bearing limestone marble
The results of these anthropogenic- and natural-analog studies all imply that the periclase in the MgO engineered barrier and the brucite that forms from the hydration of this periclase will be available to react—and will continue to react—until all the CO2 in the repository has been consumed.
This section reviews the effects of MgO on (1) brine composition, fCO2, pH, and An solubilities, including changes since the CRA-2004 (Section MgO-5.1); (2) colloidal An concentrations (Section MgO-5.2); (3) other near-field processes and conditions, including repository H2O content, gas generation, and room closure (Section MgO-5.3); and (4) far-field An transport (Section MgO-5.4).
The DOE is emplacing MgO in the WIPP to decrease the solubilities of the An elements in TRU waste by consuming all the CO2 that would be produced by microbial activity should all the CPR materials in the repository be consumed. Consumption of CO2 will decrease An solubilities by (1) buffering fCO2 at a low value or within a low range of values, (2) maintaining a mildly basic pH, and (3) preventing the production of significant carbonate ion (CO32-)quantities.
The effects of MgO carbonation have been included in WIPP PA by removing CO2 from the gaseous phase in BRAGFLO calculations, and using the values of fCO2 and pH predicted for reactions among MgO, brine, and aqueous or gaseous CO2 to calculate An solubilities.
Table MgO-6 provides the initial compositions of GWB and ERDA-6 brine and their compositions predicted by FMT for the An-solubility calculations for the CRA-2004 PABC (Brush and Xiong 2005a; 2005b; Brush 2005) after equilibration with (1) the MgO hydration and carbonation products brucite (Mg(OH)2) and hydromagnesite (5424), respectively; (2) halite (NaCl) and anhydrite (CaSO4), two of the most abundant minerals in the Salado; and (3) the An-bearing solids Am(OH)3; hydrous, amorphous ThO2; and KNpO2CO3. In addition to these solids, which are specified in the input files, FMT predicted that (1) the solids Mg2(OH)3Cl×4H2O and whewellite (Ca oxalate hydrate, or CaC2O4×H2O) would precipitate from GWB; and (2) glauberite (Na2Ca(SO4)2) and whewellite would precipitate from ERDA-6 brine if these brines equilibrate with brucite, hydromagnesite (5424), halite, and anhydrite. Note that, although FMT predicted that Mg2(OH)3Cl×4H2O would precipitate from GWB, Mg3(OH)5Cl×4H2O has been observed in experiments with GWB (see Section MgO-4.1.1 and Figure MgO-3). Note also that because these calculations were performed for the CRA-2004 PABC, oxalate (and other organic ligands) were added to these brines, which resulted in the prediction that whewellite would precipitate.
FMT predicts equilibration of these brines with the solids listed above will (1) establish a total inorganic C (TIC) concentration of 0.350 millimolar (mM) in GWB, and decrease the TIC concentration from 16 to 0.428 mM in ERDA-6 brine; (2) buffer fCO2 at 3.14 × 10⁻⁶ atm in both brines; and (3) establish a pH of 8.69 in GWB and increase the pH from 6.17 to 8.94 in ERDA-6 brine.
Equilibration of GWB and ERDA-6 brine with these solids will also change the concentrations of the major and other minor elements in these brines. In particular, the concentration of Mg in GWB will decrease from 1.02 to 0.578 M, but will increase from 0.019 to 0.157 M in ERDA-6 brine (Table MgO-6).
Table MgO-6. Compositions of GWB and ERDA-6 Brine Predicted by FMT for the An-Solubility Calculations for the CRA-2004 PABC (Brush and Xiong 2005a; 2005b; Brush 2005) (M, Unless Otherwise Noted) before and after Equilibration with Brucite, Hydromagnesite, Halite, Anhydrite, and Other Solids
|
Element or Property |
GWB before Reaction with Solidsa |
GWB after Reaction with Solidsb |
ERDA-6 Brine before Reaction with Solidsc |
ERDA-6 Brine after Reaction with Solidsd |
|
B(III)(aq) |
0.158 |
0.166 |
0.063 |
0.0624 |
|
Na(I)(aq) |
3.53 |
4.35 |
4.87 |
5.24 |
|
Mg(II)(aq) |
1.02 |
0.578 |
0.019 |
0.157 |
|
K(I)(aq) |
0.467 |
0.490 |
0.097 |
0.0961 |
|
Ca(II)(aq) |
0.014 |
0.00895 |
0.012 |
0.0107 |
|
S(VI)(aq) |
0.177 |
0.228 |
0.170 |
0.179 |
|
Cl(-I)(aq) |
5.86 |
5.38 |
4.8 |
5.24 |
|
Br(-I)(aq) |
0.0266 |
0.0278 |
0.011 |
0.0109 |
|
TIC |
― |
0.350 mM |
16 mM |
0.428 mM |
|
Ionic strength |
― |
7.66 m |
― |
6.80 m |
|
fCO2 (atm) |
― |
3.14 × 10⁻⁶ |
― |
3.14 × 10⁻⁶ |
|
pH |
― |
8.69 |
6.17 |
8.94 |
|
RH |
― |
0.732 |
― |
0.748 |
|
Specific gravity |
1.2 |
1.23 |
1.216 |
1.22 |
|
a From Krumhansl et al. (1991) and Snider (2003c). b FMT Run 7 (Brush and Xiong 2005a; 2005b; Brush 2005). c From Popielak et al. (1983). d FMT Run 11 (Brush and Xiong 2005a; 2005b; Brush 2005). |
||||
Table MgO-7 and Table MgO-8 show the effects of the
Mg-carbonate solid produced by the carbonation of brucite on the
TIC concentration, fCO2, pH, and the solubilities of
An elements in the III, IV, and V oxidation states (An(III),
An(IV), and An(V)) in GWB and ERDA-6 brine, respectively.
Brush and Xiong (2003a; 2003b; 2003c; 2003d) carried out this sensitivity study as part of the An
speciation and solubility calculations for the CRA-2004 PA.
These calculations were superseded by those conducted for the
CRA-2004 PABC (Brush and Xiong 2005a; 2005b; Brush 2005), which are now part of the WIPP PA
baseline. However, Brush and Xiong (2005a, 2005b) and Brush
(2005) did not redo this sensitivity study for the CRA-2004
PABC. Therefore, Table MgO-7 and Table MgO-8 provide the
results from the CRA-2004 PA, along with the results of the
CRA-2004 PABC Runs 7 and 11, respectively (fourth column of Table
MgO-7 and Table MgO-8). Runs 7 and 11 were also used for
the CRA-2009 PA. Comparison of the CRA-2004 PA results in
the third column of Table MgO-7 and Table MgO-8 with the
CRA-2004
Table MgO-7. Effect of the Mg-Carbonate Solid on the fCO2 (atm), TIC Concentration (M), pH (Standard Units), and An Solubilities (M) in GWB after Equilibration with Brucite, Halite, Anhydrite, and Other Solids
|
Element or Property |
Magnesitea |
Hydro-magnesite5424b |
Hydro-magnesite5424c |
Hydro-magnesite4323d |
Nesquehonitee |
|
fCO2 |
1.20 × 10⁻⁷ |
3.14 × 10⁻⁶ |
3.14 × 10⁻⁶ |
4.08 × 10⁻⁶ |
1.42 × 10⁻⁴ |
|
TIC |
1.36 × 10⁻⁵ |
3.50 × 10⁻⁴ |
3.50 × 10⁻⁴ |
4.56 × 10⁻⁴ |
1.59 × 10⁻² |
|
pH |
8.69 |
8.69 |
8.69 |
8.69 |
8.69 |
|
An(III) |
3.06 × 10⁻⁷ |
3.07 × 10⁻⁷ |
3.87 × 10⁻⁷ |
3.07 × 10⁻⁷ |
2.12 × 10⁻⁶ |
|
An(IV) |
1.17 × 10⁻⁹ |
1.19 × 10⁻⁸ |
5.64 × 10⁻⁸ |
1.52 × 10⁻⁸ |
5.68 × 10⁻⁷ |
|
An(V) |
2.37 × 10⁻⁵ |
1.02 × 10⁻⁶ |
3.55 × 10⁻⁷ |
8.06 × 10⁻⁷ |
2.28 × 10⁻⁷ |
|
a CRA-2004 PA Run 14 (Brush and Xiong 2003a; 2003b; 2003c; 2003d). b CRA-2004 PA Run 18 (Brush and Xiong 2003a; 2003b; 2003c; 2003d). c CRA-2004 PABC Run 7 (Brush and Xiong 2005a; 2005b; Brush 2005). d CRA-2004 PA Run 16 (Brush and Xiong 2003a; 2003b; 2003c; 2003d). e CRA-2004 PA Run 20 (Brush and Xiong 2003a; 2003b; 2003c; 2003d). |
|||||
Table MgO-8. Effect of the Mg-Carbonate Solid on the fCO2 (atm), TIC Concentration (M), pH (Standard Units), and An Solubilities (M) in ERDA-6 Brine after Equilibration with Brucite, Halite, Anhydrite, and Other Solids
|
Element or Property |
Magnesitea |
Hydro-magnesite5424b |
Hydro-magnesite5424c |
Hydro-magnesite4323d |
Nesquehonitee |
|
fCO2 |
1.23 × 10⁻⁷ |
3.14 × 10⁻⁶ |
3.14 × 10⁻⁶ |
4.08 × 10⁻⁶ |
1.36 × 10⁻⁴ |
|
TIC |
1.87 × 10⁻⁵ |
4.68 × 10⁻⁴ |
4.28 × 10⁻⁴ |
6.08 × 10⁻⁴ |
2.00 × 10⁻² |
|
pH |
9.02 |
9.02 |
8.94 |
9.02 |
9.00 |
|
An(III) |
1.68 × 10⁻⁷ |
1.69 × 10⁻⁷ |
2.88 × 10⁻⁷ |
1.70 × 10⁻⁷ |
5.45 × 10⁻⁷ |
|
An(IV) |
1.72 × 10⁻⁹ |
2.47 × 10⁻⁸ |
6.79 × 10⁻⁸ |
3.19 × 10⁻⁸ |
1.01 × 10⁻⁶ |
|
An(V) |
1.19 × 10⁻⁴ |
5.08 × 10⁻⁶ |
8.24 × 10⁻⁷ |
4.00 × 10⁻⁶ |
1.10 × 10⁻⁶ |
|
a CRA-2004 PA Run 24 (Brush and Xiong 2003a; 2003b; 2003c; 2003d). b CRA-2004 PA Run 28 (Brush and Xiong 2003a; 2003b; 2003c; 2003d). c CRA-2004 PABC Run 11 (Brush and Xiong 2005a; 2005b; Brush 2005). d CRA-2004 PA Run 26 (Brush and Xiong 2003a; 2003b; 2003c; 2003d). e CRA-2004 PA Run 30 (Brush and Xiong 2003a; 2003b; 2003c; 2003d). |
|||||
PABC results in the fourth column shows that the TIC concentration, log fCO2, and pH predicted for GWB by the CRA-2004 PA and PABC calculations are identical to three significant figures. The TIC content, log fCO2, and pH predicted for ERDA-6 by the CRA-2004 PA and PABC calculations are not identical, but are similar. The An(III), An(IV), and An(V) solubilities predicted for the CRA-2004 PA and PABC calculations are different for both brines because of changes in the thermodynamic databases for the An(III), An(IV), and An(V) models between these calculations. Although the CRA-2004 PA results were not part of the WIPP PA baseline, the results of this sensitivity study still provide a reasonably accurate assessment of the effects of the Mg carbonate formed in the WIPP.
Table MgO-7 and Table MgO-8 show that both the TIC content and the fCO2 predicted for each Mg-carbonate solid increase by about three orders of magnitude from magnesite to hydromagnesite (5424), to hydromagnesite (4323), to nesquehonite. This is because magnesite is the thermodynamically stable Mg carbonate under expected WIPP conditions; hydromagnesite (5424) is metastable with respect to magnesite, hydromagnesite (4323) is metastable with respect to hydromagnesite (5424), and nesquehonite is metastable with respect to hydromagnesite (4323). The brucite carbonation Reactions (MgO.8), (MgO.7), as well as
4Mg(OH)2(s) + 3CO2(aq or g)
![]() Mg4(CO
3)3(OH)2×3H2O(s),
and (MgO.10)
Mg4(CO
3)3(OH)2×3H2O(s),
and (MgO.10)
Mg(OH)2(s) + 2H2O(aq or g) + CO2
(aq or g) ![]() MgCO3×3H2O(s), (MgO.11)
MgCO3×3H2O(s), (MgO.11)
would buffer fCO2 at values of 1.20 × 10⁻⁷ atm (Reaction [MgO.8]) to 1.42 × 10⁻⁴ atm (Reaction [MgO.11]) in GWB (Table MgO-7), or 1.23 × 10⁻⁷ atm (Reaction [MgO.8]) to 1.36 × 10⁻⁴ atm (Reaction [MgO.11]) in ERDA-6 brine (Table MgO-8), depending on which of these reactions is dominant. The TIC concentrations corresponding to these fugacities would be 1.36 × 10⁻⁵ M (Reaction [MgO.8]) to 1.59 × 10⁻² M (Reaction [MgO.11]) in GWB (Table MgO-8), or 1.87 × 10⁻⁵ M (Reaction [MgO.8]) to 2.00 × 10⁻² M (Reaction [MgO.11]) in ERDA-6 brine (Table MgO-8).
Although nesquehonite was observed in some of the DOE’s carbonation experiments with Premier Chemicals MgO (Section MgO-4.2.1), hydromagnesite (5424) was clearly replacing nesquehonite as these experiments proceeded (Section MgO-4.2.1). Therefore, carbonation of brucite to form hydromagnesite (5424) (Reaction [MgO.7]) will be the dominant carbonation reaction for at least part of the 10,000-year regulatory period (the first few hundred to few thousand years). The DOE has not observed the formation of hydromagnesite (4323), and has not observed magnesite, except in some accelerated experiments (e.g., Zhang et al. 1999; Zhang, Hardesty, and Papenguth 2001). However, these accelerated experiments (and other considerations) imply that carbonation of brucite to form magnesite (Reaction [MgO.8]) will be the dominant carbonation reaction for much, if not most, of the 10,000-year regulatory period (Section MgO-4.2.3). Therefore, fCO2 would be 3.14 × 10⁻⁶ atm in the WIPP initially while hydromagnesite (5424) is the dominant Mg carbonate, but would decrease to (1.20-1.23) × 10-7 atm as magnesite replaces hydromagnesite (5424) and becomes dominant. Similarly, the TIC concentration would be about (3.50-4.28) × 10-4 M initially, but would decrease to about (1.36-1.87) × 10-5 M.
Appendix SOTERM-2009, Section SOTERM-2.3.2 describes how MgO will control the pH of brines in WIPP disposal rooms.
This section describes the two changes in the predicted effects of MgO on chemical conditions in the WIPP since the CRA-2004: MgO-5.1.1.1 describes the elimination of chemical conditions predicted for nonmicrobial PA vectors, and MgO-5.1.1.2 discusses the substitution of GWB for Brine A.
The reduction of the MgO excess factor that was approved by the EPA since the CRA-2004 will not affect chemical conditions in the WIPP. Therefore, it is described in Section MgO-6.2.4.
There are large uncertainties as to whether significant microbial consumption of the CPR materials emplaced in the WIPP will occur during the 10,000-year WIPP regulatory period. Therefore, Brush (1995) assumed that “significant microbial consumption of CPR materials is possible, but by no means certain.” To incorporate these uncertainties in the CCA PA and PAVT, Wang and Brush (1996a and 1996b) developed a conceptual model for microbial activity in the repository. According to this model, there is a probability of 0.50 for significant microbial activity. In the event of significant microbial activity, microbes could consume 100% of the cellulosic materials in the repository. Furthermore, there is a conditional probability of 0.50 that microbes could consume all of the plastic and rubber materials after consumption of all of the cellulosic materials. Thus, in the CCA PA and PAVT, there was no microbial activity in about 50% of the PA realizations (vectors); microbes could consume all of the cellulosic materials, but no plastic or rubber materials, in about 25% of the vectors; and microbes could consume all of the CPR materials in the remaining ~25% of the vectors. (Note that even if significant microbial activity could occur in a vector, microbes did not necessarily consume 100% of the cellulosic materials or 100% of the CPR materials because the quantities of these materials that the PA code BRAGFLO predicted would be consumed depended on several sampled parameters.) This conceptual model for microbial activity was also used in the CRA-2004 PA.
For the CCA PA and PAVT, it was assumed that the chemical conditions in WIPP disposal rooms would be identical whether or not significant microbial activity and gas generation occur. (See Brush and Xiong 2003c, Section 5 for a detailed review of how near-field chemical conditions were predicted for the CCA PA and PAVT.) For the CRA-2004 PA, however, Brush and Xiong (2003c, Section 5.3.2) concluded that, for the vectors without microbial activity, the reaction that would buffer fCO2 is
Mg(OH)2(s) + Ca2+(aq) + CO2(aq
or g) ![]() CaCO
3(s) + Mg2+(aq) + H2O(aq or
g)
(MgO.12)
CaCO
3(s) + Mg2+(aq) + H2O(aq or
g)
(MgO.12)
not the brucite-hydromagnesite (5424) carbonation reaction (Reaction [MgO.7]) (Section MgO-4.2.1 and Section MgO-5.1).
Brush and Xiong (2003a) used FMT to establish chemical conditions for the nonmicrobial vectors in the CRA-2004 PA that were slightly different than those calculated for the microbial vectors. They calculated that the fCO2 would be 3.31 × 10⁻⁶ and 7.08 × 10⁻⁷ atm in GWB and ERDA-6 brine, respectively, for the nonmicrobial vectors; and 3.14 × 10⁻⁶ atm in both brines for the microbial vectors. They also predicted that the pH would be 8.69 and 8.99 in GWB and ERDA-6 brine, respectively, for the nonmicrobial vectors and 8.69 and 9.02 for the microbial vectors. Despite these differences, Brush and Xiong (2003a, Table 7) calculated An solubilities that were nearly identical for the nonmicrobial and microbial vectors in most cases. The only exceptions were the solubilities of An(IV) in ERDA-6 brine (5.84 ´ 10-9 M for the nonmicrobial and 2.47 ´ 10-8 M for the microbial vectors) and An(V) in ERDA-6 brine (2.13 ´ 10-5 M in the nonmicrobial and 5.08 ´ 10-6 M in the microbial vectors).
During its completeness review of the CRA-2004 PA, however, the EPA (Cotsworth 2005, Enclosure 1, p. 1) stated
In the CRA performance assessment [the CRA-2004 PA], DOE assumes that the probability that microbial degradation will occur and thus produce significant gas is 50 percent [sic]. However, based on our review to date, including DOE’s response to EPA comments …, EPA believes that there are reasonable alternative interpretations to DOE’s responses. It is EPA’s position that microbes will survive over the regulatory period and be able to produce some gas, albeit with the possibility that sometimes the resulting gas generation rate may be low or near zero. The revised performance assessment [the CRA-2004 PABC] must implement a change so that the modeled probability of microbial degradation is 1. DOE may propose different ranges of gas production or microbe effectiveness as long as it is supported by data…
To incorporate this change in the CRA-2004 PABC, there is now a probability of 1 that significant microbial activity could occur and that microbes could consume 100% of the cellulosic materials in the repository. Furthermore, there is a probability of 0.25 that microbes could consume all of the CPR materials. Therefore, microbes could consume all of the cellulosic materials, but no plastic or rubber materials, in about 75% of the vectors; and microbes could consume all of the CPR materials in the remaining ~25% of the vectors. The microbial gas generation model for the CRA-2004 PABC is the one used for CRA-2009.
The separate chemical conditions established for the nonmicrobial vectors were used only once in WIPP PA, for the CRA-2004 PA (the CRA-2004, Appendix BARRIERS, Section BARRIERS-2.3.2.4; the CRA-2004, Appendix PA, Attachment SOTERM, Section SOTERM-2.2.2 and Section SOTERM-3.5).
Brush and Xiong (2003c, Section 5.3.1) proposed to the EPA that GWB (Krumhansl et al. 1991; Snider 2003c) be substituted for Brine A (Molecke 1983) in future An speciation and solubility calculations for WIPP PA because “this brine resembles the average composition of intergranular Salado brines at or near the stratigraphic horizon of the WIPP more closely than Brine A.” The synthetic solution Brine A was used extensively for laboratory and modeling studies of WIPP chemistry (e.g., Brush 1990; Brush 1996; Brush and Storz 1996) prior to the establishment of GWB as a more representative Salado brine (Krumhansl, Kimball, and Stein 1991; Snider 2003c).
For the CRA-2004, Brush and Xiong (2003a) calculated chemical conditions and An solubilities in both Brine A and GWB, as well as in ERDA-6 brine (used to represent fluids from Castile brine reservoirs). The conditions and solubilities predicted for Brine A and GWB were very similar, as were those predicted for Brine A or GWB and ERDA-6 brine. The solubilities calculated in GWB were used for the CRA-2004 PA (the CRA-2004, Appendix PA, Attachment SOTERM, Section SOTERM-3.5).
The EPA approved the use of GWB for An-solubility calculations for WIPP PA (U.S. Environmental Protection Agency 2006). Therefore, the conditions predicted for GWB in WIPP disposal rooms are now considered the baseline conditions for Salado brine. The solubilities calculated in GWB were used for the CRA-2004 PABC (Leigh et al. 2005) and the CRA-2009 PA.
This section is based on the text in the CRA-2004, Appendix BARRIERS, Section BARRIERS-2.3.3.
Colloids could affect the long-term performance of the WIPP because of their potential ability to bind cationic metals such as the An elements in TRU waste, and because of their potential mobility under expected repository conditions (Choppin 1988). Colloids are typically defined as phases intermediate in size between dissolved ionic or molecular species and suspended particles large enough to settle by gravity. The size range of colloids is typically on the order of 1 nanometer to 1 μm.
Humic substances, microbes, and mineral fragments could bind An elements in the WIPP. Under some conditions, An elements could also form intrinsic colloids without binding to humics, microbes, or minerals. Even if one or more of these four types of colloids form(s) in the WIPP, they would not transport An elements out of the repository unless they remain suspended in brine. If coagulation occurs, any An elements bound to these colloids would be immobilized, at least with respect to direct brine releases or injection of brine into the Culebra Dolomite Member of the Rustler Formation (hereafter referred to as Culebra).
Chemical conditions in the repository will affect the colloidal An source term. The small variations in pH within the narrow range imposed by MgO will not affect the concentrations of An-bearing colloids significantly. Studies carried out to quantify the colloidal source term included experiments under the conditions that will be established by MgO (the CRA-2004, Appendix PA, Attachment SOTERM, Section SOTERM-6.0 and Appendix SOTERM-2009).
The results of Wall and Matthews (2005) imply that colloids formed by the association of actinides and humic substances are highly unstable in the presence of MgO, and that these colloids dissociate rapidly (i.e., within hours).
Section MgO-5.3.1, Section MgO-5.3.2, and Section MgO-5.3.3 are based on the text in the CRA-2004, Appendix BARRIERS, Section BARRIERS-2.3.4.1, Section BARRIERS-2.3.4.2, and Section BARRIERS-2.3.4.3.
The hydration of periclase could consume significant quantities of H2O in the WIPP (Reaction [MgO.6]). The carbonation of brucite to form hydromagnesite (5424) (Reaction [MgO.7]) or, less likely, hydromagnesite (4323), will not release this H2O unless hydromagnesite (5424) or (4323) goes on to form magnesite. Furthermore, even if large quantities of magnesite form during the 10,000-year regulatory period (Reaction [MgO.8]), there will still be large quantities of periclase available for hydration because the DOE is emplacing more MgO than necessary to consume all the CO2 that would be produced by microbial activity should all the CPR materials in TRU waste and waste containers be consumed.
MgO hydration is not included in PA at this time.
The two gas-producing processes included in WIPP PA are anoxic corrosion of steels and other Fe-base alloys, which will produce H2, and microbial consumption of CPR materials, which will produce mainly CO2, hydrogen sulfide (H2S), and methane (CH4).
Telander and Westerman (1993 and 1997) studied anoxic corrosion of various metals and concomitant H2 production under expected WIPP conditions. Wang and Brush (1996a and 1996c) used results from three types of experiments carried out by Telander and Westerman (1993 and 1997) to establish ranges and probability distributions of H2 production rates for the CCA PA:
1. Experiments with low-C steels in or above Brine A under atmospheres consisting of initially pure CO2, nitrogen (N2), or hydrogen sulfide (H2S) in inert (noncorroding), metallic containers at low-to-intermediate pressures (about 1 to 20 atm).
2. Experiments with low-C steels in Brine A under H2, CO2, or N2 in autoclaves at high pressures (35 to 127 atm).
3. Runs with low-C steels in ERDA-6 brine at pH values of 2.8 to 10.6 under N2. All these experiments were conducted at 30 ± 5 ºC (86 ± 9 ºF). Brine A and ERDA-6 brine are described above (Section MgO-4.1.1)
Anoxic corrosion of low-C steels in Brine A under initially pure N2 resulted in a pH of 8.3, 8.3, and 8.4 after 6, 12, and 24 months, respectively (see Telander and Westerman 1993, Table 6-3, Test Containers 10, 17, and 25). Wang and Brush (1996a; 1996c) used the 12-to-24-month data from these experiments to establish a range and probability distribution of inundated, anoxic-corrosion rates of steels and other Fe-base alloys of 0 to 0.5 mm/year for the CCA PA. This is equivalent to a range of (0–1.59) ´ 10-14 meters per second (m/s). Data on the effects of pH on corrosion rates (Telander and Westerman 1997, Table 6-5) have demonstrated that rates obtained at a pH of 8.3 or 8.4 are somewhat higher than those at a pH of 8.69, 8.99, or 9.02, the values expected for the brucite dissolution reaction (see Reaction [MgO.3], above). Therefore, the anoxic-corrosion rates established by Wang and Brush (1996a and 1996c) for the CCA incorporated the effects of MgO on pH.
For the CCA PAVT, the EPA specified that the upper limit of the inundated anoxic-corrosion rate range be increased from 1.59 ´ 10-14 m/s to 3.17 ´ 10-14 m/s (Trovato 1997b, Enclosure 2; U.S. Environmental Protection Agency 1998e, Table ES-4, Section 5.15, and Table 6.3 and Table 6.4; Hansen and Leigh 2003). A range of (0-3.17) ´ 10-14 m/s was also used for the CRA-2004 PA (CRA-2004, Appendix PA, Section PA-5.2) and the CRA-2004 PABC (Leigh et al. 2005).
Francis and Gillow (1994 and 2000), Francis, Gillow, and Giles (1997), and Gillow and Francis (2001a, 2001b, 2002a, 2002b, and 2003) did not include MgO or the effects of pH in their study of microbial gas generation under expected WIPP conditions. Instead, they included bentonite in about half of their experiments because a backfill consisting of 70 wt % crushed salt and 30 wt % bentonite had been proposed as an alternative to a backfill consisting entirely of crushed salt, the design-basis backfill in January 1992 when these microbial gas-generation experiments were started. No microbial experiments have been carried out with MgO since the use of this material to consume CO2 and control fCO2 and pH in the WIPP was proposed in 1996.
Dissolution of brucite (Section MgO-5.1, Reaction [MgO.11]) will prevent the pH of any brine present from decreasing below a value of about 9. This mildly basic value is somewhat higher than the mildly acidic pH values produced by dissolution of microbial CO2 in the experiments described by Francis and Gillow (1994 and 2000), Francis et al. (1997), and Gillow and Francis (2001a, 2001b, 2002a, 2002b, and 2003). However, emplacement of MgO in the WIPP and a consequent, mildly basic pH of 9 will not in and of itself preclude significant microbial activity in the repository. This conclusion is based on the common observation of viable alkalohalophilic microbes in alkaline lakes with pH values of 9 to 10. Such alkaline lakes occur frequently in arid and semiarid environments, such as southeastern New Mexico and adjacent areas of west Texas, and could be one source of the halophilic microbes observed in the WIPP. However, several investigators have reported that MgO and compounds derived from MgO possess inhibitory or even biocidal properties (Asghari and Farrah 1993; Chapman et al. 1995; Koper et al. 2002; Sawai 2003; Sawai et al. 1995a, 1995b, 1996, 2000a, and 2000b; Stoimenov et al. 2002; Yamamoto et al. 1998). Some of the results of these studies may be applicable to the WIPP.
First, the inhibitory or biocidal effects of MgO probably result from the presence of brucite, not periclase (Sawai et al. 1995a), because most of the experiments cited above were conducted in aqueous solutions or in growth media that contained H2O, and most of these experiments were long enough for significant nucleation and growth of brucite on periclase surfaces exposed to these solutions or media.
Second, the inhibitory or biocidal effects of MgO do not seem to be caused by the mildly basic pH that results from the presence of brucite in aqueous solutions or growth media. Sawai et al. (2000b) reported that the survival of Escherichia coli (E. coli) was unaffected by a MgO-free, alkaline growth medium at pH values of 10, 10.25, and 10.5, but that E. coli survival decreased significantly in the same medium at pH values of 10.75 and 11. This result agrees with the conclusion that a mildly basic pH of about 9 (Section MgO-5.1) will not by itself preclude microbial activity in the WIPP.
Third, inhibition of microbial activity seems to require contact between MgO particles and microbes (Sawai et al. 2000a). This conclusion is based on the observation that increased shaking speed of an MgO-bearing slurry increased the mortality of E. coli in the slurry.
Fourth, the inhibitory effect is inversely proportional to the size of the MgO particles (Sawai et al. 1996; Koper et al. 2002; Stoimenov et al. 2002) and the temperature at which the MgO was prepared (Sawai et al. 1996).
Application of these results to microbial activity in the WIPP is difficult in the absence of long-term experiments under expected repository conditions. Biocides are often used for sterilization of solid materials, but become ineffective as the volume of the material(s) to be sterilized increases. This is because it becomes progressively more difficult to ensure uniform distribution of the biocide throughout these materials, and hence to ensure contact between the biocide and the microbes, as the volume increases. Therefore, sterilization methods such as autoclaving and radiation are used for materials with large volumes. In the case of MgO, Sawai et al. (2000a) reported that inhibition of microbial activity seems to require contact between MgO particles and microbes. Although room closure will rupture the supersacks and disperse the MgO into the interstices among and within the ruptured waste containers, this will not ensure contact between MgO particles and microbes. Furthermore, survival of microbes in samples subjected to treatment with an inhibitory or biocidal agent such as MgO, especially those that have had some contact with particulate MgO, would probably result in the development of increased resistance to MgO.
The results described above suggest that MgO might reduce the rate of microbial gas generation in the WIPP. However, in the absence of repository-specific experiments, the potential inhibitory or biocidal effects of MgO on the microbial gas-production rates are not included in PA.
In the CCA PA, the CCA PAVT, the CRA-2004 PA, and the CRA-2004 PABC calculations, room closure initially proceeded as if the rooms were open. The free air space was eliminated early in the calculations by unmitigated creep closure. Eventually, the salt contacted the waste and deformed it according to the waste response model. At the same time, corrosion and gas production pressurized the rooms. The coupled processes involved compression owing to the superincumbent rock counterbalanced by gas production, which was obtained from sampled parameters. Thus, room closure was caused by salt creep modified by the structural response of the waste and by gas production. MgO was not explicitly included in the PA room closure calculations, and is not expected to have a significant effect on room closure.
This section is based on the text in CRA-2004, Appendix BARRIERS, Section BARRIERS-2.4.
MgO could affect the matrix distribution coefficients (Kds) used to predict transport of dissolved thorium (Th), uranium (U), Pu, and americium (Am) through the Culebra (see Brush 1996 or Brush and Storz 1996 for a definition of matrix Kds). For the CCA PA, data from an empirical sorption study, a mechanistic sorption study, and a column-transport study were used to establish ranges and probability distributions of Kds for Th, U, Pu, and Am.
Most of these Kds were obtained from 6-week, empirical sorption experiments carried out with 1 g of dolomite-rich rock crushed to a size range of 75 to 500 mm; 20 mL of Brine A, ERDA-6 brine, AISinR, or H-17 with dissolved Th(IV), U(VI), Np(V), Pu(V), or Am(III); and a controlled atmosphere containing 0.24, 1.4, or 4.1% CO2 to simulate the expected range of fCO2 in the Culebra, about 3.16 × 10⁻⁴ to 3.16 × 10⁻² atm (see Brush 1996; Brush and Storz 1996). Brine A and ERDA-6 brine are described above (Section MgO-4.1.1); AISinR is a synthetic brine representative of fluids sampled from the Culebra in the WIPP air intake shaft; and H-17 simulates Culebra brine from the H-17 Hydropad.
Brush (1996) and Brush and Storz (1996) extended the empirical Kds obtained with Brine A and ERDA-6 brine to a pH of about 9 or 10 with data from a mechanistic sorption study that quantified the effects of fCO2, pH, and ionic strength on the sorption of Th(IV), U(VI), neptunium(V) (Np(V)), Pu(V), and Am(III) from synthetic NaCl solutions by well-characterized, pure dolomite. Therefore, the Kds for Brine A and ERDA-6 brine used for the CCA PA included the effects of MgO on pH. The Kds for the Culebra brines, however, did not include the effects of MgO on pH because it was assumed that if mixing is sufficient to produce fluids with compositions similar to those of Culebra brines, the pH of these mixtures will also be similar to those of Culebra brines (Brush 1996; Brush and Storz, 1996).
For the CCA PAVT, the EPA specified that the probability distributions for the Kds be changed from uniform to loguniform (Trovato 1997a, Enclosure 2; U.S. Environmental Protection Agency 1998a, Table ES-3 and Table ES-4, Section 5.34, Section 5.35, Section 5.36, Section 5.37, and Section 5.38 and Table 6.3 and Table 6.4; Hansen and Leigh 2003). However, the EPA did not change any of the Kds.
Brush and Storz (1996) corrected some of the ranges of Kds established by Brush (1996) for the CCA PA. These corrections were too late for the far-field transport calculations for the CCA PA, and were not included in the far-field transport calculations for the CCA PAVT. Hansen and Leigh (2003), however, incorporated them in the PA database, and the CRA-2004 PA and the CRA-2004 PABC used the corrected Kds along with the loguniform probability distributions specified by the EPA (see the CRA-2004, Appendix PA, Section PA-5.2). The Kds for Brine A and ERDA-6 brine used for the CRA-2004 PA and the CRA-2004 PABC included the effects of MgO on pH, but the Kds for the Culebra brines do not (Brush 1996; Brush and Storz 1996).
The MgO excess factor is defined as the ratio of the total amount of MgO to be emplaced in the WIPP divided by the total amount required to consume all of the CO2 produced by microbial activity should all of the CPR materials in the repository be consumed, calculated as specified by the EPA (Marcinowski 2004; U.S. Environmental Protection Agency 2004). The EPA’s specifications for calculating the excess factor are described below.
Previously, the DOE referred to the MgO excess factor as the “MgO safety factor,” and the EPA still uses “MgO safety factor.” In this appendix, “MgO excess factor” is used exclusively. For the purposes of the discussions below, these terms are synonymous.
The conceptual model of sequential use of electron acceptors is based on the common observation that, at any given time, (1) microbes use the best available electron acceptor (oxidant) (i.e., the one that yields the most free energy per mole of organic C consumed); (2) after depletion of the best available electron acceptor, these microbes—or other microbes—begin to consume the next-best available electron acceptor; and (3) this process continues with successively less favorable electron acceptors until all of the substrates (CPR materials in the case of the WIPP) are consumed, an essential nutrient is consumed, or some other limiting condition is attained. Sequential use of electron acceptors has been observed in a diverse array of natural and anthropogenic environments, such as lacustrine, riverine, estuarine, and oceanic sediments; soils; and landfills. In these environments, the order of use observed is oxygen (O2) (referred to as aerobic respiration), NO3- (denitrification), Mn(IV) oxides and hydroxides (Mn reduction), Fe(III) oxides and hydroxides (Fe reduction), SO42- (SO42- reduction), and CO2 (fermentation and methanogenesis) (Froelich et al. 1979; Berner 1980; Criddle, Alvarez, and McCarty 1991; Chapelle 1993; Wang and Van Cappellen 1996; Schlesinger 1997; Hunter, Wang, and P. Van Cappellan 1998; Fenchel, King, and T.H. Blackburn 2000). (In the following discussion, fermentation and methanogenesis are usually referred to as “methanogenesis” for simplicity.) Sequential use of electron acceptors by microbes is included in the conceptual model for gas generation in the WIPP, one of the four conceptual models for long-term chemical evolution of WIPP disposal rooms implemented in WIPP PA (Sandia National Laboratories 1996; U.S. Department of Energy 1996a, Chapter 6, Section 6.4.3.3; CRA-2004, Chapter 6.0, Section 6.4.3.3).
In the WIPP, the quantities of O2, Mn(IV) oxides and hydroxides, and Fe(III) oxides and hydroxides will be small relative to that of CPR materials (Brush 1990 and 1995; Wang and Brush 1996a). Therefore, aerobic respiration, manganese (Mn) reduction, and Fe reduction can be ignored from the standpoint of their potential effects on the long-term chemical behavior of the repository.
However, several potentially useful electron acceptors will be present in and/or around WIPP disposal rooms: (1) some NO3- and SO42- will be present in the waste; (2) SO42- is present in SO42--bearing minerals such as anhydrite, gypsum (CaSO4×2H2O), and polyhalite (K2MgCa2(SO4)4×2H2O) in the Salado surrounding the repository, and dissolved in Salado and Castile Formation brines; and (3) CO2 could be produced by denitrification, SO42- reduction, and even methanogenesis (Brush 1990 and 1995; Wang and Brush 1996a). Therefore, denitrification, SO42- reduction, and methanogenesis are potentially important microbial respiratory pathways in the repository.
The overall reactions used to represent possible denitrification, SO42- reduction, and methanogenesis in the WIPP (Wang and Brush 1996a) are, respectively,
C6H10O5(s) +
4.8H+(aq) + 4.8NO3-(aq)
®
7.4H2O(aq or g) + 6CO2 (aq or g)+
2.4N2,(aq or
g)
(MgO.13)
C6H10O5(s) + 6H+(aq)
+ 3SO42-(aq) ® 5H2O(aq or g)
+ 6CO2(aq or g) + 3H2S(aq or g)
(MgO.14)
C6H10O5(s) + H2O(aq or g) ® 3CH4(aq or g) + 3CO2(aq or g) (MgO.15)
For these reactions, the CO2 yields are 1 mol of CO2 per mol of organic C consumed from denitrification and SO42- reduction, and 0.5 mol of CO2 per mol of C from methanogenesis. Therefore, the MgO excess factor that would be calculated assuming that methanogenesis is the only or the dominant respiratory pathway would be double or approximately double that calculated assuming denitrification or SO42- reduction is the only or the dominant respiratory pathway.
The total quantity of CPR materials in the WIPP TRU waste inventory—including the waste, the waste containers, and various waste emplacement materials—exceeds the quantity of NO3- and SO42- in the waste. This was the case at the time of the CCA PA and the CCA PAVT (U.S. Department of Energy 1996b), the CRA-2004, Appendix DATA, Attachment F, and the CRA-2004 PABC (Crawford 2005a and 2005b). Therefore, it appeared that (1) the quantity of CPR materials consumed by methanogenesis could exceed that consumed by denitrification and SO42- reduction, should all of the CPR materials be consumed; and (2) the overall CO2 yield calculated assuming that methanogenesis would be dominant could be close to 0.5 mol of CO2 per mol of C consumed (the CCA, Appendix SOTERM; the CRA-2004, Appendix BARRIERS). (Note that the conservative assumption that all of the CPR materials in the inventory would be consumed provides a lower bound on the MgO excess factor because partial consumption of the CPR materials would produce less CO2 and consume less MgO.)
Thus, Wang (2000a) used the masses of CPR materials, NO3-, and SO42- in the WIPP TRU waste inventory used for the CCA PA and the CCA PAVT (U.S. Department of Energy 1996b) to calculate that, should microbes consume all the CPR materials, denitrification would consume about 3 mol % of these materials, SO42- reduction would consume 2 mol %, and methanogenesis would consume 95 mol %. The overall CO2 yield would be 0.525 mol of CO2 per mol of organic C consumed. Snider (2003d) used the CRA-2004 PA inventory (CRA-2004, Appendix DATA, Attachment F) to calculate that denitrification would consume 4.72 mol % of the CPR materials, SO42- reduction would consume 0.82 mol %, methanogenesis would consume 94.46 mol %, and the overall CO2 yield would be 0.528 mol of CO2 per mol of organic C consumed. Based on the CRA-2004 PABC inventory (Crawford 2005a and 2005b), Brush et al. (2006) calculated that denitrification, SO42- reduction, and methanogenesis would consume 4.89, 0.84, and 94.27 mol %, respectively, of the CPR materials in the repository; the overall CO2 yield would be 0.529 mol of CO2 per mol of organic C.
However, it is possible that microbial SO42- reduction could continue after microbes consume all the SO42- in the waste. Microbial SO42- reduction could continue by using the SO42- dissolved in Salado or Castile brines, or by using SO42- released by the dissolution of anhydrite, gypsum, and polyhalite in the disturbed rock zone (DRZ) surrounding WIPP disposal rooms (Section MgO-6.2.3.1, Section MgO-6.2.3.2, and Section MgO-6.2.3.3).
This section reviews (1) the establishment of the MgO excess factor (Section MgO-6.2.1); (2) the reduction of the MgO excess factor from 1.95 to 1.67 (Section MgO-6.2.2), which occurred concomitantly with the EPA’s approval of the DOE’s request to eliminate the emplacement of minisacks (Section MgO-2.1.2); (3) additional developments relevant to the MgO excess factor prior to the CRA-2004 (Section MgO-6.2.3); and (4) changes since the CRA-2004 (Section MgO-6.2.4), which included the EPA’s approval of the DOE’s request to reduce the MgO excess factor from 1.67 to 1.2.
Just prior to the submittal of the CCA, Peterson (1996) calculated the quantity of MgO required to consume all of the CO2 produced should microbes consume all of the CPR materials in the WIPP. Peterson (1996) assumed that (1) microbes would consume all of the CPR materials in the WIPP TRU waste inventory (U.S. Department of Energy 1996b), and (2) the CO2 yield would be 1 mol of CO2 per mol of organic C in the CPR materials (i.e., there would be no methanogenesis).
The DOE stated in the CCA that it would emplace 85,600 short tons (77,640 metric tons) of MgO in the WIPP (U.S. Department of Energy 1996a, Chapter 3, Section 3.3.3). However, it did not specify an MgO excess factor. Instead, it said that “Since the MgO backfill is being added in large excess, any quantity of brine that may enter the repository will be saturated with respect to the appropriate MgO reaction products” (the CCA, Appendix BACK, p. BACK-3).
The MgO excess factor was first established by an EPA request for additional information during its review of the CCA, and by the DOE’s response to that request. The portion of the EPA request relevant to the establishment of the MgO excess factor was that the DOE “… provide information which demonstrates that the excess volume proposed to be emplaced can actually be accommodated and whether it covers the uncertainties in the actual geochemical process” (Nichols 1996, Enclosure 2, p. 11). The pertinent portion of the DOE’s response (Dials 1997) was the following:
The quantity of MgO required to be emplaced to assure removal of CO2 from the gas phase is based on calculations that consider all processes that might contribute to CO2 production. These calculations are very conservative in that they utilize a maximum extent of CO2 production, a quantity that is unlikely to be attained. Based on the [Baseline Inventory Report, or BIR] and memoranda in the Records Center, the total number of moles of MgO required to react with the maximum possible amount of CO2 generated is 9.85 × 10⁸ mol. Using the appropriate conversion factors (40.3 g/mol, 0.001 kg/g, 2.202 kg/lb, 0.0005 lb/ton) a total of 43,700 tons of MgO are required to react with this maximum estimate of [CO2] production. Section 3.3.3 of the CCA documents that approximately 85,600 tons of backfill will be emplaced in the repository. Therefore, by dividing the mass of backfill to be emplaced (85,600 tons) by the maximum mass of MgO required to react with the maximum possible [CO2] production (43,700 tons), a 1.95 factor of safety results. In other words, 95% more MgO will be emplaced than is required to react with a conservative estimate of the maximum quantity of CO2 production.
The EPA included this calculation of the MgO excess factor in its review of the CCA (U.S. Environmental Protection Agency 1998a, Section 44.A.5 and Section 44.A.6).
This excess factor of 1.95 is consistent with the conservative assumptions that (1) microbes would consume all of the CPR materials in the inventory (U.S. Department of Energy 1996b), and (2) the CO2 yield would be 1 mol of CO2 per mol of organic C in the CPR materials (i.e., there would be no methanogenesis even if all of the CPR materials in the repository were consumed).
The DOE assumed that the CO2 yield would be 1 mol of CO2 per mol of organic C in the CPR materials because at the time that Wang and Brush (1996a and 1996b) established the conceptual model and parameters for microbial gas generation in the CCA PA, Francis and Gillow (1994) and Francis, Gillow, and Giles (1997) had observed aerobic respiration and denitrification, but not methanogenesis, in their microbial gas-generation experiments at Brookhaven National Laboratory (BNL). By the time Wang and Brush (1996a and 1996b) established the model and parameters for the CCA PA, BNL had carried out their experiments for up to 1,228 days (3.36 years). Therefore, there was no experimental evidence at the time of the CCA PA or the CCA PAVT that methanogenesis would actually occur in the WIPP. There were at least four possible reasons why methanogenesis had not been observed by the time of the CCA and the CCA PAVT:
1. Halophilic methanogens capable of metabolizing complex, organic substrates such as cellulosic materials under expected WIPP conditions do not exist.
2. Halophilic methanogens capable of metabolizing complex, organic substrates exist, but were not present in the materials used to inoculate these experiments (laboratory dust; brine and mud from the salt lakes in Nash Draw; and brine collected from G Seep in G Drift, a drift located in the northern end of the WIPP underground workings).
3. Methanogens were present in the materials used to inoculate these experiments, but had not survived collection, storage, and inoculation of the BNL experiments.
4. Methanogens had survived collection, storage, and inoculation of these experiments, but there had not been enough time for other microbes to consume all of the NO3- and SO42- and allow the methanogens to become active.
In 2001, the MgO excess factor decreased from 1.95 to 1.67 when the EPA approved the DOE’s 2000 request to eliminate the emplacement of minisacks among the waste containers and between the waste containers and the ribs (Triay 2000; U.S. Department of Energy 2000; Marcinowski 2001; U.S. Environmental Protection Agency 2001). Section MgO-2.1.2 describes the DOE’s request to eliminate the minisacks and the EPA’s approval of this request.
The DOE’s 2000 request to eliminate the minisacks proposed a less-conservative assumption for the calculation of the MgO excess factor: that methanogenesis would be the dominant microbial respiratory pathway in the WIPP should all of the CPR materials in the repository be consumed, and therefore, microbes would not convert all of the organic C in the CPR materials to CO2.
The DOE proposed this less-conservative assumption because Francis and Gillow (2000, pp. 2, 3, and 10) observed CH4 in the headspaces of their long-term, inundated microbial gas-generation experiments carried out at BNL for 2,718 days (7.44 years) under most combinations of conditions. However, Francis and Gillow (2000) did not observe CH4 in the inundated experiments to which excess NO3- had been added at the start of the experiments. The addition of excess NO3- to some of the experiments appears to have prevented the onset of methanogenesis. Wang (2000a) used the results of Francis and Gillow (2000) to support the DOE’s request to eliminate the minisacks (Section MgO-2.1.2).
Therefore, it was clear that the absence of experimental evidence for methanogenesis at the time of the CCA was because microbial activity in the initially aerobic inundated experiments had not progressed through aerobic respiration, denitrification, and SO42- reduction to methanogenesis; and that microbial activity in the initially anaerobic inundated experiments had not progressed through denitrification and SO42- reduction to methanogenesis. The requirement that these steps be completed prior to the onset of methanogenesis is a consequence of the observation of the sequential use of electron acceptors (Section MgO-6.1), according to which methanogenesis does not start until any and all NO3- and SO42- are depleted. Although methanogenesis had not been observed by the time of the CCA in experiments carried out for up to 1,228 days (3.36 years), Francis and Gillow observed CH4 in inundated experiments after 2,718 days (7.44 years).
It was also clear from these results by the time of the DOE’s 2000 request to eliminate the minisacks that (1) there exist communities of halophilic methanogens capable of metabolizing complex organic substrates, such as cellulosic materials, under expected WIPP conditions; (2) these microbes are present and viable in one or more of the materials used to inoculate these experiments; and (3) these microbes are capable of surviving exposure to O2. Methanogens are obligate anaerobes and, as such, are extremely sensitive to exposure to O2. The fact that they produced CH4 after exposure to O2 implies that they are capable of producing resistant forms that can survive initially oxic conditions in these experiments.
Furthermore, results from the BNL microbial gas-generation study have confirmed that viable halophilic methanogens capable of metabolizing cellulosic materials under expected near-field conditions are present in the WIPP underground workings. Francis and Gillow (2000, pp. 2 and 10) detected CH4 in initially oxic, unamended, and uninoculated experiments, and in initially anoxic, unamended, and uninoculated experiments. The most likely explanation for microbial gas production in these uninoculated experiments is that G Seep, the brine used for these inundated experiments, was collected from the WIPP underground workings. This brine contained a small but viable microflora, including methanogens, and was not sterilized prior to use. The fact that these microbes produced CH4 after exposure to O2 in the air used to ventilate G Drift and in initially oxic experiments implies that they are capable of producing resistant forms that can withstand initially oxic conditions in the repository.
However, the presence of viable halophilic methanogens in the WIPP does not preclude the possibility that similar communities of microbes are also present in the other materials used to inoculate these experiments, especially brine and mud from the salt lakes in Nash Draw. It is quite possible that methanogens in these lakes are also capable of producing resistant forms that can survive the oxic conditions encountered during eolian transport from Nash Draw to the WIPP air intake shaft, and initially oxic conditions in the repository. Therefore, the presence of viable methanogens in the WIPP does not depend on the claim that microbes have survived in the Salado since the Permian Period (Vreeland, Rosenzweig, and Powers 2000) a claim that is controversial (see, for example, Hazen and Roedder 2001; Parkes 2000; Powers, Vreeland, and Rosenzweig 2001; Satterfield et al. 2005).
Based on the results of Francis and Gillow (2000) and the analysis of Wang (2000a), the DOE’s 2000 request to eliminate the minisacks proposed that, if methanogenesis were the dominant respiratory pathway, it would increase the MgO excess factor from values of 1.95 prior to and 1.67 after the proposed elimination of the minisacks to values of 3.73 prior to and 3.23 after minisack elimination (U.S. Department of Energy 2000, Table 1).
The EPA’s approval of the DOE’s request to eliminate the minisacks included the results of several of the DOE’s calculations regarding excess MgO, but did not acknowledge the proposed excess factors of 3.73 prior to and 3.23 after minisack elimination (U.S. Environmental Protection Agency 2001, Table 1).
In March 2004, the EPA approved emplacing supercompacted waste from the AMWTP at the INEEL in the WIPP (Marcinowski 2004; Trinity Engineering Associates 2004; U.S. Environmental Protection Agency 2004). However, the EPA specified that the DOE maintain an MgO excess factor of 1.67. Because much of the AMWTP waste contains high concentrations of CPR materials, the DOE anticipated the need to emplace additional MgO in the repository, and began to explore various possible approaches to support a Planned Change Request (PCR) for EPA approval of a reduction in the MgO excess factor.
Gillow and Francis (2001b) reported additional CH4 in the inundated, initially anaerobic experiments in which Francis and Gillow (2000, pp. 2, 3, and 10) had first detected this gas. Furthermore, Gillow and Francis (2001b, pp. 3-4 and 3-5) detected CH4 in experiments to which excess NO3- had been added at the start of these experiments. These results were from experiments sampled after 3462 days (9.48 years). After 2,718 days (7.44 years), Francis and Gillow (2000, pp. 2, 3, and 10) had not observed CH4 in the experiments to which excess NO3- had been added. Therefore, this excess NO3- had delayed, but did not permanently prevent, the onset of methanogenesis. This seemed to make the case stronger for methanogenesis as a potential microbial respiratory pathway in the WIPP.
Consequently, the DOE emphasized the likely dominance of methanogenesis during microbial consumption of the CPR materials in the WIPP (CRA-2004, Appendix BARRIERS, Section BARRIERS-2.5.1). Based on the CRA-2004 PA inventory (CRA-2004, Appendix DATA, Attachment F) and calculations by Snider (2003d), the DOE concluded that (1) 4.72 mol % of the CPR materials would be consumed by denitrification, 0.82 mol % by SO42- reduction, and 94.46 mol % by methanogenesis; (2) the overall CO2 yield would be 0.528 mol of CO2 per mol of organic C consumed; and (3) the MgO excess factor would be 2.45.
However, during a DOE-EPA technical exchange in January 2004, the EPA expressed concern that naturally occurring SO42- could delay or even prevent methanogenesis in the WIPP after microbes consume the SO42- in the waste. Dissolved SO42- is present in both Salado and Castile brines (see Table MgO-6), so advective transport of SO42- into WIPP disposal rooms via seepage of intergranular Salado brines (i.e., GWB) from the DRZ, or inflow of brines from the Castile (i.e., ERDA-6 brine) could delay or prevent methanogenesis. Furthermore, diffusive transport of dissolved SO42- from DRZ minerals such as anhydrite, gypsum, and polyhalite—all of which contain SO42-—to WIPP disposal rooms could become important as microbial consumption of SO42- in the waste creates a concentration gradient from the DRZ to the repository.
Kanney et al. (2004) analyzed the effects of CPR materials in a panel and transport of naturally occurring SO42- on the extent of microbial methanogenesis in the WIPP and the MgO excess factor for different assumed loadings of AMWTP supercompacted waste in a panel.
Kanney et al. (2004) used the four loadings of AMWTP supercompacted waste in a hypothetical “Panel X” developed by Leigh (2003, 2004a, and 2004b) for the DOE’s analysis of the effects of this waste on the long-term performance of the WIPP (Hansen et al. 2004). The four loadings assumed for Panel X were (1) the “DOE homogeneous Panel X,” based on the assumption that the AMWTP supercompacted waste would be homogeneously emplaced throughout the entire 10-panel repository (Panel X would comprise ~11-12 volume % (vol %) AMWTP supercompacted waste, the same as the other 9 panels); (2) the “DOE realistic Panel X,” which would comprise 14 vol % AMWTP supercompacted waste; (3) the “DOE conservative Panel X,” which would consist of 27 vol % AMWTP supercompacted waste; and (4) the “EPA conservative Panel X,” which would contain 50 vol % AMWTP supercompacted waste. In all four cases, the remaining waste in the WIPP inventory was assumed to be distributed homogeneously throughout the other nine panels.
Kanney et al. (2004, Section 3.2.1, pp. 20-22, and especially Figure 4 and Figure 5) used the BRAGFLO results from the PA calculations of Hansen et al. (2004) to demonstrate that
In all but a few vectors, CPR biodegradation has ceased after about 2000 years. In most vectors, this is because all of the CPR has been consumed. For a few vectors the consumption of CPR [materials] has ceased even though there [are] CPR [materials] remaining. This is likely caused by very low brine saturations. For those few vectors that still show some activity, the rate of … consumption is only a fraction of the inundated rate. Thus, a value [of] 2000 years for the biodegradation time scale Tbio is appropriate for this analysis.
Kanney et al. (2004, Section 3.1.1, p. 19; and Section 3.2.2, p. 22) then used a dissolved SO42- concentration of 182 mM, the highest concentration predicted by Brush and Xiong (2003a) for GWB or ERDA-6 brine before or after equilibration with the solids in WIPP disposal rooms (see Section MgO-5.1), and a brine volume of 7.74 × 10⁴ m3, the largest volume predicted after 2,000 years in all of the 100 vectors of Replicate 1 of Hansen et al. (2004), to calculate the quantity of SO42- that could enter the repository via advective transport.
To calculate the quantity that could enter via diffusive transport in 2,000 years, Kanney et al. (2004, Section 2.2.2, pp. 5-7; Section 3.1.2, p. 18) used a concentration of 1.7 wt % each for anhydrite, gypsum, and polyhalite (Stein 1985; Brush 1990) to calculate the concentration of SO42- in the Salado at or near the stratigraphic horizon of the WIPP. Kanney et al. (2004, Section 2.3.3, pp. 13-16; Section 3.2.3, p. 23) then assumed that all the SO42- in these minerals within 1.06 m (3.5 ft) of the excavated surfaces of a panel would diffuse into the repository in 2000 years. They calculated this “effective diffusion length” using (1) a value of 9.84 × 10⁻¹⁰ meters squared per second (m2/s) for the free-solution tracer diffusion coefficient of SO42- (Li and Gregory 1974), (2) a value of 0.05 for the porosity of the Salado DRZ, (3) a value of 1.8 for the cementation factor (Deal et al. 1989), (4) a tortuosity of 0.091, and (5) a value of 4.48 × 10⁻¹² m2/s for the effective diffusion coefficient of SO42-.
For these parameter values, Kanney et al. (2004) predicted that a maximum quantity of 1.35 × 10⁶ kg of SO42- would be advected into Panel X in Castile brine and a total of 2.37 × 10⁶ kg of SO42- would dissolve from anhydrite, gypsum, and polyhalite and diffuse into Panel X from the DRZ surrounding Panel X. These quantities are much greater than those in this panel’s waste, just (1.40-4.40) × 104 kg. Therefore, the total quantity of SO42- available to SO42--reducing microbes would be ~ 3.74 × 10⁶ kg (1.35 × 10⁶ kg + 2.37 × 10⁶ kg + 1.4 × 10⁴ kg).
Finally, Kanney et al. (2004, Section 3.3, pp. 24-26) used the waste-material parameters from Leigh (2004a, 2004b), the CRA-2004 PA inventory (the CRA-2004, Appendix DATA, Attachment F), and the methods of Snider (2003d) to predict the quantities of CPR materials in the DOE homogeneous Panel X, the DOE realistic Panel X, the DOE conservative Panel X, and the EPA conservative Panel X that would be consumed by microbes in 2000 years via denitrification, SO42- reduction using SO42- in the waste, SO42- reduction using naturally occurring SO42- (Castile-brine SO42- and SO42- in DRZ minerals), and methanogenesis. They also determined the MgO excess factors for these panels.
Table MgO-9 provides the results of these calculations. They show that, for a given panel loading (i.e., for a given quantity of CPR materials), including naturally occurring SO42- decreased the MgO excess factor relative to that calculated using only the SO42- in the waste (e.g., the MgO safety factor for the DOE homogeneous Panel X decreased from 2.45 to 1.37). Kanney et al. (2004, Section 3.3, pp. 25-26) also concluded,
Table MgO-9. Effects of Panel Loading and the Source of SO42- on Microbial Respiratory Pathways and the MgO Excess Factor—Base Case. Adapted from Kanney et al. (2004).
|
Loading of Panel X and Source of SO42- |
Denitrification |
SO42- Reduction (% of CPR Materials Consumed) |
Methanogenesis (% of CPR Materials Consumed) |
MgO Excess Factor |
|
DOE Homogeneous:a |
||||
|
Waste SO42- |
4.75 |
0.82 |
94.46 |
2.45 |
|
Waste + Natural SO42- |
4.75 |
70.57 |
24.68 |
1.37 |
|
DOE Realistic:b |
||||
|
Waste SO42- |
4.48 |
0.66 |
94.87 |
2.44 |
|
Waste + Natural SO42- |
4.48 |
63.27 |
32.26 |
1.40 |
|
DOE Conservative:c |
||||
|
Waste SO42- |
3.00 |
0.16 |
96.84 |
1.71 |
|
Waste + Natural SO42- |
3.00 |
42.98 |
54.03 |
1.13 |
|
EPA Conservative:d |
||||
|
Waste SO42- |
1.03 |
0.23 |
98.75 |
1.21 |
|
Waste + Natural SO42- |
1.03 |
32.31 |
66.66 |
0.94 |
|
a Panel X would comprise ~11-12 vol % AMWTP supercompacted waste. b Panel X would comprise 14 vol % AMWTP supercompacted waste. c Panel X would consist of 27 vol % AMWTP supercompacted waste. d Panel X would contain 50 vol % AMWTP supercompacted waste. |
||||
In spite of the decreases noted above, these results show that the MgO [excess]F[1]F factor is not very sensitive to the amount of [SO42-]. For the DOE homogeneous [P]anel X, the amount of [SO42-] increased by about 8500% while the … [excess] factor decreased by about 44%. For the DOE realistic [P]anel X, the amount of [SO42-] increased by about 9500% and the [MgO excess] factor decreased by about 43%. For the DOE conservative case, the amount of [SO42-] increased by about 26,500% and the [excess] factor decreased by about 34%. For the EPA conservative scenario, the amount of [SO42-] increased by about 14000% and the ... [excess] factor decreased by about 22%.
The MgO [excess] factor is much more sensitive to the amount of CPR [materials]. Keeping in mind that there is roughly the same amount of [SO42-] available in each [panel], one can observe how the [excess] factor change[d] as more CPR [materials were] added by comparing [excess] factors for different [loadings]. In going from the DOE realistic [Panel X] to the EPA conservative [Panel X], the [mass of] CPR [materials] increase[d] by about 95% and the MgO safety factor decrease[d] by about 33%.
Note that the fraction of CPR [materials consumed] by [SO42-] reduction in the EPA conservative [P]anel X … [was] actually less than for the DOE conservative [P]anel X, while the MgO [excess] factor [was] lower than that of [the] DOE conservative [P]anel X. This [was] caused by the larger amount of CPR [materials] in the EPA conservative [P]anel X....
Kanney et al. (2004, Section 4, pp. 27-34) also carried out an uncertainty analysis of the effects of the brine volume that enters a panel following a human intrusion, the time required for microbial consumption of all of the CPR materials, and the effective diffusion coefficient for SO42- on these results.
Kanney et al. (2004, Section 4, Table 13) pointed out that the probability of a large volume of brine flowing into a panel from a reservoir in the Castile (the only way that large volumes of brine can enter the repository) is quite low; about 0.006. Therefore, Kanney et al. (2004, Section 4.1, pp. 27-29) recalculated the effects of panel loading and the source of SO42- on microbial methanogenesis in the absence of Castile brine. This change (1) decreased the maximum volume of brine that could enter Panel X by about 75%, from 7.74 × 10⁴ to 1.91 × 10⁴ m3; (2) decreased the maximum quantity of SO42- advected into this panel by the same percentage, from 1.35 × 10⁶ to 3.34 × 10⁵ kg; and (3) decreased the total quantity of SO42- available to microbes in the panel by 27%, from (3.74-3.77) × 106 to (2.72-2.75) × 106 kg. The absence of Castile brine from Panel X increased the percentage of CPR materials consumed by methanogenesis by about 13% in the case of the EPA conservative Panel X to 77% for the DOE homogeneous Panel X, and increased the MgO excess factor for the same panels by about 6-11% (see Table MgO-10).
Table MgO-10. Effects of Panel Loading and the Source of SO42- on Microbial Methanogenesis and the MgO Excess Factor—Effects of Having no Castile Brine Intrude Panel X. Adapted from Kanney et al. (2004).
|
Loading of Panel X and Source of SO42- |
Denitrification |
SO42- Reduction (% of CPR Materials Consumed) |
Methanogenesis (% of CPR Materials Consumed) |
MgO Excess Factor |
|
DOE Homogeneous:a |
||||
|
Castile brine present |
4.75 |
70.57 |
24.68 |
1.37 |
|
No Castile brine |
4.75 |
51.47 |
43.77 |
1.52 |
|
DOE Realistic:b |
||||
|
Castile brine present |
4.48 |
63.27 |
32.26 |
1.40 |
|
No Castile brine |
4.48 |
46.13 |
49.40 |
1.55 |
|
DOE Conservative:c |
||||
|
Castile brine present |
3.00 |
42.98 |
54.03 |
1.13 |
|
No Castile brine |
3.00 |
31.26 |
65.75 |
1.22 |
|
EPA Conservative:d |
||||
|
Castile brine present |
1.03 |
32.31 |
66.66 |
0.94 |
|
No Castile brine |
1.03 |
23.53 |
75.44 |
1.00 |
|
a Panel X would comprise ~11-12 vol % AMWTP supercompacted waste. b Panel X would comprise 14 vol % AMWTP supercompacted waste. c Panel X would consist of 27 vol % AMWTP supercompacted waste. d Panel X would contain 50 vol % AMWTP supercompacted waste. |
||||
Kanney et al. (2004, Section 4.2, pp. 29-32) then predicted the effects of doubling the time required for microbial consumption of all CPR materials from 2,000 to 4,000 years. This change
1. Increased the maximum volume of Castile brine that could enter Panel X by about 32%, from 7.74 × 10⁴ to 1.02 × 10⁵ m3
2. Increased the maximum quantity of SO42- advected into this panel by the same percentage, from 1.35 × 10⁶ to 1.78 × 10⁶ kg
3. Increased the effective diffusion length by 42%, from 1.06 to 1.50
4. Increased the quantity of SO42- that diffused into the panel by 41%, from 2.37 × 10⁶ to 3.35 × 10⁶ kg
5. Increased the total quantity of SO42- available in this panel by 37%, from (3.74-3.77) × 106 to (5.14-5.17) × 106 kg
Doubling the time required for microbial consumption of all of the CPR materials decreased the percentage of CPR materials consumed by methanogenesis by about 18% in the case of the EPA conservative Panel X to 100% for the DOE homogeneous Panel X, and decreased the MgO excess factor for the same panels by about 9-12% (Table MgO-11).
Table MgO-11. Effects of Panel Loading and the Source of SO42- on Microbial Respiratory Pathways and the MgO Excess Factor—Effects of Doubling the Time Required for Consumption of All CPR Materials. Adapted from Kanney et al. (2004).
|
Loading of Panel X and Source of SO42- |
Denitrification |
SO42- Reduction (% of CPR Materials Consumed) |
Methanogenesis (% of CPR Materials Consumed) |
MgO Excess Factor |
|
DOE Homogeneous:a |
||||
|
2,000 years |
4.75 |
70.57 |
24.68 |
1.37 |
|
4,000 years |
4.75 |
95.25 |
0.00 |
1.21 |
|
DOE Realistic:b |
||||
|
2,000 years |
4.48 |
63.27 |
32.26 |
1.40 |
|
4,000 years |
4.48 |
86.98 |
8.54 |
1.25 |
|
DOE Conservative:c |
||||
|
2,000 years |
3.00 |
42.98 |
54.03 |
1.13 |
|
4,000 years |
3.00 |
59.20 |
37.81 |
1.02 |
|
EPA Conservative:d |
||||
|
2,000 years |
1.03 |
32.31 |
66.66 |
0.94 |
|
4,000 years |
1.03 |
44.47 |
54.51 |
0.86 |
|
a Panel X would comprise ~11-12 vol % AMWTP supercompacted waste. b Panel X would comprise 14 vol % AMWTP supercompacted waste. c Panel X would consist of 27 vol % AMWTP supercompacted waste. d Panel X would contain 50 vol % AMWTP supercompacted waste. |
||||
Finally, Kanney et al. (2004, Section 4.3, pp. 32-34) predicted the effects of approximately doubling the effective diffusion coefficient for SO42-, from 4.48 × 10⁻¹² to 1.00 × 10⁻¹¹ m2/s. This change (1) increased the effective diffusion length by 50%, from 1.06 to 1.59 m (3.5 to 5.2 ft); (2) increased the quantity of SO42- that diffused into the panel by 49%, from 2.37 × 10⁶ to 3.54 × 10⁶ kg; and (3) increased the total quantity of SO42- available by 31%, from (3.74-3.77) × 106 to (4.91-4.94) × 106 kg. Doubling the effective diffusion coefficient for SO42- decreased the percentage of CPR materials consumed by methanogenesis by about 15% in the case of the EPA conservative Panel X to 89% for the DOE homogeneous Panel X, and decreased the MgO excess factor for the same panels by about 6-10% (Table MgO-12).
Table MgO-12. Effects of Panel Loading and the Source of SO42- on Microbial Respiratory Pathways and the MgO Excess Factor—Effects of Doubling the Effective Diffusion Coefficient for SO42-. Adapted from Kanney et al. (2004).
|
Loading of Panel X and Source of SO42- |
Denitrification |
SO42- Reduction (% of CPR Materials Consumed) |
Methanogenesis (% of CPR Materials Consumed) |
MgO Excess Factor |
|
DOE Homogeneous:a |
||||
|
Base Case |
4.75 |
70.57 |
24.68 |
1.37 |
|
Doubling Deff |
4.75 |
92.48 |
2.76 |
1.23 |
|
DOE Realistic:b |
||||
|
Base Case |
4.48 |
63.27 |
32.26 |
1.40 |
|
Doubling Deff |
4.48 |
82.94 |
12.58 |
1.27 |
|
DOE Conservative:c |
||||
|
Base Case |
3.00 |
42.98 |
54.03 |
1.13 |
|
Doubling Deff |
3.00 |
56.44 |
40.57 |
1.04 |
|
EPA Conservative:d |
||||
|
Base Case |
1.03 |
32.31 |
66.66 |
0.94 |
|
Doubling Deff |
1.03 |
42.40 |
56.58 |
0.88 |
|
a Panel X would comprise ~11-12 vol % AMWTP supercompacted waste. b Panel X would comprise 14 vol % AMWTP supercompacted waste. c Panel X would consist of 27 vol % AMWTP supercompacted waste. d Panel X would contain 50 vol % AMWTP supercompacted waste. |
||||
The EPA concluded that the analysis of Kanney et al. (2004) did not adequately bound the quantity of naturally occurring SO42- that could enter WIPP disposal rooms. In its review of the issues associated with the emplacement of AMWTP supercompacted waste in the WIPP, Trinity Engineering Associates (TEA) (2004, pp. 31-33) concluded,
TEA agrees that advection, dissolution, and diffusion in brine are the major mechanisms for transporting natural [SO42-] into the repository. TEA also agrees that basing the quantity of available [SO42-] on the maximum available brine volume and ignoring mass transfer limitations in dissolution and diffusion are conservative. However, TEA questions certain details of the approach that should be resolved before [the DOE’s] calculations can be accepted as adequately bounding sulfate availability. These questions primarily concern the questionable basis for the assumed rate of room closure and the associated degree of DRZ healing, a lack of consideration of the anhydrite-rich beds immediately above the repository, and a lack of consideration of the effect of increased [Fe] surface area or the conservatism of the microbial degradation rates in determining an appropriate time scale for the sulfate reduction reaction.
The timing of room closure and the associated degree of DRZ healing cited by Kanney et al. [2004] are related to the accuracy of SANTOS model predictions which are currently being reviewed by the Agency... If the SANTOS model predictions are found to be inaccurate, the conclusions cited by Kanney et al. [2004] may not be supported. In addition, the belief that the vertical DRZ would essentially heal within fewer than 100 years may be inconsistent with the approved conceptual model implemented in the CCA and PAVT [PAs], which incorporate a DRZ that endures for 10,000 years with permeabilities that can be orders of magnitude higher than for intact halite. Even if the vertical DRZ rapidly heals to the extent that additional vertical brine flow is not of concern, [the DOE’s] diffusion length of about 1 m is not consistent with the approximately 3 m cited extent of the lateral DRZ. The lateral DRZ includes stress fracturing, provides advective access to Anhydrite B, and will endure significantly longer than the vertical DRZ (Kanney et al. 2004, p. 9).
TEA agrees that pressure-induced fractures are more likely to conduct brine away from the repository rather than toward it, and that brine flow into the repository from the thinner anhydrite layers immediately above the waste rooms is likely to be small compared with the volume of brine inflow assumed in [the DOE’s] calculations. However, TEA believes that structural disruptions during room closure, such as a roof collapse that would bring [SO42-]-bearing minerals such as anhydrite into direct contact with waste room brines, cannot be ruled out. Additional [SO42-] could be derived in this manner from Anhydrite Interbeds A and B, and from the anhydrite-rich halite between these interbeds (Stein 1985). As the [SO42-] in the brine is consumed by the reduction reaction, the tendency of the system to maintain chemical equilibrium requires that sulfates present in minerals accessible to repository brines dissolve. These sources of additional natural [SO42-] were not considered in [the DOE’s] analysis.
The assumption that all [SO42-] around the repository within an approximately 1 m diffusion length would be available for reaction was considered by [the DOE] to account for [SO42-] that may be dissolved from the Salado as well as [SO42-] that may diffuse from the Salado (Kanney et al. 2004, p. 13). The approximately 1 m diffusion length was based in part on the assumption that CPR degradation would be essentially complete within 2,000 years (Kanney et al. 2004, Sections 2.3.1 and 3.2.1). The 2,000-year time scale is used by [the DOE] to establish limits for the volume of brine inflow and diffusion length that need to be considered as sources of [SO42-]. However, the assumption that CPR degradation would be essentially complete within 2,000 years does not hold for waste panels with the increased iron surface areas that would be present with supercompacted AMWTF waste. Stein and Zelinski (2003, Figure 2) show that CPR biodegradation endures for over 10,000 years for an increasing number of vectors because of decreased brine saturation as the iron surface area increases. TEA has agreed that the effects of increased iron surface areas can be ignored in [PA] for purposes of gas generation impacts because the prolonged CPR degradation reaction conservatively results in less overall gas generation (see Section 5.2.2 [of TEA, 2004]). However, ignoring a prolonged CPR degradation reaction for purposes of limiting the [SO42-]-reduction reaction is not conservative and inappropriate. In addition, the microbial degradation rates used in BRAGFLO are consistent with the higher initial reaction rates observed in microbial degradation experiments. Use of these higher initial rates is conservative from the standpoint of estimating gas generation rates, but use of the lower, long-term rates would be more conservative for the purpose of determining the length of time available for [SO42-] diffusion.
The MgO safety factors calculated by [the DOE] fall below the Agency-approved value of 1.67 (EPA, 2001) for every [TEA’s italics] waste loading scenario considered in [the DOE’s] analysis when natural sulfates are included. [The DOE’s] calculated safety factors range from 0.94 for the EPA loading scenario (50 percent supercompacted AMWTF waste and 50 percent standard waste) to 1.40 for the DOE realistic Panel X scenario described in Section 5.2.1.2 [of TEA, 2004] (Kanney et al. 2004, Table 12). TEA believes that uncertainties in the quantities of CPR [materials] present in a waste panel and in the extent to which [SO42-] reduction will occur are sufficiently great that the Agency-approved safety factor of 1.67 is the minimum that should be maintained…
TEA concludes that the aforementioned DOE study by Kanney et al. (2004) provides useful information but clearly demonstrates that reductions in the effect of methanogenesis due to the availability of natural [SO42-] can have a significant adverse effect on MgO safety factors. TEA also believes that not all potential sources for natural [SO42-] to enter the repository were considered in [the DOE’s analysis and that an acceptable bounding analysis has therefore not been performed...
Furthermore, U.S. EPA (2004, pp. 7-8) concluded that
[The] DOE’s analysis may be correct but uncertainties remain in the quantities of CPR [materials] present in a waste panel and in the extent to which sulfate reduction will occur. More [SO42-] may be present in the waste or waste area environment than currently estimated. More waste with high CPR may be placed in a panel than currently anticipated. Because of these uncertainties, [the] DOE needs to ensure that these uncertainties are accounted for in the calculation of the MgO safety factor, even if it appears that there is enough MgO for [PA] calculations.
Methanogenesis may not occur because of the presence of excess [SO42-] in the system, so MgO safety factor calculations need to assume all [C] could be converted to [CO2] until the Department provides adequate evidence that methanogenesis is the dominant process…
In March 2004, the EPA approved the DOE’s request to dispose of supercompacted waste in the WIPP (Marcinowski 2004; Trinity Engineering Associates 2004; U.S. Environmental Protection Agency 2004). As part of its approval, the EPA specified that the DOE maintain an MgO excess factor of 1.67, calculated assuming that there would be no microbial methanogenesis in the repository. The elimination of methanogenesis from consideration in WIPP PA is discussed in Leigh et al. (2005, Section 2.4) and Cotsworth (2005). In some cases, maintaining an excess factor of 1.67 has, in turn, required that the DOE emplace additional MgO in place of TRU waste (Section MgO-2.1.1). Therefore, the DOE continued to explore various possible approaches to support a PCR for EPA approval of a reduction in the MgO excess factor.
In 2005 and 2006, the Institute for Regulatory Science (RSI) of Alexandria, VA, reviewed the DOE’s use of MgO in the WIPP, especially the need to emplace additional MgO in rooms with supercompacted waste.
The RSI carries out studies; assesses regulatory actions; conducts peer reviews of studies by other organizations; and provides training and other services to federal, state, and local governments in the biological, chemical, health, and physical sciences, and in all areas of engineering. The RSI was established in 1985 and received nonprofit status in 1986. From 1989 until mid-1995, the RSI operated through the University of Maryland at Baltimore and Temple University in Philadelphia, PA. Since then, the RSI has operated as an independent organization. The RSI has a small in-house staff and utilizes individuals in other organizations, especially for peer reviews (Institute for Regulatory Science [RSI] 2008).
In 2005, the RSI assembled an expert panel chaired by Edward Abbott, Professor of Chemistry at Montana State University in Bozeman, MT. The other members of this panel were Gudmundur S. (“Bo”) Bodvarsson, Director of the Earth Sciences Division at Lawrence Berkeley National Laboratory in Berkeley, CA; R. Ian Miller, President of the GoldSim Technology Group, LLC, in Issaquah, WA; Dade W. Moeller, President of Dade Moeller and Associates, Inc., and Professor Emeritus at Harvard University in Cambridge, MA; and Richard Wilson, Mallinckrodt Research Professor of Physics at Harvard University. The GoldSim Technology Group, LLC, develops, maintains, and applies the GoldSim software package for decision analysis and PA calculations for radioactive waste repositories and other environmental studies. Dade Moeller and Associates provides services in the environmental and occupational sciences. A. Alan Moghissi, President of the RSI, oversaw the operation of the expert panel during its review. Sorin R. Straja, Vice President for Science and Technology of the RSI, served as the technical secretary for the expert panel.
The RSI expert panel met for two days in July 2005 in Carlsbad, NM. Several DOE and DOE-contractor personnel made detailed presentations to the panel on
1. The methodology used for WIPP PA
2. The history of engineered barriers in the WIPP disposal system, especially MgO
3. Aspects of WIPP chemistry and geochemistry related to MgO
4. Calculation of the MgO excess factor
5. Preliminary PA calculations pertinent to possible reductions in the amount of excess MgO emplaced in the repository
6. Possible approaches to support a PCR for EPA approval of a reduction in the MgO excess factor
The members of the panel prepared a summary of their initial impressions and identified issues to be addressed at the next meeting (Institute for Regulatory Science [RSI] 2006).
The RSI expert panel met again for two days in September 2005 in Albuquerque, NM. DOE and DOE contractor personnel responded to several issues raised during the first meeting of the panel, including the following:
1. The history of implementing and using MgO in the WIPP disposal system and its description in WIPP regulatory-compliance documents
2. MgO-related assumptions in WIPP PA
3. Issues that arose while scoping PA calculations for possible reductions in the amount of excess MgO
4. Issues pertinent to the availability of naturally occurring SO42- in and around the repository
5. Possible approaches to support a PCR for EPA approval of a reduction in the MgO excess factor
The panel also met in a closed session to discuss a possible PCR (Institute for Regulatory Science [RSI] 2006).
Subsequent to the September 2005 meeting, Abbott prepared a set of draft findings and recommendations, which were modified and included in Institute for Regulatory Science (RSI) 2006. At the same time, R. Patterson, D. Mercer, T. W. Thompson, and M. B. Gross assembled brief summaries of the WIPP disposal system and its use of MgO as the engineered barrier from previous WIPP regulatory-compliance documents; these summaries also appeared in Institute for Regulatory Science (RSI) 2006. The report of the expert panel also included excerpts from the EPA’s regulations related to natural and engineered barriers in the WIPP (Institute for Regulatory Science [RSI] 2006).
The RSI expert panel reported nine findings. The first three findings dealt with possible generation of CO2 from microbial consumption of CPR materials in the WIPP.
The first question posed to the panel (“Criterion 1”) was, “Is the assumption that cellulosic materials [in TRU waste] could be consumed by microbes, under conditions prevailing at WIPP, consistent with scientific and engineering principles, standards, and practices?” (Institute for Regulatory Science [RSI] 2006, p. 9).
In response to this question, the Institute for Regulatory Science (RSI) (2006, p. 9) found
The assumption that cellulosic materials [the RSI’s italics] could be consumed by microbes under conditions prevailing at WIPP is consistent with scientific and engineering principles, standards, and practices. Because a small portion of the material will be incorporated into the microbial biomass, biodegradation is unlikely to reach 100%. An extensive review by staff members … led to the conclusion that communities of halophilic, fermentative, and methanogenic are potentially capable of metabolizing cellulosic materials, under expected WIPP conditions.
The biodegradation of cellulosic materials could progress under at least two scenarios:
1. During the initial phases of emplacement of waste at WIPP when [O2] is available; and
2. As a consequence of human intrusion that resulted in brine reaching and interacting with the waste.
However, the RSI expert panel also agreed with two of the conclusions reached by the U.S. National Academy of Sciences’ Committee on the Waste Isolation Pilot Plant (National Research Council [NRC] Committee on the Waste Isolation Pilot Plant 1996 and 2001), which RSI (Institute for Regulatory Science [RSI] 2006, p. 9) stated as
Two committees of the National Research Council (NRC, 1996; 2001) came to the conclusion that
1. The biodegradation of cellulosic materials is expected to be minimal; but
2. For that portion that does undergo biodegradation, the rate is expected to be maximum during the pre-closure period.
Finally, the RSI expert panel stated that they “made no attempt to independently quantify the extent and rate of biodegradation of cellulosic materials” (Institute for Regulatory Science [RSI] 2006, p. 10).
The second question posed to the panel (“Criterion 2”) was, “Is the assumption that plastic materials … in TRU waste could be consumed by microbes, under conditions prevailing at WIPP, consistent with scientific and engineering principles, standards, and practices?” (Institute for Regulatory Science [RSI] 2006, p. 10).
In response, the Institute for Regulatory Science (RSI) (2006, pp. 10–11) found
The assumption that plastic materials [the RSI’s italics] will be completely metabolized by microbes under conditions prevailing at WIPP is not consistent with scientific and engineering principles, standards, and practices. However, partial metabolization of such materials is possible, but if it occurs at all, then its rate and extent of reaction is expected to be significantly lower than that for cellulosic materials. Under WIPP conditions, neither thermo-oxidation nor photo-oxidation can occur, and therefore the biodegradation of polymers, such as polyethylene, will be highly unlikely. It is of particular interest to note that, in its regulations [U.S. EPA, 1992a, p. 54,460; U.S. EPA, 1992b, p. 54,461], the EPA … defined the following polymers as nonbiodegradable:
· polyethylene,
· high density polyethylene (HDPE),
· polypropylene, polystyrene,
· polyurethane,
· polyacrylate,
· polynorborene,
· polyisobutylene,
· ground synthetic rubber,
· cross-linked allylstyrene,
· tertiary butyl copolymers.
The EPA regulations, cited above, which were developed as an outgrowth of experience with land disposal facilities, as well as laboratory studies, involved significant public participation.
The rate of biodegradation of a polymer depends on the mechanism of degradation; its structure; and the presence of the required microbial populations and environmental conditions that enhance their growth. Although the understanding of polymer degradation is limited, there is sufficient information indicating that critical parameters include oxygen, temperature, and water.
In recent years there has been an increasing recognition of a need to develop polymers that would be biodegradable. Through modifications, such as changing the chemical structure of certain plastic materials so as to initiate and accelerate the biodegradation process, this goal has been achieved. In fact, many polymers on the market today, that heretofore were considered not to be subject to biodegradation, are now degradable. However, the polymers likely to be disposed at WIPP are not expected to belong to the new classes of biodegradable polymers. In addition, any biodegradable polymers that may have been present in the initial TRU waste should have been biodegraded by the time it was disposed at WIPP.
On the basis of the information that was provided, the [RSI expert panel] concluded that the fraction of plastics that is expected to be biodegraded under the conditions existing within the WIPP is small. This conclusion is consistent with the assessment of the NRC (2001) and the regulatory decisions of the EPA. However, the [RSI expert panel] made no attempt to independently quantify the extent and the rate of biodegradation of plastic materials [the RSI’s italics].
The third question (“Criterion 3”) was, “Is the assumption that rubber materials will be consumed by microbes, under the conditions prevailing at WIPP, consistent with scientific and engineering principles, standards, and practices?” (Institute for Regulatory Science [RSI] 2006, p. 11).
The Institute for Regulatory Science (RSI) (2006, pp. 11–12) found
The assumption that commercial rubber materials [the RSI’s italics] will be completely metabolized by microbes, under conditions prevailing at WIPP, is not consistent with scientific and engineering principles, standards, and practices. The extent of biodegradation of rubber materials, if it occurs, is likely to be significantly lower than that for plastic materials, and very much less than that for cellulosic materials.
Raw natural rubber [the RSI’s italics] obtained from the latex of Hevea brasiliensis trees, contains more than 90% poly(cis-1,4-isoprene). The remaining constituents include proteins, lipids, carbohydrates, resins, and inorganic salts. Raw synthetic rubber [the RSI’s italics] consists essentially of poly(cis-1,4-isoprene) rubber with the addition of antioxidants to prevent ageing. The monomer units of natural rubber contain unsaturated bonds that are susceptible to thermo-oxidative degradation, attack by ozone, or degradation by [ultraviolet]-light. In contrast, the synthetic alternatives to the natural rubber can withstand elevated temperatures for long times even under relatively aggressive conditions. Commercial rubber (natural or synthetic) is usually vulcanized (crosslinked) by heating in the presence of sulfur. The lack of biodegradability of commercial rubber products is the consequence of inhibition of the oxidation process by antioxidants.
On the basis of the information that was provided, the [RSI expert panel] concluded that the fraction of rubber that is expected to be biodegraded under the conditions existing within the WIPP is small. The conclusion is consistent with the assessment of the NRC (2001) and the regulatory decisions of the EPA. However, the level and the rate of biodegradation of rubber materials [the RSI’s italics], as small as they may be, were not independently quantified by [the RSI expert panel].
The fourth finding of the RSI expert panel dealt with the performance of MgO in the WIPP. The fourth question (“Criterion 4”) was, “Under conditions prevailing at WIPP, is the assumption that all the MgO, as presently emplaced, will be available to react with CO2 consistent with scientific and engineering principles, standards, and practices?” (Institute for Regulatory Science [RSI] 2006, p. 12).
The Institute for Regulatory Science (RSI) (2006, pp. 12–13) found
Under conditions prevailing at WIPP, [the RSI expert panel] has concluded that the assumption that 100% of the MgO will be available to react with CO2 is not consistent with scientific and engineering principles, standards, and practices.
The processes that will occur in the emplacement rooms are very complex. They will involve the interplay of multiple processes, including the mechanical creep of the salt formation; the development of a gaseous phase consisting mostly of CO2; and the gradual inflow of brine from the surrounding saturated salt. These processes will likely result in a very heterogeneous hydrological and chemical environment within the emplacement rooms. Although hydrological and chemical gradients in the gas and liquid phases within the rooms will tend to equilibrate thermodynamic and chemical conditions, local pockets of unreacted MgO are likely to be present for long periods of time. For these reasons, the [RSI expert panel] believes that 100% reaction of the MgO with CO2 is not likely to occur. Nonetheless, the [RSI expert panel] has concluded that most of the MgO will be active in chemical reactions.
The fifth and sixth findings of the RSI expert panel involved the performance of the WIPP in the hypothetical absence of MgO. (The DOE has never requested that the EPA approve eliminating MgO from the WIPP, only that the EPA approve reducing the amount of excess MgO that the DOE must emplace.)
The fifth question (“Criterion 5”) was, “Assuming that only cellulosic materials are consumed by microbes, is it consistent with scientific and engineering principles, standards, and practices to conclude that, in the absence of MgO, the solubility of actinides will be such that releases to the accessible environment will still be below the EPA limits?” (Institute for Regulatory Science [RSI] 2006, p. 13).
The Institute for Regulatory Science (RSI) (2006, p. 13) found
“On the basis of the information received by the [RSI expert panel], it is likely that releases to the accessible environment will be below the EPA regulatory limits. However, the evidence received by the [RSI expert panel] is not sufficient to definitely support this conclusion.
The sixth question (“Criterion 6”) was, “Assuming that all cellulosic, plastic and rubber materials are consumed by microbes, is it consistent with scientific and engineering principles, standards, and practices to conclude that, in the absence of MgO, the solubility of the actinides will be such that releases to the accessible environment will still be below the EPA limits?” (Institute for Regulatory Science [RSI] 2006, p. 13).
The Institute for Regulatory Science (RSI) (2006, pp. 13–14) found
On the basis of the information received by the [RSI expert panel], it is likely that releases to the accessible environment will be below the EPA regulatory limits. However, the evidence received by the [RSI expert panel] is not sufficient to definitely support this conclusion.
The seventh criterion and finding dealt with the application of “acceptable knowledge” to the characterization of the concentrations of CPR materials in TRU waste, and will not be discussed herein.
The eighth question (“Criterion 8”) was, “Is the requirement to emplace a 67% MgO excess consistent with as low as reasonably achievable (ALARA) scientific and engineering principles, standards, and practices? Is the associated increased and real risk to the affected workers and the general public imposed by this requirement offset by the potentially reduced risk to future generations?” (Institute for Regulatory Science [RSI] 2006, p. 15).
The Institute for Regulatory Science (RSI) (2006, p. 15) found
In reference to Finding 4, the [RSI expert panel] has concluded that most of the MgO will be available for chemical reaction. In reference to Findings 1-3, the [RSI expert panel] has concluded that only a small fraction of the CPR materials is likely to be biodegraded to produce CO2. In reference to Findings 5-6, the [RSI expert panel] believed that it is likely that the EPA release standards would be met, even if the amount of MgO is less than the quantity required to consume all the CO2 produced. Therefore, the [RSI expert panel] concludes that 67% MgO excess (i.e., 67% in excess of the stoichiometric quantity required assuming complete biodegradation of CPR materials to CO2) is not necessary.
The ninth criterion and finding dealt with whether it would be reasonable for the DOE to convene another expert panel to “reach a consensus on the potential extent of consumption of various components of CPR materials” and, if so, if other issues should be considered. The RSI expert panel’s response to this criterion is included below in the discussion of its recommendations.
The Institute for Regulatory Science (RSI) (2006, p. 16) made two recommendations:
1. The DOE should consider convening an Expert Elicitation Panel to provide a more realistic and accurate estimate of the potential extent of biodegradation of various components of CPR materials likely to be emplaced in the WIPP.
2. The DOE should consider performing a single-room realistic analysis of the complex processes involved, including gas generation, chemical reactions, biodegradation, and mechanical creep.
In its ninth finding, the RSI expert panel recommended that, in addition to providing “more realistic and accurate estimate[s]” of the fractions of the CPR materials that would be consumed by microbial activity in the WIPP, the expert elicitation panel should also estimate the “fraction of the emplaced MgO [that] is likely to react with the CO2” and “the performance consequences of a partial or complete shortfall in MgO buffering capacity” (Institute for Regulatory Science [RSI] 2006, p. 16).
The RSI expert panel did not provide any details on how the DOE should perform “a single-room realistic analysis of the complex processes involved” in the WIPP.
In April 2006, the DOE submitted a PCR for EPA approval of reducing the MgO excess factor from 1.67 to 1.2 (Moody 2006). To justify its request, the DOE used reasoned arguments regarding health-related transportation risks to the public, the cost of emplacing MgO, and the uncertainties inherent in predicting the extent of microbial consumption of CPR materials during the 10,000-year WIPP regulatory period.
The EPA responded by requesting that the “DOE needs to address the uncertainties related to MgO effectiveness, the size of the uncertainties, and the potential impact of the uncertainties on long-term performance” (Gitlin 2006). In particular, the EPA instructed the DOE to identify all of the uncertainties related to the calculation of the MgO excess factor, and quantify these uncertainties, if possible.
As the DOE began to address the uncertainties related to the MgO excess factor, S. Cohen and Associates (SCA) carried out a review of the possible consumption of CPR materials in the WIPP for the EPA (S. Cohen and Associates 2006). The objectives of this report were the following:
[T]o identify specific technical questions that must be answered and uncertainties that must be addressed before EPA can consider changing the amounts of MgO backfill that must be placed in the repository to maintain the effectiveness of the engineered barrier. Therefore, a preliminary review of the available data relevant to a number of issues related to the MgO backfill was carried out. This review included chemistry-related issues such as the potential CO2-generating microbial degradation reactions that could occur within the repository, the extent to which these reactions could occur, and the reactivity of MgO in the repository environment. These issues were addressed by consulting the available scientific literature, including data generated by the WIPP program and a survey of other relevant information. The possibility of conducting experiments to better define the reaction rates and possible extent of the microbial degradation reactions was also considered. Regulatory requirements related to engineered barriers in the WIPP and ways in which uncertainties must be addressed were evaluated as well, and are summarized in this report [SCA, 2006, pp. 1-1 to 1-2].
In addition, the SCA report (S. Cohen and Associates 2006) responded to the findings and recommendations of the RSI expert panel, and to its assessment of the EPA regulations relevant to MgO.
In its first three findings, the RSI expert panel stated that “[t]he assumption that cellulosic materials could be consumed by microbes under conditions prevailing at WIPP is consistent with scientific and engineering principles, standards, and practices” (Institute for Regulatory Science [RSI] 2006, p. 9), but that the fraction of plastic and rubber materials “that is expected to be biodegraded under the conditions existing within the WIPP is small” (Institute for Regulatory Science [RSI] 2006, pp. 11 and 12). With regard to the RSI expert panel’s first three findings, SCA (S. Cohen and Associates 2006, p. 4-2) stated
The rates and extent of CPR degradation during the 10,000-year WIPP regulatory period are likely to be influenced by the following:
· Composition of the CPR materials
· Microbial population
· Chemical and physical environment, including the quantity and salinity of the repository brines, redox conditions, pH, and temperature
· Radiation dose to the CPR materials and associated brines
· Interactions of different processes.
SCA (S. Cohen and Associates 2006, pp. 4-2 through 4-8) reviewed some of the literature pertaining to these factors. SCA described its review as “preliminary.” It then reviewed results obtained by the WIPP project and results in the literature pertaining to the possible microbial consumption of CPR materials (S. Cohen and Associates 2006, pp. 4-8 through 4-18).
With regard to the possible extent of microbial consumption of cellulosic materials in the WIPP, SCA (S. Cohen and Associates 2006, pp. 4-11 through 4-12) stated
A number of factors contribute to the high likelihood that cellulosics will be completely degraded in the WIPP repository. These factors include the variety of microorganisms that can degrade cellulosic materials, the general adaptability of microbes to their environment and available [C] sources, the abundant [SO42-] in the repository, and the long regulatory time period.
Although relatively little data appear to be available regarding the chemical effects of radiation on cellulose, it appears low-level radiation may decrease polymer chain length and alter physical and chemical properties of cellulose. It is expected that radiation-induced degradation of cellulose in the WIPP will occur through direct and indirect interaction with ionizing radiation from radionuclides in the waste. The direct interactions, which are interactions of the ionizing radiation with the solid cellulose, initiate scissions on the backbone of the molecules leading to degradation; however, a very small yield of branching also can occur. The presence of oxygen in the repository environment is not required for these scission reactions. Indirect interactions will occur through the radiolysis of water. As mentioned above in Section 4.1.4, the radiolysis of water produces hydroxyl radicals (•OH). Hydroxyl radicals can cause hydrolytic cleavage of glycoside linkages in cellulose, which would be expected to facilitate microbial degradation.
Although some radiation-induced effects could act to limit cellulose biodegradation, on balance, the overall effects of radiation on cellulose appear to increase the likelihood of microbial degradation of cellulose through cleavage of the polymer backbone and decreased molecular weight. The available literature appears to indicate that microbial and radiation-induced degradation of cellulosics may proceed virtually to completion over 10,000 years if water is present in the WIPP repository.
With regard to the possible extent of microbial consumption of plastic materials, SCA (S. Cohen and Associates 2006, p. 4-15) stated
Literature data are available regarding both microbial degradation and radiation-induced degradation of plastics such as polyethylene and [polyvinylchloride]. Microbial degradation of plastics generally is less extensive in the short term than microbial degradation of cellulosic materials, based on the data identified in the literature. Radiolytic processes may degrade plastics directly, and also may indirectly contribute to the long-term biodegradability of plastics by altering their chemical and physical properties. The likelihood of significant radiolytic effects on plastics degradation would depend on the dose. The dose to WIPP waste can be calculated from the DOE’s inventory projections (Leigh and Trone 2005). The presence of oxygen in the repository before closure and for a period of time after closure could affect both radiolytic and microbial processes. This preliminary evaluation of the data indicates that plastic degradation may occur over 10,000 years in the WIPP repository.
SCA (S. Cohen and Associates 2006, pp. 3-4 through 3-6) also responded to the RSI expert panel’s statement in its second finding (Institute for Regulatory Science [RSI] 2006, pp. 10–11) that the EPA had defined polymers such as polyethylene, HDPE, and polypropylene as nonbiodegradable:
RSI (2006) cited EPA’s RCRA [Resource Conservation and Recovery Act] regulations at 40 CFR 264.314 and 40 CFR 265.314 to support the contention that ‘the fraction of plastics that is expected to be biodegraded under conditions existing within the WIPP is small’ (Finding 2). For example, 40 CFR 264.314 lists a number of high molecular weight polymers, such as polyethylene, polypropylene, and ground synthetic rubber, as non-biodegradable sorbents to sequester free liquids prior to disposal in surface hazardous landfills. EPA has listed in its Federal Register notice ‘Final Rule Regarding Liquids in Hazardous Waste Landfills’ [U.S. EPA, 1992a; 1992b] on November 18, 1992, of certain high-density polymers as non-biodegradable sorbents in RCRA landfills. The Federal Register notice did not, however, provide any background information supporting the contention that such high molecular weight polymers were non-biodegradable. The Agency merely stated that such materials ‘have proved to be highly resistant to biodegradation.’ In an earlier Federal Register notice of June 1987, when EPA first proposed the use of high-molecular weight polymers as nonbiodegradable sorbents, the notice stated the following [U.S. EPA, 1987, p. 23,696]:
[T]he Agency now believes that a different criterion should be used to determine if an organic polymer is biodegradable. The Agency proposes to determine this alternative criterion by using tests which involve incubating the absorbent materials with prepared stock cultures of various microorganisms under ideal conditions for their growth. This incubation demonstrates the fungal resistance of polymers and is used by the American Society for … Testing [and] Materials laboratory test ASTM Method G21-70… [SCA’s italics].
The relevance of the fact that certain plastics and rubbers are defined as non-biodegradable for use as sorbents in RCRA surface landfills to the assumption that such materials are nonbiodegradable in the context of the WIPP environment is questionable based on the following considerations:
· Under 40 CFR 264.117, post-closure monitoring is limited to 30 years unless extended by the EPA Regional Administrator, while at the WIPP, regulatory compliance must be demonstrated through PA for 10,000 years.
· Under 40 CFR 264.314, EPA offers three tests to demonstrate that materials not specifically listed as non-biodegradable sorbents in §264.314(e)(1)(i) and (ii) can be used as non-biodegradable sorbents. Two of the tests are American Society for Testing and Materials (ASTM) procedures and one is an Organisation for Economic Co-operation and Development (OECD) procedure. In 1995, EPA decided to add the OECD test to §264.314(e)(2) as described in its Federal Register notice [U.S. EPA, 1995]. In the Federal Register notice, EPA noted that:
[T]he OECD [T]est 301B is a test for biodegradability in an aerobic environment, as are the two ASTM tests that were promulgated in the November 18, 1992 rule. The Agency also recognizes that the actual environment in which the sorbents will be used, i.e., in a container in a landfill, will be anaerobic. The Agency does not know, however, of any published widely accepted tests for the biodegradability of materials in anaerobic conditions that would be practical for purposes of this rule. The Agency believes, however, that OECD 301B is an acceptable surrogate for determining if a sorbent will biodegrade in containerized liquids in a hazardous waste landfill [SCA’s italics].
· The environment in the WIPP will become anaerobic shortly after closure and will remain so throughout the regulatory period. Therefore, the assumption that high molecular weight polymers will not biodegrade may not be valid at WIPP.
· While materials may be judged functionally as non-biodegradable sorbents in RCRA surface landfills, they can achieve that functionality even if limited biodegradation actually occurs. In the WIPP, on the other hand, at least one mol of MgO backfill must be provided for each mol of CO2 generated from CPR decomposition. This places a greater burden on defining quantitatively the extent to which biodegradation occurs at the WIPP.
The Resource Conservation and Recovery Act (RCRA) definition of some plastic sorbents as nonbiodegradable is based mainly on observations over relatively short time frames and testing in aerobic environments. These conditions do not appear relevant to the long-term WIPP environment or regulatory period of performance. Therefore, the RCRA definition of some plastic sorbents as nonbiodegradable appears to have essentially no relevance to the determination of whether plastic and rubber materials are likely to be substantially biodegraded in the WIPP repository.
With respect to the possible extent of microbial consumption of rubber materials, SCA (S. Cohen and Associates 2006, p. 4-18) stated
Available WIPP and literature data indicate that rubber materials likely to be present in the WIPP repository will be partially degraded by microbes. Radiation appears to affect both the physical and chemical properties of rubber, and in WIPP experiments appeared to enhance microbial degradation. The presence of oxygen in the repository before closure and immediately after closure could affect the physical and chemical properties of the rubber. This preliminary evaluation of the data indicates that rubber degradation may occur over 10,000 years in the WIPP repository.
The RSI expert panel’s fourth finding was that, “100% reaction of the MgO with CO2 is not likely to occur. Nonetheless … most of the MgO will be active in chemical reactions” (Institute for Regulatory Science [RSI] 2006, p. 13). SCA (S. Cohen and Associates 2006, p. 5-1) agreed with this finding:
Review of the available information related to MgO reactivity indicates that MgO is likely to react in the repository to control CO2 concentrations in the brine. However, it is possible that a small fraction of the MgO could become unavailable for reaction because of physical segregation. This relatively small source of uncertainty has been adequately accounted for by using an MgO safety factor greater than one.
With regard to the RSI expert panel’s fourth finding, SCA (S. Cohen and Associates 2006, p. 6-1) also stated
[T]he MgO backfill is likely to perform as designed and control brine pH and CO2 concentrations in the repository. Incomplete reaction of the MgO with brine and CO2 is unlikely to occur unless the MgO is physically segregated from the brine or CO2; if such physical segregation should occur, the effective MgO safety factor would be decreased by a commensurate amount. The recent changes in MgO placement methods, with a constant safety factor calculated for each disposal room, limit the potential effects of inhomogeneous distribution of CPR in the waste, and are likely to minimize the uncertainties associated with possible physical segregation of the MgO from brine and CO2. However, the small remaining uncertainty related to physical segregation should be addressed by the MgO safety factor.
The RSI expert panel’s fifth and sixth findings, which responded to the question, “Assuming that only cellulosic materials [or all of the CPR materials] are consumed by microbes, is it consistent with scientific and engineering principles, standards, and practices to conclude that, in the absence of MgO, the solubility of actinides will be such that releases to the accessible environment will still be below the EPA limits?” (Institute for Regulatory Science [RSI] 2006, p. 13), were that: “On the basis of the information received by the [RSI expert panel], it is likely that releases to the accessible environment will be below the EPA regulatory limits. However, the evidence received by the [RSI expert panel] is not sufficient to definitely support this conclusion” (Institute for Regulatory Science [RSI] 2006, pp. 13–14).
SCA did not specifically address whether, in the absence of MgO, the WIPP would continue to meet the EPA’s containment requirements, given microbial consumption of cellulosic materials, or microbial consumption of all of the CPR materials. However, SCA (S. Cohen and Associates 2006, p. 3-4) stated
The use of at least one engineered barrier at WIPP is required by 40 CFR 194.44 to ‘prevent or substantially delay the movement of water or radionuclides toward the accessible environment.’ For the CCA, DOE identified and EPA approved MgO backfill in the disposal rooms as the only WIPP engineered barrier (DOE 1996[b]). MgO backfill was designed to maintain alkaline pH and mitigate the effects of CO2 generation in the disposal rooms, thereby controlling actinide solubilities in intruding brines ([U.S.] EPA 1997). The inclusion of MgO backfill as an engineered barrier remained unchanged for the CRA, although the required safety factor and backfill emplacement strategy have changed since the CCA….
Furthermore, in response to a recommendation by the NRC (2001) that “The committee recommends that the net benefit of MgO used as backfill be reevaluated. The option to discontinue emplacement of MgO should be considered,” SCA (S. Cohen and Associates 2006, p. 3-1) stated that
Removing the MgO backfill from the repository design will likely affect predictions of gas generation and actinide solubilities. Additional information would be necessary before EPA could consider elimination of, or significant modifications to, the MgO backfill. EPA regulations require assurance requirements (40 CFR 191.14), including an engineered barrier, to compensate for uncertainties in the prediction of future repository performance and provide increased confidence in the disposal system. The MgO backfill is the only engineered barrier in the WIPP repository and an engineered barrier is required by regulation….
The RSI expert panel’s seventh finding, which dealt with the application of “acceptable knowledge” to the characterization of the concentrations of CPR materials in TRU waste, and SCA’s response to this finding are not discussed herein.
In its eighth finding, the RSI expert panel stated that “[a] 67% MgO … is not necessary” (Institute for Regulatory Science [RSI] 2006, p. 15). SCA (S. Cohen and Associates 2006, p. 5-1) responded by stating that
In the original certification review (EPA 1997), EPA accepted MgO as the only engineered barrier (40 CFR 194.44). This acceptance was predicated on the assumption that MgO was necessary to control chemical conditions in disposal rooms. [U.S.] EPA (1997) also stated that excess MgO, i.e., the MgO safety factor, was a conservative measure, an assurance requirement, necessary to overcome the uncertainty associated with predicting the expected future(s) of the WIPP disposal system. The engineered barrier is of critical importance because of a number of uncertainties associated with repository performance over the long regulatory time period. Assuming that all CPR [C] could be converted to CO2 was a conservative assumption associated with the engineered barrier’s performance. If this conservative assumption is no longer included in the determination of the MgO safety factor, the potential significance of other uncertainties would increase, such as those related to CPR inventory, CPR degradation rates and extents, and the possible physical segregation of small amounts of MgO. The MgO safety factor must account for these uncertainties in the absence of conservative assumptions regarding the extent of CPR degradation to form CO2. Because of the importance of the MgO backfill, an understanding of the potential effects of a shortfall would be necessary before the technical feasibility of significantly reducing the MgO safety factor could be assessed.
In its summary and conclusions, SCA listed “a number of potential technical issues … related to whether the amount of MgO placed in the repository can be reduced without affecting repository safety” (S. Cohen and Associates 2006, p. 6-1). These included (1) the availability of MgO, which could be reduced by the possible physical segregation of small quantities of MgO from brine; (2) uncertainties in the quantities of CPR materials in the inventory; and (3) the extent of microbial consumption of CPR materials during the 10,000-year regulatory period.
SCA (S. Cohen and Associates 2006, pp. 6-1 to 6-2) also identified several issues that could affect the possible extent of microbial consumption of CPR materials. These included the following:
1. The adaptability of microbes to different substrates and environments
2. The short-term effects of microbial consumption of CPR materials by aerobic bacteria and fungi
3. The short-term effects of a radiolysis of CPR materials (i.e., radiolysis under oxic conditions) on the biodegradability of these materials
4. The length of time that molecular oxygen (O2) will be present
5. The long-term effects of a radiolysis of CPR materials (i.e., radiolysis under anoxic conditions) on the biodegradability of these materials
6. The long-term, integrated radiation dose to CPR materials
7. Uncertainties associated with the predicted availability of brine in the repository
In its ninth finding and its first recommendation, the RSI expert panel stated that (1) “[t]he DOE should consider convening an Expert Elicitation Panel to provide a more realistic and accurate estimate of the potential extent of biodegradation of various components of CPR materials likely to be emplaced in the WIPP”; (2) the Expert Elicitation Panel should estimate the “fraction of the emplaced MgO [that] is likely to react with the CO2”; and (3) that the Expert Elicitation Panel should estimate “the performance consequences of a partial or complete shortfall in MgO buffering capacity” (Institute for Regulatory Science [RSI] 2006, p. 16). SCA (S. Cohen and Associates 2006, p. 3-4), responded
Requirements related to the elicitation of expert judgment for use in compliance applications are provided in 40 CFR 194.26. With regard to the circumstances under which expert judgment can be used for compliance applications, the regulation states [40 CFR 194.26(a)]:
Expert judgment, by an individual expert or panel of experts, may be used to support any compliance application, provided that expert judgment does not substitute for information that could reasonably be obtained through data collection or experimentation [SCA’s italics].
In its summary and conclusions, SCA (S. Cohen and Associates 2006, pp. 6-2 through 6-3) went on to describe the “information that could reasonably be obtained through data collection or experimentation” with regard to the possible extent of microbial consumption of CPR materials:
The results of the preliminary review described in this report indicate that cellulosics may be completely degraded in the repository environment over the 10,000-year regulatory period. The preliminary review of information regarding the possible extent of plastics and rubber degradation in the repository is less conclusive; therefore, additional literature review and experimental investigations may be necessary to determine the likely extent of radiolytic and microbial degradation of plastics and rubber during the 10,000-year regulatory period. Processes likely to affect waste during use, storage, transport, and the early disposal period include degradation by aerobic bacteria and fungi, and radiolysis in the presence of [O2]. Estimation of the length of time [O2] will persist in the repository and the radiation doses to waste could be used to determine the likely effects of these processes. Although these processes may not significantly affect short-term rates and extents of degradation of CPR, their effects could influence mechanisms, rates, and extents of CPR degradation over the long WIPP regulatory time period. The available literature should be reviewed to determine whether these early degradation processes and long-term radiolysis under anaerobic conditions are likely to make CPR more susceptible to microbial degradation in the longer-term anaerobic WIPP environment.
Any assessment of the extents of degradation of CPR should include an estimation of associated uncertainties, which should be incorporated in the MgO safety factor. These estimated uncertainties should reflect all possible physical and chemical processes that might occur over 10,000 years including:
· The adaptability of microbes to different substrates and environments
· Potential physical segregation of small quantities of MgO from brine
· CPR inventory uncertainties
· Effects of short-term aerobic radiolysis and biodegradation reactions on long-term microbial degradation of CPR
· Effects of long-term anaerobic radiolytic processes on CPR biodegradation
· Uncertainties associated with the predicted availability of brine in the repository
EPA regulations require that expert judgment should not be substituted for available experimental data or data that could be obtained from a reasonable set of experiments (40 CFR 194.26). The results of this review have indicated that literature describing experimental data is available that might be used to reduce the uncertainties associated with the extent of CPR degradation in the WIPP repository and improve understanding of WIPP’s future performance. Consequently, use of expert judgment to assess the likely extents of CPR degradation in the WIPP repository may not be justified at this time and would require adequate justification by DOE. If the use of expert judgment is justified, this judgment should include not only the likely extents of CPR degradation, but also the associated uncertainties, taking into account the factors listed above.
A more extensive evaluation of the available WIPP and non-WIPP literature should be carried out to determine whether the data are sufficient for estimating the likely extent of CPR degradation during the 10,000-year regulatory period, or whether experiments might be designed to determine the probable extents of degradation of the various materials over this long regulatory time period. The goal of the literature review and experimental studies would be to adequately quantify or capture system uncertainties, including both the uncertainties associated with the quantities of CPR in the repository and the chemical uncertainties related to the CPR degradation reactions and reactions of the MgO backfill. Sufficient excess MgO (an adequate safety factor) needs to be emplaced in each disposal room to compensate for the range of uncertainties related to CPR degradation and the effective performance of the MgO engineered barrier, thereby ensuring WIPP’s expected safe performance in the future.
Finally, SCA noted that the RSI expert panel recommended that “[t]he DOE should consider performing a single-room realistic analysis of the complex processes involved, including gas generation, chemical reactions, biodegradation, and mechanical creep” (Institute for Regulatory Science [RSI] 2006, p. 16). However, SCA did not comment on this recommendation.
The DOE carried out an analysis (Vugrin, Nemer, and Wagner 2006) and several supporting analyses (Brush and Roselle 2006; Brush et al. 2006; Clayton and Nemer 2006; Deng et al. 2006; Kanney and Vugrin 2006; Kirchner and Vugrin 2006) to respond to the EPA’s request for additional information on “the uncertainties related to MgO effectiveness, the size of the uncertainties, and the potential impact of the uncertainties on long-term performance” (Gitlin 2006).
Vugrin, Nemer, and Wagner (2006, p. 2) defined the MgO effective excess factor as “a quantity that incorporates uncertainties into the current definition of the MgO excess factor.” The results of the supporting analyses cited above were used to quantify these uncertainties whenever possible and incorporate them in the effective excess factor.
Vugrin, Nemer, and Wagner (2006, p. 8) recognized four categories of uncertainties that could affect the MgO effective excess factor:
1. Uncertainties in the quantities of CPR materials that will be consumed during the 10,000-year WIPP regulatory period
2. Uncertainties in the number of moles of CO2 produced per mole of organic C in CPR materials (i.e., the CO2 yield)
3. Uncertainties in the quantity of MgO that will be available to consume CO2
4. Uncertainties in the number of moles of CO2 consumed per mole of available MgO
Although Vugrin, Nemer, and Wagner (2006, Appendix A) reviewed previous discussions of the uncertainties inherent in predicting the extent of microbial consumption of CPR materials in 10,000 years (Brush 1995; Gillow and Francis 2003; Brush 2004; the CRA-2004, Appendix BARRIERS), they did not attempt to incorporate them in the MgO effective excess factor. Therefore, they used the conservative assumption that microbes will consume 100% of the CPR materials to calculate the MgO effective excess factor.
Vugrin, Nemer, and Wagner (2006, Section 4) included two sources of the uncertainties inherent in predicting the CO2 yield per mole of organic C in CPR materials: (1) uncertainty in the quantities of CPR materials emplaced in WIPP disposal rooms, and (2) uncertainty as to the microbial respiratory pathways involved in consumption of the CPR materials (see Section MgO-6.1).
Kirchner and Vugrin (2006) quantified the uncertainties in the estimates of the quantities of CPR materials emplaced in WIPP disposal rooms. Their analysis was based on the differences between the masses of CPR materials measured by real-time radiography (RTR) and visual examination (VE), paired by waste container. They assumed that the VE measurements were the more accurate values and, because they observed no significant bias in the RTR measurements, that the sum of the RTR measurements best estimate the true value of the CPR material quantity in a room. Kirchner and Vugrin (2006) then used Monte Carlo methods “to simulate potential errors in the RTR measurements and to construct a distribution representing the uncertainty in the … CPR [materials] in a room” and concluded “that the uncertainty [standard deviation] on the total mass of CPR [materials] in a room would be less than 0.3%.” See Kirchner and Vugrin (2006) for a detailed explanation of this analysis, and Vugrin, Nemer, and Wagner (2006) for an explanation of how the results were incorporated in the MgO effective excess factor.
Vugrin, Nemer, and Wagner (2006) reviewed previous discussions on the effects of microbial respiratory pathways on the CO2 yield per mole of organic C in CPR materials (Wang and Brush 1996a; Snider 2003d; and Section MgO-6.1). However, Vugrin, Nemer, and Wagner (2006) did not include the effects of possible methanogenesis on the CO2 yield, because the EPA concluded that Kanney et al. (2004) did not adequately bound the quantity of naturally occurring SO42- that could enter WIPP disposal rooms (TEA 2004, pp. 31-33; U.S. EPA 2004, pp. 7-8) and specified that methanogenesis not be included in PA. Therefore, Vugrin, Nemer, and Wagner (2006) included only denitrification and SO42- reduction in their analysis. They calculated that microbes would consume 4.89 mol % of the organic C in the CPR materials in the CRA-2004 PABC inventory via denitrification and 0.84 mol % via SO42- reduction using SO42- in the waste (Vugrin, Nemer, and Wagner 2006, p. 11). The remainder of the organic C, 94.27 mol %, would be consumed via SO42- reduction using naturally occurring SO42-.
Vugrin, Nemer, and Wagner (2006) quantified the effects of the source of SO42- on the MgO effective excess factor. There are three potential sources of SO42- for microbial consumption of CPR materials via SO42- reduction: (1) SO42- in the waste; (2) SO42- dissolved in Salado or Castile brines; and (3) SO42- contained in DRZ minerals such as anhydrite, gypsum, or polyhalite. Microbes would consume 0.84 mol % of the organic C in the CPR materials in the CRA-2004 PABC inventory via SO42- reduction using SO42- in the waste, and produce CO2 with a yield of 1 mol per mol of organic C consumed. The CO2 yield from the SO42- dissolved in WIPP brines would be 1 mol per mol of organic C consumed (see below), but the amount of organic C in the CPR materials that would be consumed via SO42- reduction using SO42- in brines had never been calculated. Furthermore, neither the amount of organic C in the CPR materials that would be consumed via SO42- reduction using SO42- in DRZ minerals nor the CO2 yield from this process had previously been calculated.
Therefore, Clayton and Nemer (2006) calculated the quantities of dissolved SO42- that could enter the repository in brine, and Brush et al. (2006) calculated the CO2 yield from microbial consumption of CPR materials via SO42- reduction using DRZ minerals. The analysis of Clayton and Nemer will be described first because Vugrin, Nemer, and Wagner (2006) assumed that microbes would use SO42- from the waste and brine before using the SO42- from DRZ minerals. This assumption was conservative because SO42- reduction with SO42- from the waste and brine would have a higher CO2yield than SO42- reduction using SO42- from DRZ minerals (see below).
Clayton and Nemer (2006) determined at the outset of their analysis that it was conservative to assume that Salado brine will not be a significant source of SO42- for microbial consumption of CPR materials. Microbial SO42- reduction produces 2 mol of CO2 per mol of SO42- consumed (see Equation MgO.14 in Section MgO-6.1). For every mol of SO42- dissolved in GWB, there are about 5.76 mol of dissolved Mg before equilibration with the solids in WIPP disposal rooms (Section MgO-5.1) and 2.54 mol of dissolved Mg after equilibration with these solids (Table MgO-6). Therefore, GWB will always contain enough dissolved Mg to consume all of the CO2that would be produced via SO42- reduction using the SO42- dissolved in this brine.
Clayton and Nemer (2006) then established a probability distribution for the quantities of SO42- dissolved in Castile brines that could enter a panel during the 10,000-year regulatory period. They used a Monte Carlo simulation to generate 1,000 possible human-intrusion (drilling) futures. Each of these futures consisted of possible intrusion sequences into all 10 panels of the repository. For each future, they identified the “worst-case” panel: the panel with the most boreholes that intersected a Castile brine reservoir and hence the largest volume of Castile brine in that future. Clayton and Nemer (2006) then used the results from the BRAGFLO calculations for the CRA-2004 PABC (Nemer and Stein 2005) to calculate a probability distribution of the quantities of SO42- that could enter a panel from a single intrusion that penetrated a Castile brine reservoir. Finally, Clayton and Nemer (2006) combined the uncertainties in the drilling futures with those in the quantities of Castile-brine SO42- from a single intrusion to create a probability distribution of the quantities of SO42- that could enter the worst-case panel in 10,000 years. Clayton and Nemer (2006, Figure 1) obtained a complementary cumulative distribution function (CCDF) for the quantities of Castile SO42- that could enter a panel in 10,000 years. The mean value of this CCDF was consumption of 2.4 mol % of the organic C in CPR materials via SO42- reduction using Castile-brine SO42-, with a standard deviation of 5.1 mol %. The mean value was small because almost 30% of the drilling futures did not have intrusions that penetrated a brine reservoir and thus did not have any Castile-brine SO42-. Vugrin, Nemer, and Wagner (2006) incorporated these values into the MgO effective excess factor.
Brush et al. (2006) calculated the CO2 yield from microbial consumption of CPR materials via SO42- reduction using DRZ minerals. If microbes consume all the SO42- in the waste and in brines that enter WIPP disposal rooms, the resulting concentration gradient from the intergranular brines in the DRZ to the brine(s) in the repository would drive diffusive transport of SO42- from the DRZ through saturated voids to the waste. This would in turn decrease the SO42- concentration in the brines in the DRZ, which would lead to the dissolution of SO42--bearing minerals such as anhydrite, gypsum, and polyhalite present in both the marker beds and the nearly pure halites in the Salado (Stein 1985). Because all of these SO42--bearing minerals also contain Ca, dissolution of these minerals would release Ca2+ to these intergranular brines and (after transport) to the repository. This Ca2+ would remove CO2 from both the aqueous and gaseous phases by precipitating it as minerals such as calcite (CaCO3); metastable polymorphs of calcite like aragonite, vaterite, or ikaite; monohydrocalcite (CaCO3·H2O), amorphous CaCO3 (CaCO3(amorphous [am])), or pirssonite (Na2Ca(CO3)2·2H2O). Consumption of CO2 by precipitation of CaCO3-bearing minerals would reduce the amount of MgO that must be emplaced, thus impacting the calculation of the MgO effective excess factor.
Brush et al. (2006) used the reaction-path code EQ6 (Wolery and Daveler 1992), part of the EQ3/6 geochemical software package (Daveler and Wolery 1992; Wolery 1992a and 1992b), to simulate the precipitation of CaCO3-bearing minerals via the process described above. Brush et al. (2006) quantified the sensitivity of the CO2 yield to factors such as
1. The initial brine composition and the brine volume
2. Whether carbonation of brucite produces hydromagnesite (5424) or magnesite
3. The effects of organic ligands
4. The effects of precipitation of CaCO3(am) instead of calcite
They assumed that microbes will consume all of the CPR materials in WIPP disposal rooms, and calculated that microbes would consume 4.89 mol % of the organic C in the CPR materials in the CRA-2004 PABC inventory via denitrification using NO3- in the waste and produce CO2 with a yield of 1 mol per mol of organic C consumed; 0.84 mol % of the organic C via SO42- reduction using SO42- in the waste with a yield of 1 mol of CO2 per mol of organic C; and 94.27 mol % of the organic C via SO42- reduction using SO42- from DRZ minerals. Brush et al. (2006) did not include any SO42- reduction using Castile-brine SO42- because this was an uncertain parameter, the effects of which were incorporated later by Vugrin, Nemer, and Wagner (2006).
Brush et al. (2006) calculated that the effective CO2 yield from SO42- reduction using SO42- from DRZ minerals would be 0.54-0.60 mol per mol of organic C in the CPR materials consumed. The overall CO2 yield, which included denitrification and SO42- reduction using SO42- from the waste, but not Castile-brine SO42-, would be 0.57-0.62 mol per mol of organic C.
A potential concern evaluated by Brush et al. (2006) is that certain elements or compounds in WIPP disposal rooms could inhibit or even prevent calcite precipitation. Dissolved Mg, for example, could inhibit or prevent the precipitation of calcite, depending on its concentration. However, the literature reviewed for this analysis suggested that if an element or compound inhibits or prevents the precipitation of one CaCO3-bearing mineral, another, less-stable CaCO3-bearing mineral precipitates instead. Thus, if dissolved Mg inhibits or prevents the formation of calcite, aragonite would precipitate (Fernández-Diáz et al. 1996), possibly with coprecipitation of as much as 20% MgCO3 in addition to CaCO3 (Morse 1983). The most important point, however, is that if precipitation of CaCO3-bearing minerals were prevented, microbial SO42- reduction would cease after the consumption of 4.89 mol % of the organic C in the CPR materials in the CRA-2004 PABC inventory via denitrification, 0.84 mol % via SO42- reduction using SO42- in the waste, and 2.4 mol % via SO42- reduction using Castile-brine SO42-. Any additional consumption of CPR materials could only occur via methanogenesis, which has a CO2 yield of 0.5 mol per mol of organic C consumed. This is because failure of CaCO3 to precipitate would prevent additional dissolution of SO42--bearing minerals and result in rapid microbial depletion of SO42-.
Vugrin, Nemer, and Wagner (2006) accounted for the possibility of magnesian calcite formation in the WIPP by conservatively assuming that any CO2 not consumed by hydromagnesite (5424) or magnesite in the simulations of Brush et al. (2006) would be incorporated in a solid solution or two-phase mixture with the composition Mg0.22Ca0.78CO3, rather than a polymorph of CaCO3 or pirssonite as predicted by EQ6. Magnesian calcite with the composition Mg0.22Ca0.78CO3 (Meldrum and Hyde 2001) was the most Mg-rich calcite that Brush et al. (2006) found, if dissolved SO42- were present, in their literature review of elements or compounds that could inhibit CaCO3 precipitation. Vugrin, Nemer, and Wagner (2006) implemented this assumption by adjusting the effective CO2 yield from SO42- reduction using SO42- from DRZ minerals from 0.54-0.60 mol per mol of organic C consumed (Brush et al. 2006) to 0.62-0.69 mol per mol of organic C. They added additional conservatism by using only the upper end of this range, or 0.69 mol of CO2 per mol of organic C in their calculation of the MgO effective excess factor.
Finally, Vugrin, Nemer, and Wagner (2006, Section 5.2.3, pp. 51-52) combined the yields for each step of the possible microbial consumption of CPR materials as follows:
1. Consumption of 4.89% of the organic C in the CPR materials via denitrification using NO3- in the waste, with a yield of 1 mol of CO2 per mol of organic C
2. Consumption of 0.84% of the organic C via SO4- reduction using SO42- in the waste, with a yield of 1 mol of CO2 per mol of organic C
3. Consumption of 2.4 mol % of the organic C via SO42- reduction using Castile-brine SO42-, with a yield of 1 mol of CO2 per mol of organic C
4. Consumption of the remaining 91.87 mol % of the organic C via SO42- reduction using SO42- from DRZ minerals, with a yield of 0.69 mol of CO2 per mol of organic C
The overall yield for this combination of microbial respiratory pathways and these sources of electron acceptors is 0.715 mol of CO2 per mol of organic C, with a standard deviation of 0.016 mol of CO2 per mol of organic C.
Vugrin, Nemer, and Wagner (2006, Section 5.0, p. 19) divided these uncertainties into two categories: (1) uncertainties related to the characteristics and performance of MgO, and (2) those related to the characteristics and performance of the WIPP.
Vugrin, Nemer, and Wagner (2006, Section 5.1, p. 20) identified three uncertainties related to MgO: (1) the concentration of reactive constituents in MgO, (2) the extent to which these reactive constituents react with atmospheric CO2 prior to emplacement in the repository, and (3) the extent to which they react with CO2 after emplacement.
Vugrin, Nemer, and Wagner (2006, Section 5.1.1) incorporated the results of Deng et al. (2006a) and Deng, Xiong, and Nemer (2007b) in the MgO effective excess factor because these were the first results obtained directly for Martin Marietta WTS-60, the MgO currently being emplaced in the WIPP. Deng et al. (2006) and Deng, Xiong, and Nemer (2007b) reported that WTS-60 contains 96 ± 5 mol % periclase and lime (see Section MgO-3.3.2). Vugrin et al. (2006, Section 5.1.1) selected these results based on the review by Brush and Roselle (2006, Section 2) of the characterization of the MgO that has been emplaced in the WIPP since it opened in March 1999 (see also Section MgO-3.0).
Vugrin, Nemer, and Wagner (2006, Section 5.1.2, p. 21) assumed that “due to carbonation of periclase prior to emplacement, 0.1% of the emplaced MgO will be unavailable to sequester CO2after closure ofthe repository.” This assumption is based on a DOE analysis carried out during the EPA’s review of the CCA demonstrating that less than 0.1% of the MgO would be carbonated in 30 years by CO2 that penetrates the bag over 30 years, and the WTS specification for MgO that states, “The super sack shall function as a barrier to atmospheric moisture and CO2, which is equivalent to or better than that provided by a standard commercial cement bag” (Washington TRU Solutions 2005, Section 3.3.2 E.).
Vugrin, Nemer, and Wagner (2006, Section 5.1.3, p. 22) also assumed “that all of the periclase will be available to react and will continue to react until all of the CO2 [in the repository] is consumed.” This assumption is based on the conclusion by Brush and Roselle (2006, Section 3.2, p. 8):
Because all results to date imply that the periclase and lime present in MgO will be available to react – and will continue to react – until all CO2 in the repository has been consumed, the MgO effective excess factor need not be reduced to account for incomplete reaction. This is consistent with multiplication of the excess factor by 1.
However, Vugrin, Nemer, and Wagner (2006, Section 5.1.3, p. 22) also stated that they did not include uncertainty in the MgO effective excess factor because they could not quantify it.
Vugrin, Nemer, and Wagner (2006, Section 5.2, p. 22) identified five uncertainties in the quantity of MgO that will be available to consume CO2 related to the characteristics and performance of the WIPP:
1. The probability that the supersacks will rupture and expose MgO to the repository environment (i.e., aqueous and gaseous CO2)
2. The loss of dissolved MgO from the repository via brine outflow
3. The mass of MgO in individual supersacks
4. The probability that CO2will be transported to MgO via brine-mixing processes
5. The probability of physical segregation of MgO from CO2
Vugrin, Nemer, and Wagner (2006, Section 5.2.1, p. 23) assumed “that all MgO supersacks will rupture due to either microbial degradation or lithostatic loading, making the MgO available for consumption of CO2.”
Clayton and Nemer (2006) established a probability distribution for the fraction of MgO that could be lost via brine outflow during the 10,000-year regulatory period. They used methods similar to those for calculating the probability distribution for the quantities of SO42- dissolved in Castile brines that could enter a panel in 10,000 years. Clayton and Nemer (2006) used a Monte Carlo simulation to generate 1,000 possible drilling futures, the brine-outflow results from the BRAGFLO calculations for the CRA-2004 PABC (Nemer and Stein 2005), and an MgO excess factor of 1.2 to calculate a CCDF for the quantities of MgO that could be lost in 10,000 years. The mean of this CCDF was 0.8% of the quantity of MgO initially emplaced, with a standard deviation of 1.9%. The mean value was small because almost 30% of the drilling futures did not have intrusions that penetrated a brine reservoir, and thus did not have any Castile-brine SO42-. Vugrin, Nemer, and Wagner (2006, Section 5.2.2, p. 23) incorporated these results into the MgO effective excess factor.
Kanney and Vugrin (2006) updated the analysis of Wang (2000b), which demonstrated that, in the absence of minisacks, molecular diffusion in WIPP brines would be fast enough for MgO to control chemical conditions in the repository (see Section MgO-2.1.2). Kanney and Vugrin (2006) updated Wang’s (2000b) work by modifying it to be consistent with the CRA-2004 PABC, and applying it in a modified form to the results of analysis of the effects of supercompacted waste on the long-term performance of the WIPP (Hansen et al. 2004). Neither of these modifications changed the conclusion reached by Wang (2000b), that diffusive transport alone is sufficient to mix CO2 in the aqueous phase over length scales corresponding to the postclosure height of WIPP disposal rooms and time scales appropriate to that of maximum average brine flows. Both analyses (Wang 2000b; Kanney and Vugrin 2006) conservatively omitted advective and dispersive mixing in the aqueous phase, which would be more effective than diffusion; and diffusive transport of CO2 in the gaseous phase, which would be very fast relative to that in brine. Therefore, Vugrin, Nemer, and Wagner (2006, Section 5.2.3, p. 25) “assume[d] that the mixing processes expected in the repository will be sufficient to maintain a well-mixed brine.”
Vugrin, Nemer, and Wagner (2006, Section 5.2.4, p. 25) assumed that none of the MgO emplaced in WIPP disposal rooms would become physically segregated from the repository environment. The report stated
Physical segregation of a quantity of MgO from brine or CO2due to roof collapse could potentially impact the quantity of MgO available to sequester CO2; however, the probability of this segregation and the potential impact is negligible. It is probable that any roof failure will occur by lowering of a roof beam onto the waste/MgO stack so that the failed material will not intrude into the stack. Secondly, any failed roof which might occur in smaller blocks will be fractured and will maintain a fairly high permeability to brine and gas for a significant amount of time. Finally, any small scale spalling of the roof into the interstices of the stacks will also probably maintain a high permeability either because grains will not re-cement easily, or if they do, they will form a coherent mass with brine, MgO, and gas outside of them.
Furthermore, the current method that DOE uses to emplace the MgO and calculation of the MgO excess factor on a room basis likely minimizes the possible physical segregation of MgO from brine and CO2. Operational controls guarantee one MgO supersack is emplaced on each stack of waste. If this quantity is not sufficient to meet the required MgO [excess factor] for a room, additional MgO is emplaced. These EPA audited operations are detailed in WIPP technical procedures (WTS, 2006).
Vugrin, Nemer, and Wagner (2006, Section 5.2.4, p. 25) also stated that “The uncertainty with this assumption cannot presently be quantified, so the uncertainty will not be included in [the] calculations of the MgO effective excess factor.”
Vugrin, Nemer, and Wagner (2006, Section 5.2.5, pp. 25-26) carried out a statistical analysis of the uncertainty in the mass of MgO in the supersacks and concluded that they could use a mean value of 4200 lbs, the value specified by WTS (Washington TRU Solutions 2005, Section 3.4.1, p. 3) for the mass of MgO in a supersack, and a standard deviation of 0.037%.
Vugrin, Nemer, and Wagner (2006) recognized four uncertainties that could affect the number of moles of CO2 that would be consumed per mole of available MgO:
1. The extent to which consumption of CO2 by brucite produces hydromagnesite (5424) or magnesite in WIPP disposal rooms
2. Possible consumption of CO2 by materials other than MgO
3. Dissolution of CO2 in WIPP brines
4. Incorporation of CO2 in biomass
The extent to which carbonation of brucite produces hydromagnesite (5424) or magnesite will affect the MgO effective excess factor (Brush and Roselle 2006, Section 4; Vugrin, Nemer, and Wagner 2006, Section 6.1). The brucite-hydromagnesite (5424) carbonation reaction consumes 0.8 mol of CO2 per mol of MgO consumed; the brucite-magnesite reaction consumes 1 mol of CO2 per mol of MgO (compare Reactions [MgO.7] and [MgO.8] in Section MgO-5.1). Brush and Roselle (2006, Section 4.1, Section 5.2, and Section 5.3) reviewed the results of laboratory and natural-analog studies of brucite carbonation. Based on their review, Brush and Roselle (2006, Section 4.1, p. 12) concluded
Any hydromagnesite formed prior to 9,000 years after the WIPP is filled and sealed would convert completely to magnesite, which – along with the initially formed hydromagnesite – would consume 1 mol of CO2 per mol of periclase. Furthermore, much of the hydromagnesite formed after 9,000 years would react to form magnesite.
Brush and Roselle (2006, Section 4.2, pp. 12-13) also concluded
Incorporation of the ratio of the number of moles of CO2 consumed per mol of periclase in MgO into the effective excess factor necessitates multiplication of this factor by a value close to 1. The number of moles of CO2 consumed per mol of periclase will be close to 1 because: (1) magnesite will be the dominant Mg carbonate throughout most of the 10,000-year regulatory period; and (2) formation of magnesite from brucite (or periclase), and formation of hydromagnesite followed by conversion of hydromagnesite to magnesite would both consume 1 mol of CO2 per mol of periclase. The exact ratio of CO2 consumed per mol of periclase will depend on how much CO2 is produced by microbial activity prior to 9,000 years. Therefore, this ratio might have to be computed on a vector-by-vector basis.
The laboratory and some of the natural-analog studies on which these conclusions are based are also reviewed in Section MgO-4.2.2 (see above).
Vugrin, Nemer, and Wagner (2006, Section 6.1, p. 29) carried out an analysis that demonstrated that “as long as the half life for the conversion of hydromagnesite [5424] to magnesite is less than 3,000 years, uncarbonated Mg[O] will remain.” Their analysis was based on the results of Zhang et al. (1999), but introduced additional conservatisms that are not required to apply these results to the formation of magnesite in the WIPP (see Section MgO-4.2.2). Vugrin, Nemer, and Wagner (2006, Table 5, p. 35) also assumed that carbonation of brucite will consume 1 mol of CO2 per mol of MgO, consistent with conversion of all of the hydromagnesite (5424) in WIPP disposal rooms to magnesite (Reaction [MgO.9] in Section MgO-4.2.2).
Brush and Roselle (2006, Section 6) reviewed the results of studies relevant to the possible consumption of CO2 by materials other than MgO in the WIPP. Brush and Roselle (2006, Section 6.6, p. 25) concluded
Inclusion of the effects of consumption of CO2 by Fe-base metals and their corrosion products, lead (Pb)-base metals and their corrosion products, and CaO and Ca(OH)2 in Portland cement would be difficult at present because of the uncertainties associated with these processes in the WIPP ... However, these materials could consume 36.1, 1.36, and 0.177% of the CO2 that would be produced by complete microbial consumption of all CPR materials in the repository.
Therefore, Vugrin, Nemer, and Wagner (2006, Section 6.2, p. 31) decided
Because of these uncertainties, this analysis will use the conservative assumption that CO2will not be consumed by Fe-base metals or their corrosion products, Pb-base metals or their corrosion products, or lime and portlandite in portland cements. However, if it were possible to quantify the expected quantities of CO2that would be consumed by these materials and the associated uncertainty in calculation of the [MgO effective excess factor], it would increase the mean [MgO effective excess factor] and possibly the … uncertainty. The magnitude of these increases is not known.
Brush and Roselle (2006, Section 6.4, p. 24) demonstrated
Dissolution of CO2 in WIPP brines cannot consume significant quantities of CO2 relative to the quantity that would be produced by microbial consumption of all CPR materials in the repository. This is because the solubility of CO2 in brines is too low, and the volumes of brines that could flow through the repository are too low to dissolve significant amounts of CO2. The CO2 solubility is too low because the brucite-magnesite or brucite-hydromagnesite carbonation reactions will buffer fCO2 at values of [1.26 × 10⁻⁷ or 3.16 × 10⁻⁶ atm], respectively.
For example, Brush and Roselle (2006, Section 6.4, p. 24) calculated that “the amounts of CO2 dissolved in 10,011 m3 of GWB, 100,000 m3 of ERDA-6 brine, or 1,000,000 m3 of ERDA-6 brine are just 0.000318%, 0.00389%, and 0.0389%, respectively, of the total quantity of CO2 that would be produced by microbial consumption of all [of the] CPR materials in the repository.” Therefore, Vugrin, Nemer, and Wagner (2006, Section 6.3, p. 32) “assume[d] that no CO2is consumed by dissolution in brine.”
Brush et al. (2006, Section 6.5, p. 24) stated
Some of the organic C in CPR materials would be sequestered in biomass (cellular material) instead of being oxidized to CO2 if significant microbial consumption of these materials occurs in the WIPP. However, it would be difficult to predict defensibly how much C would be sequestered in biomass.
Therefore, Vugrin, Nemer, and Wagner (2006, Section 6.4, p. 32) concluded
Because the uncertainty in the quantity of organic [C] that might be sequestered in biomass cannot presently be quantified, this analysis will conservatively assume that no organic [C] in CPR materials will be incorporated into biomass. If it [were] possible to quantify this uncertainty and the uncertainty was included in calculation of the [MgO effective excess factor], it would have the impact of increasing the mean [MgO effective excess factor] and increasing the standard deviation. The magnitudes of these changes are not known.
Vugrin, Nemer, and Wagner (2006, Section 7) used the mean values and standard deviations of the uncertainties that could be quantified (see above) to calculate an MgO effective excess factor for an MgO excess factor of 1.2. They summarized the values of these parameters for the uncertainties in the number of moles of CO2 produced per mole of organic C in CPR materials, the uncertainties in the quantity of MgO that will be available to consume CO2, and the uncertainties in the number of moles of CO2 consumed per mole of available MgO in their Table 3, Table 4, and Table 5. Vugrin, Nemer, and Wagner (2006) summarized their calculation of the MgO effective excess factor in their Equation 7-1 and provided details on their calculations of the means and uncertainties (standard deviations) for their random variables and the MgO effective excess factor in Appendix C of their report.
Vugrin, Nemer, and Wagner (2006, Section 7.1, pp. 35-36) calculated that, for an MgO excess factor of 1.2, the MgO effective excess factor has a mean value of 1.60 and that the uncertainty (standard deviation) is 0.0819. Based on the assumption that the distribution of the effective excess factor is lognormal, Vugrin, Nemer, and Wagner (2006, Section 7.1, p. 36) calculated
[T]here is a 3 × 10⁻⁵ probability that the [MgO effective excess factor] will be less than 1.30 (Table 7), which is 30% higher than the minimum [MgO effective excess factor] required to maintain chemical conditions assumed in PA. Furthermore, there is only a 10-19 probability that the [MgO effective excess factor] will be less than 1.01.
As long as the MgO effective excess factor is greater than or equal to 1.00, there would be enough MgO present in WIPP disposal rooms to consume all the CO2 produced by complete consumption of all of the CPR materials in the repository.
Vugrin, Nemer, and Wagner (2007) revised the uncertainties used by Vugrin, Nemer, and Wagner (2006) because of EPA-mandated changes to the PA technical baseline for the CRA-2004 PABC. Vugrin, Nemer, and Wagner (2007) (1) changed the overall yield for microbial consumption of all of the CPR materials in the repository from 0.715 mol of CO2 per mol of organic C, with a standard deviation of 0.0158 mol of CO2 per mol of organic C, to a constant value of 1 mol of CO2 per mol of organic C; and (2) changed the assumption that carbonation of brucite will consume 1 mol of CO2 per mol of MgO, consistent with conversion of all of the hydromagnesite (5424) in WIPP disposal rooms to magnesite, and introduced a random variable with a uniform distribution between 0.8 and 1 mol of CO2 per mol of MgO, consistent with an equal likelihood of forming hydromagnesite (5424) or magnesite.
Vugrin, Nemer, and Wagner (2006, Section 5.2.3, pp. 51-52) combined the yields for each step of the possible microbial consumption of CPR materials in the repository and obtained an overall yield of 0.715 mol of CO2 per mol of organic C, with a standard deviation of 0.016 mol of CO2 per mol of organic C (see the discussion above of the uncertainties in the number of moles of CO2 produced per mole of organic C in CPR materials). Vugrin et al. (2007, Section 4.2.3, p. 13) changed the overall yield from 0.715 mol of CO2 per mol of organic C, with a standard deviation of 0.016 mol of CO2 per mol of organic C, to a constant value of 1 because
[T]he current PA technical baseline (established by the CRA-2004 PABC) includes only denitrification and [SO42-] reduction as microbial [respiratory] pathways for the consumption of organic [C]. Methanogenesis was not included in the CRA-2004 PABC. The current baseline also does not include consumption of CO2 by [Mg] in Salado brines or by precipitation of CaCO3-bearing minerals. Consequently, the effective CO2 yield corresponding to the baseline assumptions is 1 mol of CO2 per mol of consumed organic [C]. This value represents the maximum yield that could occur.
Because of the complexity involved with quantifying the uncertainty in the effective CO2 yield, this analysis will model the yield in a conservative manner consistent with the CRA 2004 PABC. That is, it will be assumed that:
(1) Denitrification and [SO42-] reduction [would be] the only microbial [respiratory] pathways or the consumption of organic [C].
(2) Methanogenesis [would not] occur.
(3) No CO2 [would be] consumed by precipitation of CaCO3-bearing minerals.
(4) No CO2 [would be] consumed by [Mg] in Salado brines.
Consequently, this analysis will assume that the effective CO2 yield is 1 mol of CO2 per mol of consumed organic [C]. This value represents the maximum effective yield that could occur, so modeling the yield in this manner is conservative. The variable yyield represents the effective CO2 yield in this analysis, and it will be assigned a constant value of 1 mol of CO2 per mol of consumed organic [C]. If it [were] possible to quantify this uncertainty and the uncertainty [were] included in [the] calculation of the [MgO effective excess factor], it would have the impact of increasing the mean [effective excess factor] and increasing the standard deviation.
Vugrin, Nemer, and Wagner (2006, Table 5, p. 35) also assumed that carbonation of brucite will consume 1 mol of CO2 per mol of MgO, consistent with conversion of all of the hydromagnesite (5424) in WIPP disposal rooms to magnesite (Reaction MgO.9 in Section MgO-4.2.2). They based this assumption on the review by Brush and Roselle (2006, Section 4.1, Section 5.2, and Section 5.3) of laboratory studies carried out for the WIPP project, laboratory studies carried out for other applications, and studies of anthropogenic and natural analogs. However, Vugrin, Nemer, and Wagner (2007, Section 6.1, p. 22) abandoned this assumption and introduced a random variable:
As noted above, there is some uncertainty in the length of time required for hydromagnesite to convert to magnesite. Thus, this analysis includes an approach that does not require the rate of magnesite formation to model the uncertainty in the moles of CO2 consumed per mol of MgO. Two bounding scenarios are considered for modeling purposes:
Scenario 1. No hydromagnesite converts to magnesite. In this scenario, each mol of MgO can consume 0.8 mol of CO2, and this value represents the lower bound for the moles of CO2 sequestered per mol of MgO.
Scenario 2: All hydromagnesite converts to magnesite. In this scenario, each mol of MgO can consume 1 mol of CO2, and this value represents the upper bound for the moles of CO2 sequestered per mol of MgO.
For the [MgO effective excess factor] calculation, the moles of CO2 sequestered per mol of MgO are modeled as a random variable with a uniform distribution on [0.8,1]. Representing the quantity in this manner incorporates the lower and upper bounds associated with Scenarios 1 and 2 and maximizes the uncertainty since the distribution is not weighted towards any particular value on [0.8,1].
Vugrin, Nemer, and Wagner (2007, Section 7) used the mean values and standard deviations of the uncertainties that could be quantified to recalculate an MgO effective excess factor for an MgO excess factor of 1.2. They summarized the values of these parameters for the uncertainties in the number of moles of CO2 produced per mole of organic C in CPR materials, the uncertainties in the quantity of MgO that will be available to consume CO2, and the uncertainties in the number of moles of CO2 consumed per mole of available MgO in their Table 2, Table 3, and Table 4. Vugrin, Nemer, and Wagner (2007) summarized their calculation of the MgO effective excess factor in their Equation 7-1 and provided details on their calculations of the means and uncertainties (standard deviations) for their random variables and the MgO effective excess factor in their Appendix B.
Vugrin, Nemer, and Wagner (2007, Section 7.1, pp. 27-28) calculated that, for an MgO excess factor of 1.2, the MgO effective excess factor has a mean value of 1.03 and the uncertainty (standard deviation) is 0.072.
Because the MgO effective excess factor is greater than 1.00, there would be enough MgO present in WIPP disposal rooms to consume all of the CO2 produced by complete consumption of all of the CPR materials in the repository.
The EPA approved the reduction of the MgO excess factor to 1.2 in February 2008 (Reyes 2008). However, the EPA imposed two conditions in its approval letter (Reyes 2008, p. 1):
First, [the] DOE must continue to calculate and track both the [C] disposed and the required MgO needed on a room-by-room basis. Second, [the] DOE must annually verify the reactivity of MgO and ensure that it is maintained at 96 [mol] % as assumed in [the] DOE’s supporting documentation. These conditions ensure that the WIPP will continue to meet the assurance requirements in our radioactive waste disposal regulations.
The EPA’s approval (Reyes 2008, p. 1) went on to state
As a result of this evaluation, it is our opinion that further reductions in the MgO safety factor are not warranted given the current state of knowledge. We believe that reducing the safety factor below 1.2, based on our current understanding of the disposal system, would not be sufficient to comply with the assurance requirement that MgO is intended to address.
The EPA (U.S. Environmental Protection Agency 2008) summarized its review of the DOE’s PCR for a reduction in the MgO excess factor from 1.67 to 1.2. SCA (2008) carried out a detailed review of the uncertainties related to the use of MgO as the engineered barrier in the WIPP. Langmuir (2007) reviewed the results of the analysis published by SCA (2008), and SCA (2007) responded to this review. Finally, PECOS Management Services, Inc. reviewed the use of MgO as an engineered barrier, and concluded that reducing the MgO excess factor from 1.67 to 1.2 would be appropriate and that the excess factor could be reduced even more (PMS 2007). Langmuir (2007), PMS (PECOS Management Services, Inc. 2007), SCA (S. Cohen and Associates 2007), SCA (S. Cohen and Associates 2008), and U.S. Environmental Protection Agency (2008) were all included in Reyes (2008) as attachments.
Adams, J.E. 1944. “Upper Permian Ochoa Series of Delaware Basin, West Texas and Southeastern New Mexico.” American Association of Petroleum Geologists Bulletin, vol. 28: 1596–1625.
Asghari, A., and S.R. Farrah. 1993. “Inactivation of Bacteria by Solids Coated with Magnesium Peroxide,” Journal of Environmental Science and Health, vol. A28: 779-93.
Babb, S.C., and C.F. Novak. 1995. User’s Manual for FMT, Version 2.0. ERMS 228119. Albuquerque: Sandia National Laboratories, WIPP Performance Assessment.
Babb, S.C., and C.F. Novak. 1997. User’s Manual for FMT, Version 2.3: A Computer Code Employing the Pitzer Activity Coefficient Formalism for Calculating Thermodynamic Equilibrium in Geochemical Systems to High-Electrolyte Concentrations. ERMS 243037. Albuquerque: Sandia National Laboratories, WIPP Performance Assessment.
Bates, R.L., and J.A. Jackson, eds. 1984. Dictionary of Geological Terms. 3rd ed. New York: Anchor-Doubleday.
Berner, R.A. 1980. Early Diagenesis: A Theoretical Approach. Princeton: Princeton UP.
Brush, L.H. 1990. Test Plan for Laboratory and Modeling Studies of Repository and Radionuclide Chemistry for the Waste Isolation Pilot Plant. SAND90-0266. ERMS 225053. Albuquerque: Sandia National Laboratories.
Brush, L.H. 1995. Systems Prioritization Method—Iteration 2 Baseline Position Paper: Gas Generation in the Waste Isolation Pilot Plant (March 17). ERMS 228740. Albuquerque: Sandia National Laboratories.
Brush, L.H. 1996. Memorandum to M.S. Tierney (Subject: Ranges and Probability Distributions of Kds for Dissolved Pu, Am, U, Th, and Np in the Culebra for the PA Calculations to Support the CCA). 10 June 1996. ERMS 238801. U.S. Department of Energy, Sandia National Laboratories, Albuquerque, NM.
Brush, L.H. 2004. Implications of New (Post-CCA) Information for the Probability of Significant Microbial Activity in the WIPP (July 28). ERMS 536205. Carlsbad, NM: Sandia National Laboratories.
Brush, L.H. 2005. Results of Calculations of Actinide Solubilities for the WIPP Performance Assessment Baseline Calculations (May 18). ERMS 539800. Carlsbad, NM: Sandia National Laboratories.
Brush, L.H., R.C. Moore, and N.A. Wall. 2001. Response to EEG-77, Plutonium Chemistry under Conditions Relevant for WIPP Performance Assessment: Review of Experimental Results and Recommendations for Future Work, by V.M. Oversby (March 15). ERMS 517373. Carlsbad, NM: Sandia National Laboratories.
Brush, L.H., and G.T. Roselle. 2006. Memorandum to E.D. Vugrin (Subject: Geochemical Information for Calculation of the MgO Effective Excess Factor). 17 November 2006. ERMS 544840. U.S. Department of Energy, Sandia National Laboratories, Carlsbad, NM.
Brush, L.H., and L.J. Storz. 1996. Memorandum to M.S. Tierney (Subject: Revised Ranges and Probability Distributions of Kds for Dissolved Pu, Am, U, Th, and Np in the Culebra for the PA Calculations to Support the CCA). 24 July 1996. ERMS 238231. U.S. Department of Energy, Sandia National Laboratories, Albuquerque, NM.
Brush, L.H., and Y. Xiong. 2003a. Calculation of Actinide Solubilities for the WIPP Compliance Recertification Application (May 8). ERMS 529131. Carlsbad, NM: Sandia National Laboratories.
Brush, L.H., and Y. Xiong. 2003b. Calculation of Actinide Solubilities for the WIPP Compliance Recertification Application(March 20). AP-098. ERMS 526862. Carlsbad, NM: Sandia National Laboratories.
Brush, L.H., and Y. Xiong. 2003c. Calculation of Actinide Solubilities for the WIPP Compliance Recertification Application (Rev. 1). AP-098. ERMS 527714. Carlsbad, NM: Sandia National Laboratories.
Brush, L.H., and Y. Xiong. 2003d. Calculation of Organic Ligand Concentrations for the WIPP Compliance Recertification Application. ERMS 527567. Carlsbad, NM: Sandia National Laboratories.
Brush, L.H., and Y. Xiong. 2005a. Calculation of Actinide Solubilities for the WIPP Performance-Assessment Baseline Calculations, Analysis Plan AP-120, Rev. 0(Rev. 0). AP-120. ERMS 539255. Carlsbad, NM: Sandia National Laboratories.
Brush, L.H., and Y. Xiong, 2005b. Calculation of Organic-Ligand Concentrations for the WIPP Performance-Assessment Baseline Calculations (May 4). ERMS 539635. Carlsbad, NM: Sandia National Laboratories.
Brush, L.H., Y. Xiong, J.W. Garner, A. Ismail, and G.T. Roselle. 2006. Consumption of Carbon Dioxide by Precipitation of Carbonate Minerals Resulting from Dissolution of Sulfate Minerals in the Salado Formation in Response to Microbial Sulfate Reduction in the WIPP. ERMS 544785. Carlsbad, NM: Sandia National Laboratories.
Bryan, C.R., and A.C. Snider. 2001a. “MgO Hydration and Carbonation at SNL/Carlsbad.” Sandia National Laboratories Technical Baseline Reports; WBS 1.3.5.4, Repository Investigations; Milestone RI010; January 31, 2001 (pp. 66–83). ERMS 516749. Carlsbad, NM: Sandia National Laboratories.
Bryan, C.R., and A.C. Snider. 2001b. “MgO Experimental Work Conducted at SNL/CB: Continuing Investigations with Premier Chemicals MgO.” Sandia National Laboratories Technical Baseline Reports; WBS 1.3.5.4, Repository Investigations; Milestone RI020; July 31, 2001 (pp. 5-1 through 5-15). ERMS 518970. Carlsbad, NM: Sandia National Laboratories.
Chapelle, F.H. 1993. Ground-Water Microbiology and Geochemistry. New York: Wiley.
Chapman, M.A.S., J. Abercrombie, D.M. Livermore, and N.S. Williams. 1995. “Antibacterial Activity of Bowel-Cleansing Agents: Implications of Antibacteroides Activity of Senna.” British Journal of Surgery, vol. 82: 1053.
Choppin, G.R. 1988. “Humic and Radionuclide Migration.” Radiochimica Acta, vol. 44/45: 23−28.
Clayton, D.J., and M.B. Nemer. 2006. Memorandum to E.D. Vugrin (Subject: Normalized Moles of Castile Sulfate Entering the Repository and Fraction of MgO Lost Due to Brine Flow Out of the Repository). 9 October 2006. U.S. Department of Energy, Sandia National Laboratories, Carlsbad, NM.
Cotsworth, E. 2005. Letter to I. Triay (1 Enclosure). 4 March 2005. ERMS 538858. U.S. Environmental Protection Agency, Office of Air and Radiation, Washington, DC.
Crawford, B.A. 2005a. Determination of Waste Stream Oxyanions using TWBID Revision 2.1, Version 3.13, Data Version 4.15 (February 24). ERMS 538811. Carlsbad, NM: Los Alamos National Laboratory.
Crawford, B.A. 2005b. Waste Material Densities in TRU Waste Streams from TWBID Revision 2.1, Version 3.13, Data Version D.4.15 (April 13). ERMS 539323. Carlsbad, NM: Los Alamos National Laboratory.
Criddle, C.S., L.A. Alvarez, and P.L. McCarty. 1991. “Microbial Processes in Porous Media.” Transport Processes in Porous Media (pp. 639−91) eds. J. Bear and M.Y Corapcioglu. Amsterdam: Kluwer.
Daveler, S.A., and T.J. Wolery. 1992. EQPT, A Data File Preprocessor for the EQ3/6 Software Package: User’s Guide and Related Documentation(Version 7.0). UCRL-MA-110662 PT II. Livermore, CA: Lawrence Livermore National Laboratory.
Deal, D.E., R.J. Abitz, D.S. Belski, J.B. Case, M.E. Crawley, R.M. Deshler, P.E. Drez, C.A. Givens, R.B. King, B.A. Lauctes, J. Myers, S. Niou, J.M. Pietz, W.M. Roggenthen, J.R. Tyburski, and M.G. Wallace. 1989. Brine Sampling and Evaluation Program 1988 Report. DOE-WIPP-89-015. Carlsbad, NM: U.S. Department of Energy, WIPP Project Office.
Deng, H., S. Johnson, Y. Xiong, G.T. Roselle, and M. Nemer. 2006. Analysis of Martin Marietta MagChem 10 WTS-60 MgO (November 14). ERMS 544712. Carlsbad, NM: Sandia National Laboratories.
Deng, H., M.B. Nemer, and Y. Xiong. 2006. Experimental Study of MgO Reaction Pathways and Kinetics (Rev. 0, June 6). TP 06-03. ERMS 543633. Carlsbad, NM: Sandia National Laboratories.
Deng, H., M.B. Nemer, and Y. Xiong. 2007. Experimental Study of MgO Reaction Pathways and Kinetics (Rev. 1, January 10). TP 06-03. ERMS 545182. Carlsbad, NM: Sandia National Laboratories.
Deng, H., Y. Xiong, and M. Nemer. 2007. Experimental Work Conducted on MgO Characterization and Hydration, Milestone Report. ERMS 546570. Carlsbad, NM: Sandia National Laboratories.
Dials, G.E. 1997. Letter to R. Trovato (1 Enclosure). 26 February 1997. U.S. Department of Energy, Carlsbad Area Office, Carlsbad, NM...\..\references\Others\Dials_February_26_1997_Letter_to_Travato.pdf
Fenchel, T., G.M. King, and T.H. Blackburn. 2000. Bacterial Biogeochemistry: The Ecophysiology of Mineral Cycling. 2nd ed. San Diego: Academic.
Fernández, A.I., J.M. Chimenos, M. Segarra, M.A. Fernández, and F. Espiell. 1999. “Kinetic Study of Carbonation of MgO Slurries.” Hydrometallurgy, vol. 53: 155–67.
Fernández-Diáz, L., A. Putnis, M. Prieto, and C.V. Putnis. 1996. “The Role of Magnesium in the Crystallization of Calcite and Aragonite in a Porous Medium.” Journal of Sedimentary Research, vol. 66, no. 3: 482–91.
Francis, A.J., and J.B. Gillow. 1994. Effects of Microbial Processes on Gas Generation Under Expected Waste Isolation Pilot Plant Repository Conditions. Progress Report through 1992. SAND93-7036. Albuquerque: Sandia National Laboratories.
Francis, A.J., and J.B. Gillow. 2000. Memorandum to Y. Wang (Subject: Progress Report: Microbial Gas Generation Program). 6 January 2000. ERMS 509352. Brookhaven National Laboratory, Upton, NY.
Francis, A.J., J.B. Gillow, and M.R. Giles. 1997. Microbial Gas Generation Under Expected Waste Isolation Pilot Plant Repository Conditions. SAND96-2582. ERMS 244125. Albuquerque: Sandia National Laboratories.
Froelich, P.N., G.P. Klinkhammer, M.L. Bender, N.A. Luedtke, G.R. Heath, D. Cullen, P. Dauphin, D. Hammond, B. Hartman, and V. Maynard. 1979. “Early Oxidation of Organic Matter in Pelagic Sediments of the Eastern Equatorial Atlantic: Suboxic Diagenesis.” Geochimica et Cosmochimica Acta, vol. 43: 1075−90.
Garber, R.A., P.M. Harris, and J.M. Borer. 1990. “Occurrence and Significance of Magnesite in Upper Permian (Guadalupian) Tansil and Yates Formations, Delaware Basin, New Mexico.” American Association of Petroleum Geologists Bulletin, vol. 74, no. 2: 119–34.
Gillow, J.B., and A.J. Francis. 2001a. “Re-Evaluation of Microbial Gas Generation under Expected Waste Isolation Pilot Plant Conditions: Data Summary Report, January 24, 2001.” Sandia National Laboratories Technical Baseline Reports; WBS 1.3.5.4, Repository Investigations; Milestone RI010; January 31, 2001 (pp. 19−46). ERMS 516749. Carlsbad, NM: Sandia National Laboratories.
Gillow, J.B., and A.J. Francis. 2001b. “Re-Evaluation of Microbial Gas Generation under Expected Waste Isolation Pilot Plant Conditions: Data Summary and Progress Report (February 1 – July 13, 2001), July 16, 2001, Rev. 0.” Sandia National Laboratories Technical Baseline Reports, WBS 1.3.5.4, Repository Investigations Milestone R1020, July 31, 2001 (pp. 3-1 through 3-21). ERMS 518970. Carlsbad, NM: Sandia National Laboratories.
Gillow, J.B., and A.J. Francis. 2002a. “Re-Evaluation of Microbial Gas Generation under Expected Waste Isolation Pilot Plant Conditions: Data Summary and Progress Report (July 14, 2001 – January 31, 2002), January 22, 2002.” Sandia National Laboratories Technical Baseline Reports, WBS 1.3.5.3, Compliance Monitoring; WBS 1.3.5.4, Repository Investigations, Milestone RI110, January 31, 2002 (pp. 2.1-1 through 2.1-26). ERMS 520467. Carlsbad, NM: Sandia National Laboratories.
Gillow, J.B., and A.J. Francis. 2002b. “Re-Evaluation of Microbial Gas Generation under Expected Waste Isolation Pilot Plant Conditions: Data Summary and Progress Report (February 1 – July 15, 2002), July 18, 2002.” Sandia National Laboratories Technical Baseline Reports, WBS 1.3.5.3, Compliance Monitoring; WBS 1.3.5.4, Repository Investigations, Milestone RI130, July 31, 2002 (pp. 3.1-1 through 3.1-A10). ERMS 523189. Carlsbad, NM: Sandia National Laboratories.
Gillow, J.B., and A.J. Francis. 2003. Microbial Gas Generation under Expected Waste Isolation Pilot Plant Repository Conditions (Rev. 0, October 6). ERMS 532877. Upton, NY: Brookhaven National Laboratory.
Gitlin, B.C. 2006. Letter to D.C. Moody. 28 April 2006. ERMS 543319. U.S. Environmental Protection Agency, Office of Air and Radiation, Washington, DC.
Gradstein, F.M., J.G. Ogg, and A.G. Smith, eds. 2005. A Geologic Timescale 2004. Cambridge: Cambridge UP.
Hansen, C.W., L.H. Brush, M.B. Gross, F.D. Hansen, B.Y. Park, J.S. Stein, and T.W. Thompson. 2004. Effects of Supercompacted Waste and Heterogeneous Waste Emplacement on Repository Performance, Rev. 2 (January 19). ERMS 533551. Carlsbad, NM: Sandia National Laboratories.
Hansen, C.W., and C.D. Leigh. 2003. A Reconciliation of the CCA and the PAVT Parameter Baselines (Rev. 3, April 30). ERMS 528582. Carlsbad, NM: Sandia National Laboratories.
Hansen, F.D. 2005. Memorandum to D.S. Kessel (Subject: Magnesium Oxide Super Sack Rupture under WIPP Conditions). 11 May 2005. ERMS 539724. Sandia National Laboratories, Carlsbad, NM.
Hazen, R.M., and E. Roedder. 2001. “How Old Are Bacteria from the Permian Age?” Nature, vol. 411: 155.
Hunter, K.S., Y. Wang, and P. Van Cappellan. 1998. “Kinetic Modeling of Microbially Driven Redox Chemistry of Subsurface Environments: Coupling, Transport, Microbial Metabolism, and Geochemistry.” Journal of Hydrology, vol. 209: 53−80.
Institute for Regulatory Science (RSI). 2006. Application of Magnesium Oxide as an Engineered Barrier at [the] Waste Isolation Pilot Plant–Report of the Expert Panel (February 21). RSI-06-01. Alexandria, VA: Institute for Regulatory Science.
Institute for Regulatory Science (RSI). 2008. “About Us—Functional Statement.” <http://www.nars.org/aboutfunc-frame.htm> 19 April 2008.
Kanney, J.F., A.C. Snider, T.W. Thompson, and L.H. Brush. 2004. Effect of Naturally Occurring Sulfate on the MgO Safety Factor in the Presence of Supercompacted Waste and Heterogeneous Waste Emplacement (March 5). ERMS 534150. Carlsbad, NM: Sandia National Laboratories.
Kanney, J.F., and E.D. Vugrin. 2006. Memorandum to D.S. Kessel (Subject: Updated Analysis of Characteristic Time and Length Scales for Mixing Processes in the WIPP Repository to Reflect the CRA-2004 PABC Technical Baseline and the Impact of Supercompacted Mixed Waste and Heterogeneous Waste Emplacement). 31 August 2006. ERMS 544248. U.S. Department of Energy, Sandia National Laboratories, Carlsbad, NM.
Kirchner, T., and E. Vugrin. 2006. Memorandum to D.S. Kessel (Subject: Uncertainty in Cellulose, Plastic, and Rubber Measurements for the Waste Isolation Pilot Plant Inventory). 12 June 2006. ERMS 543848. U.S. Department of Energy, Sandia National Laboratories, Carlsbad, NM.
Koper, O.B., J.S. Klabunde, G.L. Marchin, K.J. Klabunde, P. Stoimenov, and L. Bohra. 2002. “Nanoscale Powders and Formulations with Biocidal Activity toward Species and Vegetative Cells of Bacillus Species, Viruses, and Toxins.” Current Microbiology, vol. 44: 49–55.
Krumhansl, J.L., J.W. Kelly, H.W. Papenguth, and R.V. Bynum. 1997. Memorandum to E.J. Nowak (Subject: MgO Acceptance Criteria). 10 December 1997. ERMS 248997. U.S. Department of Energy, Sandia National Laboratories, Albuquerque, NM.
Krumhansl, J.L., K.M. Kimball, and C.L. Stein. 1991. Intergranular Fluid Compositions from the Waste Isolation Pilot Plant (WIPP), Southeastern New Mexico. SAND90-0584. Albuquerque: Sandia National Laboratories.
Lang, W.B. 1939. “Salado Formation of the Permian Basin.” American Association of Petroleum Geologists Bulletin, vol. 23: 1569−72.
Langmuir, D. 2007. Memorandum to S.L. Ostrow (Subject: Letter Report Review of the SC&A Draft Report “Review of MgO-Related Uncertantities in the Waste Isolation Pilot Plant”). 4 November 2007. Hydrochem Systems Corporation, Silverthorne CO.
Leigh, C.D. 2003. Estimate of Cellulosics, Plastics, and Rubbers in a Single Panel in the WIPP Repository in Support of AP-107 (Supersedes ERMS 530959) (September 4). ERMS 531324. Carlsbad, NM: Sandia National Laboratories.
Leigh, C.D. 2004a. Memorandum to Record (Subject: Waste Parameters for a Single Panel Assuming a 50/50 Volume Split between INEEL Supercompacted Waste and Waste from Other Sites, Rev. 1). 26 February 2004. ERMS 534016. U.S. Department of Energy, Sandia National Laboratories, Carlsbad, NM.
Leigh, C.D. 2004b. Memorandum to Record (Subject: Waste Parameters for an Alternative TDOP Loading Assumption in the AMW Analysis, Rev. 1). 26 February 2004. ERMS 534017. U.S. Department of Energy, Sandia National Laboratories, Carlsbad, NM.
Leigh, C., J. Kanney, L. Brush, J. Garner, G. Kirkes, T. Lowry, M. Nemer, J. Stein, E. Vugrin, S. Wagner, and T. Kirchner. 2005. 2004 Compliance Recertification Application Performance Assessment Baseline Calculation (Revision 0). ERMS 541521. Carlsbad, NM: Sandia National Laboratories.
Leigh, C., and J. Trone. 2005. Calculation of the Waste Unit Factor for the Performance Assessment Baseline Calculation (Revision 0). ERMS 539613. Carlsbad, NM: Sandia National Laboratories.
Li, Y.H., and S. Gregory. 1974. “Diffusion of Ions in Sea Water and in Deep Sea Sediments.” Geochimica et Cosmochimica Acta, vol. 33, no. 5: 703–14.
Lowenstein, T.K. 1983. “Deposition and Alteration of an Ancient Potash Evaporite: The Permian Salado Formation of New Mexico and West Texas.” Ph.D. Dissertation. Baltimore: The Johns Hopkins University.
Lowenstein, T.K. 1988. “Origin of Depositional Cycles in a Permian ‘Saline Giant’: The Salado (McNutt Zone) Evaporites of New Mexico and Texas.” Geological Society of America Bulletin, vol. 100: 592–608.
Marcinowski, F. 2001. Letter to I.R. Triay (1 Enclosure). 11 January 2001. ERMS 519362. U.S. Environmental Protection Agency, Radiation Protection Division, Washington, DC.
Marcinowski, F. 2004. Letter to R.P. Detwiler (2 Enclosures). 26 March 2004. U.S. Environmental Protection Agency, Office of Air and Radiation, Washington, DC.
Martin Marietta Magnesia Specialties. 2006. “Everything You Ever Wanted to Know About Magnesium Oxide.” <http://www.magspecialties.com/students.htm> 14 November 2006. ERMS 544711.
Meldrum, F.C., and S.T. Hyde. 2001. “Morphological Influence of Magnesium and Organic Additives on the Precipitation of Calcite.” Journal of Crystal Growth, vol. 231: 544−58.
Molecke, M.A. 1983. A Comparison of Brines Relevant to Nuclear Waste Experimentation. SAND83-0516. Albuquerque: Sandia National Laboratories.
Moody, D.C. 2006. Letter to E.A. Cotsworth (Subject: Transmittal of Planned Change Request; 1 Enclosure). 10 April 2006. ERMS 543262. U.S. Department of Energy, Carlsbad Field Office, Carlsbad, NM.
Morse, J.W. 1983. “The Kinetics of Calcium Carbonate Dissolution and Precipitation.” Carbonates: Mineralogy and Chemistry. Ed. R.J. Reeder. Blacksburg, VA: Mineralogical Society of America. Reviews in Mineralogy, vol. 11, 227–64.
Munson, D.E., R.L. Jones, D.L. Hoag, and J.R. Ball. 1987. Heated Axisymmetric Pillar Test (Room H): In Situ Data Report (February, 1985–April, 1987), Waste Isolation Pilot Plant (WIPP) Thermal/Structural Interactions Program. SAND87-2488. Albuquerque: Sandia National Laboratories.
National Research Council (NRC) Committee on the Waste Isolation Pilot Plant. 1996. The Waste Isolation Pilot Plant: A Potential Solution for the Disposal of Transuranic Waste. Washington, DC: National Academy Press.
National Research Council (NRC) Committee on the Waste Isolation Pilot Plant. 2001. Improving Operations and Long-Term Safety of the Waste Isolation Pilot Plant, Final Report. Washington, DC: National Academy Press.
Nemer, M.B. 2006. Memorandum to the SNL/WIPP Records Center (Subject: Expected Brine volumes, Cumulative Brine Inflow, and MgO-to-Brine Solid-to-Liquid Ratio from PABC BRAGFLO Results). 3 March 2006. ERMS 542612. Carlsbad, NM: Sandia National Laboratories.
Nemer, M., and J. Stein. 2005. Analysis Package for BRAGFLO: 2004 Compliance Recertification Application Performance Assessment Baseline Calculation. ERMS 540527. Carlsbad, NM: Sandia National Laboratories.
Nichols, M.D. 1996. Letter to A.L. Alm (1 Enclosure). 19 December 1996. U.S. Environmental Protection Agency, Office of Air and Radiation, Washington, DC.
Novak, C.F. 1997. Memorandum to R.V. Bynum (Subject: Calculation of Actinide Solubilities in WIPP SPC and ERDA-6 Brines under MgO Backfill Scenarios Containing either Nesquehonite or Hydromagnesite as the Mg-CO3 Solubility-Limiting Phase). 21 April 1997. ERMS 246124. Albuquerque, NM: Sandia National Laboratories.
Novak, C.F., R.C. Moore, and R.V. Bynum. 1996. Prediction of Dissolved Actinide Concentrations in Concentrated Electrolyte Solutions: A Conceptual Model and Model Results for the Waste Isolation Pilot Plant (WIPP). SAND96-2695C. ERMS 238628. Presentation at the 1996 International Conference on Deep Geological Disposal of Radioactive Waste, September 16–19, 1996, Winnipeg, Manitoba.
Oversby, V.M. 2000. Plutonium Chemistry under Conditions Relevant for WIPP Performance Assessment: Review of Experimental Results and Recommendations for Future Work. (September). EEG-77. Albuquerque: Environmental Evaluation Group.
Papenguth, H.W. 1999. Memorandum to M.G. Marietta (Subject: Evaluation of Candidate MgO Materials for Use as Backfill at WIPP). 12 November 1999. ERMS 520314. U.S. Department of Energy, Sandia National Laboratories, Albuquerque, NM.
Parkes, R.J. 2000. “A Case of Bacterial Immortality?” Nature, vol. 407: 844−45.
Peterson, A.C. 1996. Mass of MgO That Could Be Added as Backfill in the WIPP and the Mass of MgO Required to Saturate the Brine and React with the CO2 Generated by Microbial Processes (March 11). ERMS 236214. Albuquerque: Sandia National Laboratories.
PECOS Management Services, Inc. (PMS). 2007. Review of the DOE Request for Magnesium Oxide Requirement Reduction. Albuquerque, NM: PMS.
Popielak, R.S., R.L. Beauheim, S.R. Black, W.E. Coons, C.T. Ellingson, and R.L. Olsen. 1983. Brine Reservoirs in the Castile Formation, Waste Isolation Pilot Plant (WIPP) Project, Southeastern New Mexico. TME-3153. ERMS 242085. Carlsbad, NM: U.S. Department of Energy.
Powers, D.W., R.H. Vreeland, and W.D. Rosenzweig. 2001. “Reply to ‘How Old Are Bacteria from the Permian Age?’” Nature, vol. 411: 155.
Reyes, J. 2008. Letter to D.C. Moody (5 Enclosures). 11 February 2008. U.S. Environmental Protection Agency, Office of Air and Radiation, Washington, DC.
S. Cohen and Associates (SCA). 2006. Preliminary Review of the Degradation of Cellulosic, Plastic, and Rubber Materials in the Waste Isolation Pilot Plant, and Possible Effects on Magnesium Oxide Safety Factor Calculations (September 11). Vienna, VA: SCA.
S. Cohen and Associates (SCA). 2007. Response to Comments by Langmuir (2007) (December 1). Vienna, VA: SCA.
S. Cohen and Associates (SCA). 2008. Review of MgO-Related Uncertainties in the Waste Isolation Pilot Plant (January 24). Vienna, VA: SCA.
Sandia National Laboratories (SNL). 1996. Conceptual Models Information for the Peer Review Panel (May 13). ERMS 542940. Albuquerque: Sandia National Laboratories.
Sandia National Laboratories (SNL). 1997. Chemical Conditions Model: Results of the MgO Backfill Efficacy Investigation (April 23). Unpublished report. ERMS 419794. Albuquerque: Sandia National Laboratories.
Satterfield, C.L., T.K. Lowenstein, R.H. Vreeland, W.D. Rosenzweig, and D.W. Powers. 2005. “New Evidence for 250 Ma Age of Halotolerant Bacterium from a Permian Salt Crystal.” Geology, vol. 33, no. 4: 265−68.
Sawai, J. 2003. “Quantitative Evaluation of Antibacterial Activities of Metallic Oxide Powders (ZnO, MgO, CaO) by Conductimetric Assay.” Journal of Microbiological Methods, vol. 54: 177−82.
Sawai, J., H. Igarashi, A. Hashimoto, T. Kokugan, and M. Shimizu. 1995a. “Evaluation of Growth Inhibitory Effect of Ceramics Powder Slurry on Bacteria by Conductance Method.” Journal of Chemical Engineering of Japan, vol. 28: 288−93.
Sawai, J., H. Kojima, I. Saito, F. Kanou, H. Igarashi, A. Hashimoto, T. Kokugan, and M. Shimizu. 1995b. “Mutagenecity Test of Ceramic Powder[s] Which Have Growth Inhibitory Effect on Bacteria.” Journal of Chemical Engineering of Japan, vol. 28: 352−54.
Sawai, J., H. Igarashi, A. Hashimoto, T. Kokugan, and M. Shimizu. 1996. “Effect of Particle Size and Heating Temperature of Ceramic Powders on Antibacterial Activity of Their Slurry.” Journal of Chemical Engineering of Japan, vol. 29: 288−93.
Sawai, J., H. Kojima, H. Igarashi, A. Hashimoto, S. Shoji, T. Sawaki, A. Hakoda, E. Kawada, T. Kokugan, and M. Shimizu. 2000a. “Antibacterial Characteristics of Magnesium Oxide Powder.” World Journal of Microbiology and Biotechnology, vol. 16: 187−94.
Sawai, J., H. Kojima, H. Igarashi, A. Hashimoto, S. Shoji, A. Takehara, T. Sawaki, T. Kokugan, and M. Shimizu. 2000b. “Escherichia coli Damage by Ceramic Powder Slurries.” Journal of Chemical Engineering of Japan, vol. 30: 1034−39.
Sayles, F.L., and W.S. Fyfe. 1973. “The Crystallization of Magnesite from Aqueous Solutions.” Geochimica et Cosmochimica Acta, vol. 37: 87–99.
Schlesinger, W.H. 1997. Biogeochemistry: An Analysis of Global Change. New York: Academic.
Snider, A.C. 2002. “MgO Studies: Experimental Work Conducted at SNL/Carlsbad: Efficacy of Premier Chemicals MgO as an Engineered Barrier.” Sandia National Laboratories Technical Baseline Reports; WBS 1.3.5.3, Compliance Monitoring; WBS 1.3.5.4, Repository Investigations; Milestone RI110; January 31, 2002 (pp. 3.1–1 through 3.1–18). ERMS 520467. Carlsbad, NM: Sandia National Laboratories.
Snider, A.C. 2003a. Calculation of the Quantities of MgO Required for Consumption of CO2 for the WIPP Compliance Recertification Application (July 3). ERMS 530220. Carlsbad, NM: Sandia National Laboratories.
Snider, A.C. 2003b. “Hydration of Magnesium Oxide in the Waste Isolation Pilot Plant.” Sandia National Laboratories Technical Baseline Reports, WBS 1.3.5.3, Compliance Monitoring; WBS 1.3.5.4, Repository Investigations, Milestone RI 03-210, January 31, 2003 (pp. 4.2-1 through 4.2-6). ERMS 523189. Carlsbad, NM: Sandia National Laboratories.
Snider, A.C. 2003c. Verification of the Definition of Generic Weep Brine and the Development of a Recipe for This Brine. ERMS 527505. Carlsbad, NM: Sandia National Laboratories.
Snider, A.C. 2003d. Calculation of MgO Safety Factors for the WIPP Compliance Recertification Application and for Evaluating Assumptions of Homogeneity in WIPP PA (September 11). ERMS 531508. Carlsbad, NM: Sandia National Laboratories.
Snider, A.C., and Y. Xiong. 2002a. “Carbonation of Magnesium Oxide.” Sandia National Laboratories Technical Baseline Reports; WBS 1.3.5.3, Compliance Monitoring; WBS 1.3.5.4, Repository Investigations; Milestone RI130; July 31, 2002 (pp. 4.1-1 through 4.1-28). ERMS 523189. Carlsbad, NM: Sandia National Laboratories.
Snider, A.C., and Y. Xiong. 2002b. Experimental Study of WIPP Engineered Barrier MgO at Sandia National Laboratories Carlsbad Facility (Rev. 2, October 2). TP 00-07. ERMS 523957. Carlsbad, NM: Sandia National Laboratories.
Snider, A.C., and Y. Xiong. 2004. Continuing Investigations of the Hydration and Carbonation of Premier Chemical MgO (October 12). ERMS 537188. Carlsbad, NM: Sandia National Laboratories.
Snider, A.C., Y. Xiong, and N.A. Wall. 2004. Experimental Study of WIPP Engineered Barrier MgO at Sandia National Laboratories Carlsbad Facility (Rev. 3, August 26). TP 00-07. ERMS 536591. Carlsbad, NM: Sandia National Laboratories.
Stamatakis, M.G. 1995. “Occurrence and Genesis of Huntite-Hydromagnesite Assemblages, Kozani, Greece: Important New White Fillers and Extenders.” Transaction of the Institution of Mining and Metallurgy, Section B: Applied Earth Science, vol. 104: B179−B186.
Stein, C.L. 1985. Mineralogy in the Waste Isolation Pilot Plant (WIPP) Facility Stratigraphic Horizon. SAND85-0321. Albuquerque: Sandia National Laboratories.
Stein, J.S., and W. Zelinski. 2003. Analysis Package for BRAGFLO: Compliance Recertification Application (October 23). ERMS 530163. Carlsbad, NM: Sandia National Laboratories.
Stoimenov, P.K., R.L. Klinger, G.L. Marchin, and K.J. Klabunde. 2002. “Metal Oxide Nanoparticles as Bactericidal Agents.” Langmuir, vol. 18: 6679−86.
Telander, M.R., and R.E. Westerman. 1993. Hydrogen Generation by Metal Corrosion in Simulated Waste Isolation Pilot Plant Environments: Progress Report for the Period November 1989 through December 1992. SAND92-7347. ERMS 223456. Albuquerque: Sandia National Laboratories.
Telander, M.R., and R.E. Westerman. 1997. Hydrogen Generation by Metal Corrosion in Simulated Waste Isolation Pilot Plant Environments. SAND96-2538. Albuquerque: Sandia National Laboratories.
Triay, I.R. 2000. Letter to F. Marcinowski (Subject: Requesting EPA Approval of the Elimination of MgO Minisacks from the WIPP). 21 July 2001. ERMS 519362. U.S. Department of Energy, Carlsbad Field Office, Carlsbad, NM.
Trinity Engineering Associates (TEA). 2004. Review of Effects of Supercompacted Waste and Heterogeneous Waste Emplacement on WIPP Repository Performance (March 17). Cincinnati: Trinity Engineering Associates.
Trovato, E.R. 1997a. Letter to G. Dials (2 Enclosures). 25 April 1997. ERMS 247206. U.S. Environmental Protection Agency, Office of Air and Radiation, Washington, DC.
Trovato, E.R. 1997b. Letter to G. Dials (2 Enclosures). 17 April 1997. ERMS 247196. U.S. Environmental Protection Agency, Office of Air and Radiation, Washington, DC.
U.S. Department of Energy (DOE). 1996a. Title 40 CFR Part 191 Compliance Certification Application for the Waste Isolation Pilot Plant (October). 21 vols. DOE/CAO 1996-2184. Carlsbad, NM: Carlsbad Area Office.
U.S. Department of Energy (DOE). 1996b. Transuranic Waste Baseline Inventory Report (Revision 3, June). DOE/CAO 95-1121. ERMS 242330. Carlsbad, NM: Carlsbad Area Office.
U.S. Department of Energy (DOE). 2000. MgO Mini-Sack Elimination Proposal (July 21). ERMS 519362. Carlsbad, NM: Carlsbad Area Office.
U.S. Department of Energy (DOE). 2004. Title 40 CFR Part 191 Compliance Recertification Application for the Waste Isolation Pilot Plant (March). 10 vols. DOE/WIPP 2004-3231. Carlsbad, NM: Carlsbad Field Office.
U.S. Environmental Protection Agency (EPA). 1987. “40 CFR Parts 264 and 265 (FRL-3222-5) Hazardous Waste Management System; Containerized Hazardous Liquids Requirements.” Federal Register, vol. 52: 23695–697.
U.S. Environmental Protection Agency (EPA). 1992a. “40 CFR Part 264-Standards for Owners and Operators of Hazardous Waste Treatment, Storage, and Disposal Facilities.” Federal Register, vol. 57: 54452–460.
U.S. Environmental Protection Agency (EPA). 1992b. “40 CFR Part 265-Interim Status Standards for Owners and Operators of Hazardous Waste Treatment, Storage, and Disposal Facilities.” Federal Register, vol. 57: 54452–461.
U.S. Environmental Protection Agency (EPA). 1993. “40 CFR Part 191: Environmental Radiation Protection Standards for the Management and Disposal of Spent Nuclear Fuel, High-Level and Transuranic Radioactive Wastes; Final Rule.” Federal Register, vol. 58 (December 20, 1993): 66398–416.
U.S. Environmental Protection Agency (EPA). 1995. “40 CFR Parts 264, 265, and 271 (FRL 5226–9) Hazardous Waste Management: Liquids in Landfills.” Federal Register, vol. 60: 35703–706.
U.S. Environmental Protection Agency (EPA). 1998a. “CARD No. 44: Engineered Barriers.” Compliance Application Review Documents for the Criteria for the Certification and Recertification of the Waste Isolation Pilot Plant’s Compliance with the 40 CFR 191 Disposal Regulations: Final Certification Decision (May) (pp. 44-1 through 44-36). Washington, DC: Office of Radiation and Indoor Air.
U.S. Environmental Protection Agency (EPA). 1998b. “40 CFR Part 194: Criteria for the Certification and Recertification of the Waste Isolation Pilot Plant’s Compliance with the Disposal Regulations: Certification Decision; Final Rule.” Federal Register, vol. 63 (May 18, 1998): 27353–406.
U.S. Environmental Protection Agency (EPA). 1998c. “CARD No. 23: Models and Computer Codes.” Compliance Application Review Documents for the Criteria for the Certification and Recertification of the Waste Isolation Pilot Plant’s Compliance with the 40 CFR 191 Disposal Regulations: Final Certification Decision (May) (pp. 23-1 through 23-93). Washington, DC: Office of Radiation and Indoor Air.
U.S. Environmental Protection Agency (EPA). 1998d. Technical Support Document for Section 194.23: Models and Computer Codes. Washington, DC: Office of Radiation and Indoor Air.
U.S. Environmental Protection Agency (EPA). 1998e. Technical Support Document for Section 194.23: Parameter Justification Report (May). Washington, DC: Office of Radiation and Indoor Air.
U.S. Environmental Protection Agency (EPA). 1998f. Technical Support Document for Section 194.24: EPA’s Evaluation of DOE’s Actinide Source Term. Washington, DC: Office of Radiation and Indoor Air.
U.S. Environmental Protection Agency (EPA). 2001. Approval of Elimination of Minisacks. Washington, DC: Office of Radiation and Indoor Air.
U.S. Environmental Protection Agency (EPA). 2004. Discussion of Major Issues Associated with EPA’s Compressed Waste Review. ERMS 534327. Washington, DC: Office of Air and Radiation.
U.S. Environmental Protection Agency (EPA). 2006. Technical Support Document for Section 194.24: Evaluation of the Compliance Recertification Actinide Source Term and Culebra Dolomite Distribution Coefficient Values (March). Washington, DC: Office of Radiation and Indoor Air.
U.S. Environmental Protection Agency (EPA). 2008. Overview Summary of Planned Change Request Decision. Washington, DC: Office of Radiation and Indoor Air.
Usdowski, E. 1989. “Synthesis of Dolomite and Magnesite at 60 °C in the System Ca2+-Mg2+-CO32--Cl --H2O.” Naturwissenschaften, vol. 76, no. 8: 374−75.
Usdowski, E. 1994. “Synthesis of Dolomite and Geochemical Implications.” Dolomites: A Volume in Honour of Dolomieu (pp. 345−60) Eds. B. Purser, M. Tucker, and D. Zenger. Oxford: Blackwell. Special Publication No. 21 of the International Association of Sedimentologists.
Villarreal, R., J.M. Bergquist, and S.L. Leonard. 2001a. The Actinide Source-Term Waste Test Program (STTP) Final Report, Volume I. LA-UR-01-6822. Los Alamos: Los Alamos National Laboratory.
Villarreal, R., J.M. Bergquist, and S.L. Leonard. 2001b. The Actinide Source-Term Waste Test Program (STTP) Final Report, Volume II. LA-UR-01-6912. Los Alamos: Los Alamos National Laboratory.
Villarreal, R., M. King, and S.L. Leonard. 2001. The Actinide Source-Term Waste Test Program (STTP) Final Report, Volume IV. LA-UR-01-6914. Los Alamos: Los Alamos National Laboratory.
Villarreal, R., A.C. Morzinski, J.M. Bergquist, and S.L. Leonard. 2001. The Actinide Source-Term Waste Test Program (STTP) Final Report, Volume III. LA-UR-01-6913. Los Alamos: Los Alamos National Laboratory.
Vreeland, R.H., W.D. Rosenzweig, and D.W. Powers. 2000. “Isolation of a 250-Million-Year-Old Halotolerant Bacterium from a Primary Salt Crystal.” Nature, vol. 407: 897–900.
Vugrin, E.D., M.B. Nemer, and S.W. Wagner. 2006. Uncertainties Affecting MgO Effectiveness and Calculation of the MgO Effective Excess Factor (Rev. 0, November 17). ERMS 544781. Carlsbad, NM: Sandia National Laboratories.
Vugrin, E.D., M.B. Nemer, and S.W. Wagner. 2007. Uncertainties Affecting MgO Effectiveness and Calculation of the MgO Effective Excess Factor (Rev. 1, June 26). ERMS 546377. Carlsbad, NM: Sandia National Laboratories.
Wall, N.A. 2005. Preliminary Results for the Evaluation of Potential New MgO (January 27). ERMS 538514. Carlsbad, NM: Sandia National Laboratories.
Wall, N.A., and S.A. Matthews. 2005. “Sustainability of Humic Acids in the Presence of Magnesium Oxide.” Applied Geochemistry, vol. 20: 1704–13.
Wang, Y. 1998. WIPP PA Validation Document for FMT (Version 2.4), Document Version 2.4. ERMS 251587. Carlsbad, NM: Sandia National Laboratories.
Wang, Y. 2000a. Memorandum to B.A. Howard (Subject: Methanogenesis and Carbon Dioxide Generation in the Waste Isolation Pilot Plant [WIPP]). 5 January 2000. ERMS 519362. U.S. Department of Energy, Sandia National Laboratories, Carlsbad, NM.
Wang, Y. 2000b. Memorandum to B.A. Howard (Subject: Effectiveness of Mixing Processes in the Waste Isolation Pilot Plant Repository). 21 June 2000. ERMS 519362. U.S. Department of Energy, Sandia National Laboratories, Carlsbad, NM.
Wang, Y., and L. Brush. 1996a. Memorandum to M.S. Tierney (Subject: Estimates of Gas-Generation Parameters for the Long-Term WIPP Performance Assessment). 26 January 1996. ERMS 231943. U.S. Department of Energy, Sandia National Laboratories, Albuquerque, NM.
Wang, Y., and L. Brush. 1996b. Memorandum to M.S. Tierney (Subject: Modify the Stoichiometric Factory in the BRAGFLO to Include the Effect of MgO Added to WIPP Repository as a Backfill). 23 February 1996. ERMS 232286. U.S. Department of Energy, Sandia National Laboratories, Albuquerque, NM.
Wang, Y., and L. Brush. 1996c. Memorandum to P. Vaughn (Subject: An Adjustment for Using Steel Corrosion Rates in BRAGFLO to Reflect Repository Chemical Condition Changes Due to Adding MgO as Backfill). 29 February 1996. ERMS 235181. U.S. Department of Energy, Sandia National Laboratories, Albuquerque, NM.
Wang, Y., and C.R. Bryan. 2000. Experimental Study of WIPP MgO Backfill at Sandia National Laboratories Carlsbad Facility (Rev. 0, July 11). TP 00-07. ERMS 512216. Carlsbad, NM: Sandia National Laboratories.
Wang, Y., C.R. Bryan, and N.A. Wall. 2001. Experimental Study of WIPP MgO Backfill at Sandia National Laboratories Carlsbad Facility (Rev. 1, June 22). TP 00-07. ERMS 518747. Carlsbad, NM: Sandia National Laboratories.
Wang, Y., and P Van Cappellan. 1996. “A Multicomponent Reactive-Transport Model of Early Diagenesis: Application of Redox Cycling in Coastal Marine Sediments.” Geochimica et Cosmochimica Acta, vol. 60: 2993−3014.
Washington TRU Solutions (WTS). 2003. Specification for Prepackaged MgO Backfill (Rev. 5). D-0101. Carlsbad, NM: Washington TRU Solutions.
Washington TRU Solutions (WTS). 2005. Specification for Prepackaged MgO Backfill (Rev. 7, May 12). Specification D-0101. Carlsbad, NM: Washington TRU Solutions.
Washington TRU Solutions (WTS). 2006. CH Waste Processing (Rev. 23, January). Technical Procedure WP05-WH1011. Carlsbad, NM: Washington TRU Solutions.
Westinghouse Waste Isolation Division (WID). 1997. Dose Assessment of Hand Emplacement of MgO Sacks around CH Waste 7-Packs at the Waste Isolation Pilot Plant (April). WIPP Radiological Control Position Paper 97-05. Carlsbad, NM: Westinghouse WID.
Wolery, T.J. 1992a. EQ3/6, A Software Package for Geochemical Modeling of Aqueous Systems: Package Overview and Installation Guide (Version 7.0). UCRL-MA-110662 PT I. Livermore, CA: Lawrence Livermore National Laboratory.
Wolery, T.J. 1992b. EQ3NR, A Computer Program for Geochemical Aqueous Speciation-Solubility Calculations: Theoretical Manual, User’s Guide, and Related Documentation (Version 7.0). UCRL-MA-110662 PT III. Livermore, CA: Lawrence Livermore National Laboratory.
Wolery, T.J., and S.A. Daveler. 1992. EQ6, A Computer Program for Reaction-Path Modeling of Aqueous Geochemical Systems: Theoretical Manual, User’s Guide, and Related Documentation (Version 7.0). UCRL-MA-110662 PT IV. Livermore, CA: Lawrence Livermore National Laboratory.
Xiong, Y., and A.S. Lord. 2008. “Experimental Investigations of the Reaction Path in the MgO-CO2-H2O System in Solution with Various Ionic Strengths, and Their Applications to Nuclear Waste Isolation.” Applied Geochemistry, vol. 23: 1634–59.
Xiong, Y., and A.C. Snider. 2003. “Carbonation Rates of the Magnesium Oxide Hydration Product Brucite in Various Solutions.” Sandia National Laboratories Technical Baseline Reports; WBS 1.3.5.3, Compliance Monitoring; WBS 1.3.5.4, Repository Investigations; Milestone RI 03-210; January 31, 2003 (pp. 4.3-1 through 4.3-11). ERMS 526049. Carlsbad, NM: Sandia National Laboratories.
Yamamoto, O., J. Sawai, M. Hotta, H. Kojima, and T. Sasamoto. 1998. “Growth Inhibition of Bacteria by MgO-ZnO Solid-Solution Powders.” Journal of the Ceramic Society of Japan, vol. 106: 1252−54.
Zhang, P.C., H.L. Anderson, J.W. Kelly, J.L. Krumhansl, and H.W. Papenguth. 1999. Kinetics and Mechanisms of Formation of Magnesite from Hydromagnesite in Brine. SAND99-1946J. ERMS 514868. Albuquerque: Sandia National Laboratories.
Zhang, P.C., J. Hardesty, and H.W. Papenguth. 2001. “MgO Hydration Experiments Conducted at SNL-ABQ,” Sandia National Laboratories Technical Baseline Reports; WBS 1.3.5.4, Repository Investigations; Milestone RI010; January 31, 2001 (pp. 55−65). ERMS 516749. Carlsbad, NM: Sandia National Laboratories.