Title 40 CFR Part
191
Subparts B and C
Compliance Recertification
Application
for the
Waste Isolation Pilot Plant
Appendix
HYDRO-2009
Hydrological Investigations
United States
Department of Energy
Waste Isolation Pilot Plant
Carlsbad Field
Office
Carlsbad, New Mexico
Appendix HYDRO-2009
Hydrological Investigations
HYDRO-1.0 Hydrological Studies
HYDRO-2.0 Optimization of Culebra Monitoring Well Network
HYDRO-3.0 Drilling of New Wells
HYDRO-4.0 P&A and Recompletion of Old Wells
HYDRO-5.3 Dewey Lake Monitoring
HYDRO-5.4 Bell Canyon Monitoring
HYDRO-6.1 Qualitative Analysis of Diagnostic Plots
HYDRO-6.2 Distribution of Transmissivity and Correlation with Depth
HYDRO-6.3 Large-Scale Tests with Distant Observation Wells
HYDRO-6.4 Evidence for Fracture Interconnections from Diffusivity Analysis
HYDRO-7.0Geological Investigations
HYDRO-8.0 Water-Quality Sampling and Evaluation
HYDRO-8.1 Culebra Groundwater Chemistry
HYDRO-8.2 Groundwater Chemistry of Other Units
HYDRO-9.0 Modeling of Culebra Water-Level Rise
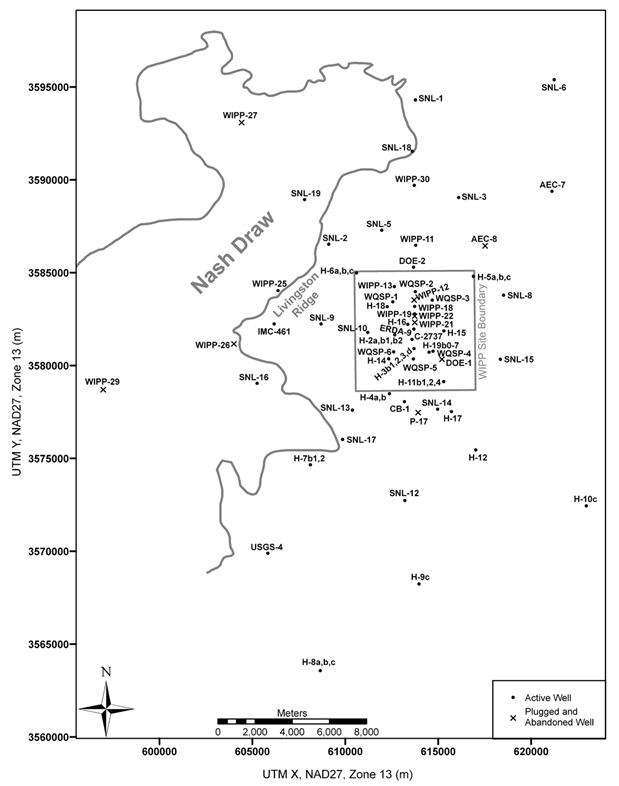
Figure HYDRO-1. Locations of WIPP Wells
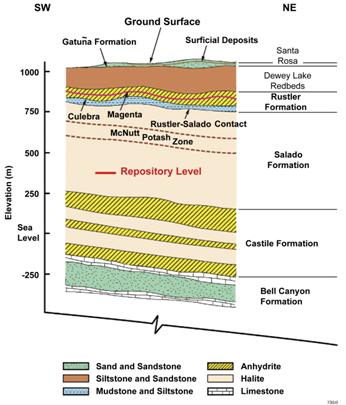
Figure HYDRO-2. General Stratigraphic Column of Geologic Units at the WIPP Site
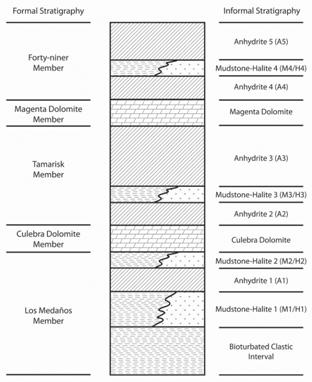
Figure HYDRO-3. Detailed Rustler Formation Stratigraphy
Figure HYDRO-7. Locations of Plugged and Abandoned and Recompleted Wells
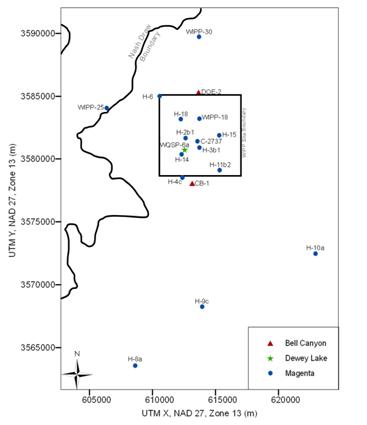
Figure HYDRO-8. Locations of Culebra Monitoring Wells Outside the WIPP Site as of 1/1/2008
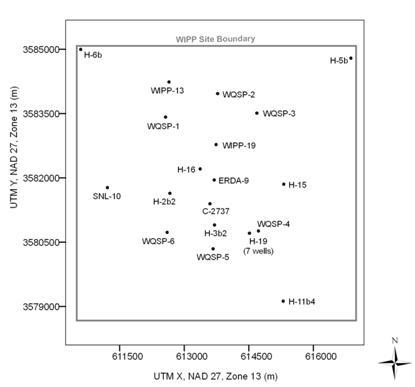
Figure HYDRO-9. Locations of Culebra Monitoring Wells Within the WIPP Site as of 1/1/2008
Figure HYDRO-10. Locations of Non-Culebra Monitoring Wells as of 1/1/2008
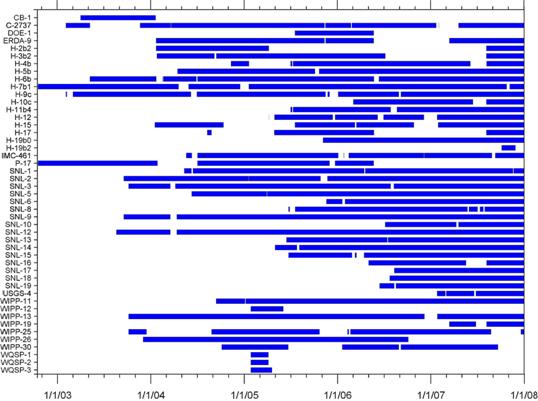
Figure HYDRO-11. Time Periods During Which Culebra Wells Have Been Monitored Using TROLL® Gauges
Figure HYDRO-12. WIPP-26 Culebra TROLL® and Water-Level Data
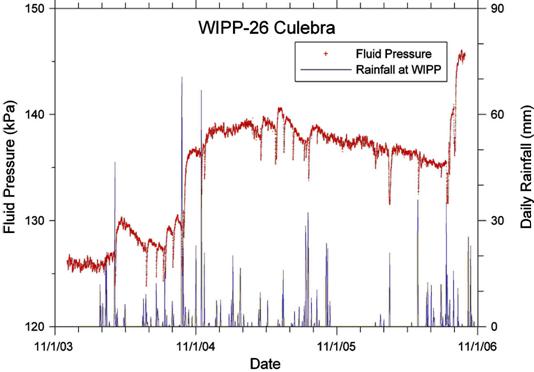
Figure HYDRO-13. WIPP-26 Culebra Fluid Pressure With Daily Rainfall Measured at the WIPP
Figure HYDRO-14. SNL-16 and SNL-19 Culebra Fluid Pressures With Daily Rainfall Measured at SNL-9
Figure HYDRO-15. SNL-1 and SNL-2 Culebra Water Levels With Daily Rainfall Measured at the WIPP
Figure HYDRO-18. Water Levels in Seven Culebra Wells North of the WIPP Site
Figure HYDRO-19. Water Levels in Seven Culebra Wells in the Northern Portion of the WIPP Site
Figure HYDRO-20. Water Levels in Eight Culebra Wells in the Central WIPP Site
Figure HYDRO-21. Water Levels in Six Culebra Wells South of the WIPP Site
Figure HYDRO-22. Water Levels in Six Culebra Wells in and Near the Southeastern Arm of Nash Draw
Figure HYDRO-23. Water Levels in Three Culebra Wells West of the WIPP Site
Figure HYDRO-24. Water Levels in Culebra Wells SNL-6 and SNL-15
Figure HYDRO-26. H-5b Culebra Water Levels
Figure HYDRO-27. Water Levels in Nine Magenta Wells
Figure HYDRO-28. Magenta Water Levels in Wells H-2b1, H-14, and H-18
Figure HYDRO-29. Magenta Water Levels in Wells DOE-2, H-6c, H-8a, and WIPP-25
Figure HYDRO-30. Time Periods During Which Magenta Wells Have Been Monitored Using TROLL® Gauges
Figure HYDRO-33. WQSP-6A Dewey Lake Water Levels
Figure HYDRO-34. DOE-2 Bell Canyon Water Levels
Figure HYDRO-35. CB-1 Bell Canyon Water Levels
Figure HYDRO-36. Log-Log Diagnostic Plot Showing Different Aquifer Conditions
Figure HYDRO-37. Log-Log Diagnostic Plot of C-2737 Recovery
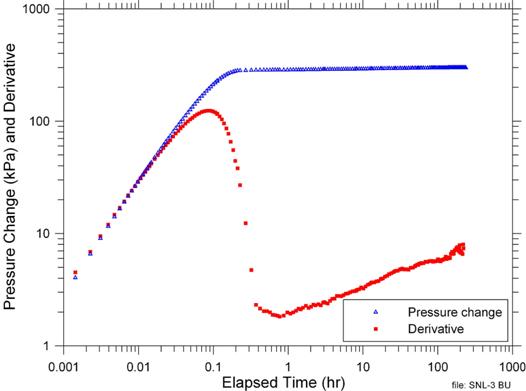
Figure HYDRO-38. Log-Log Diagnostic Plot of SNL-3 Recovery
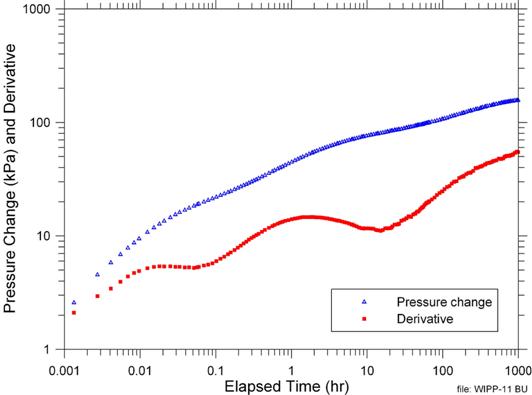
Figure HYDRO-39. Log-Log Diagnostic Plot of WIPP-11 Recovery
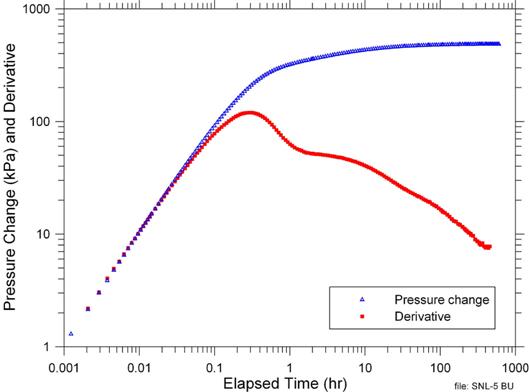
Figure HYDRO-40. Log-Log Diagnostic Plot of SNL-5 Recovery
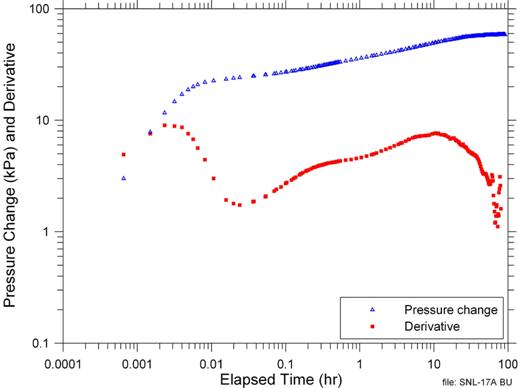
Figure HYDRO-41. Log-Log Diagnostic Plot of SNL-17A Recovery
Figure HYDRO-42. log10 Transmissivity (m2/s) Values of Culebra Wells Around the WIPP Site
Figure HYDRO-43. New Transmissivity Data Added to Correlation of Holt and Yarbrough (2002)
Figure HYDRO-44. Observation Wells Responding to 2004–2005 Long-Term Pumping Tests
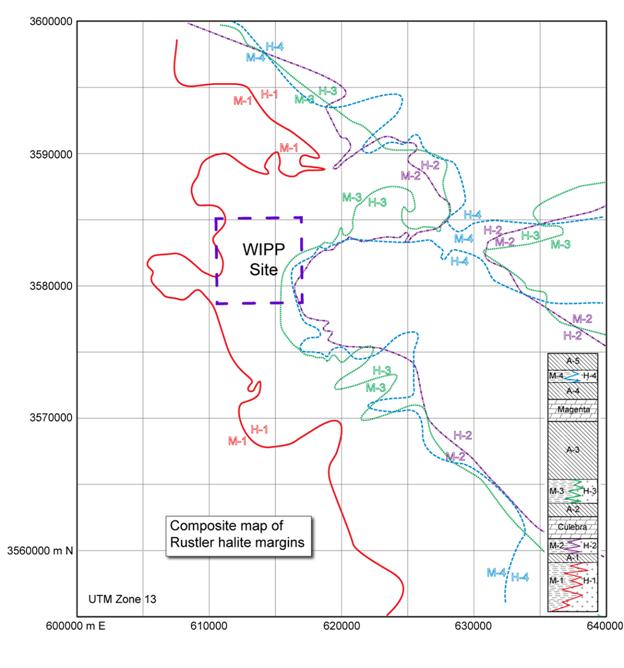
Figure HYDRO-46. Revised Rustler Halite Margins
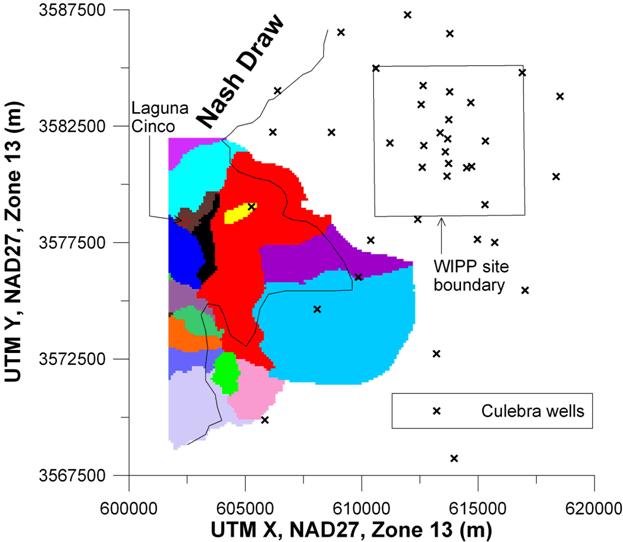
Figure HYDRO-47. Catchment Basins (color coded) Mapped in Southeastern Nash Draw
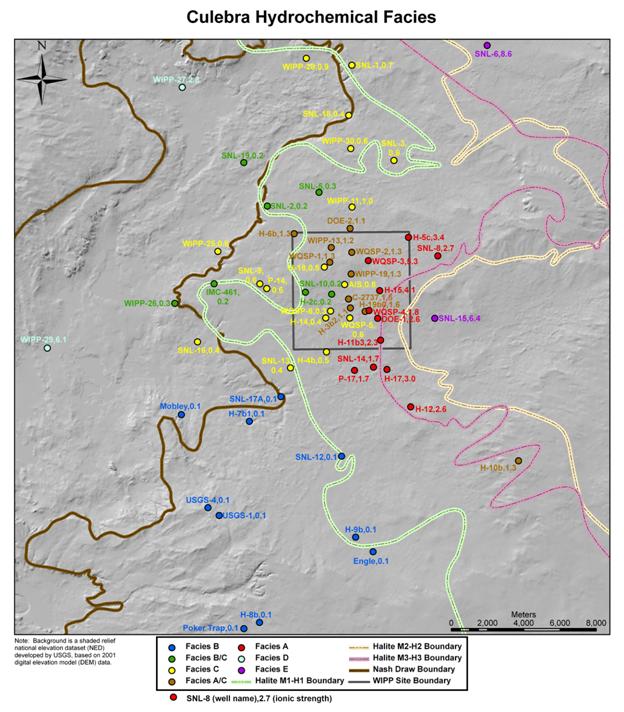
Figure HYDRO-49. Culebra Hydrochemical Facies
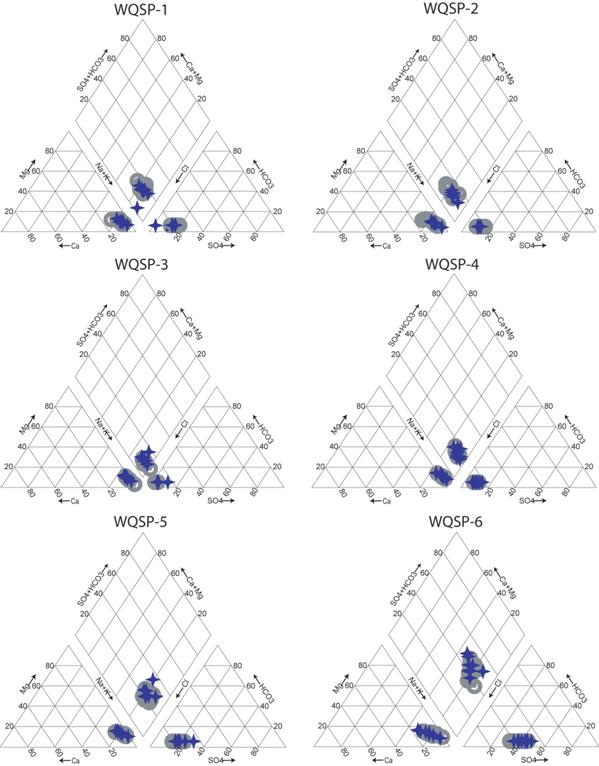
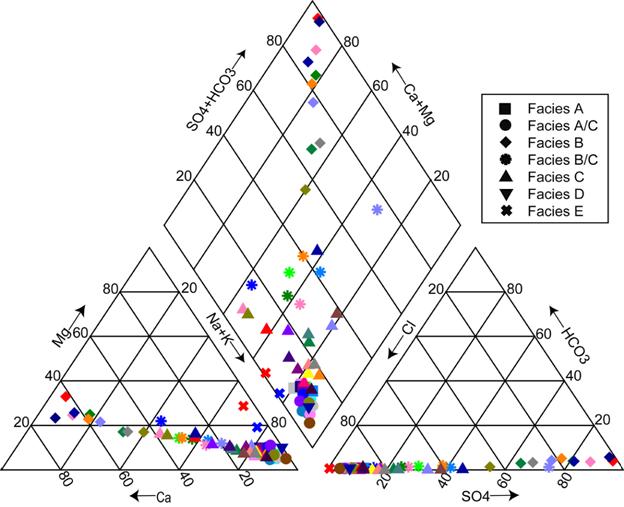
Figure HYDRO-50. Piper Plot for Culebra Water Samples Categorized by Hydrochemical Facies
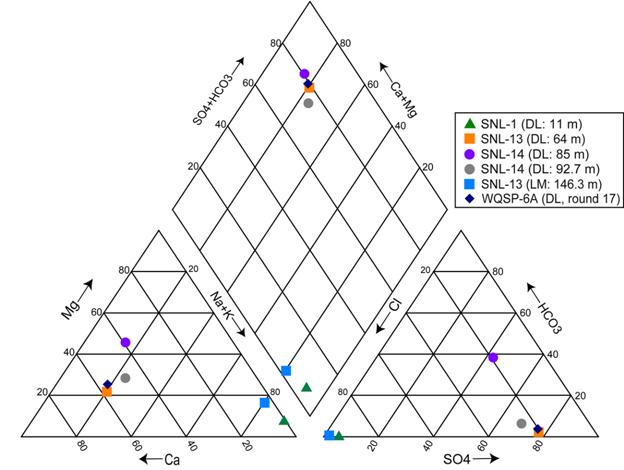
Figure HYDRO-51. Piper Plot of WQSP-6A and Opportunistic Samples
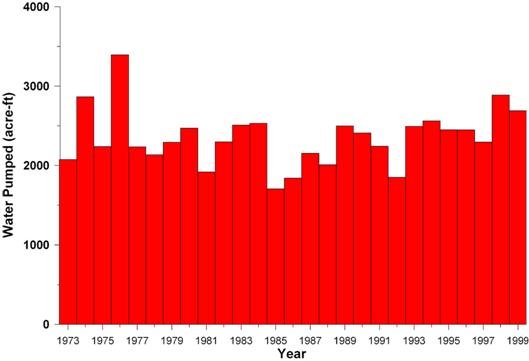
Figure HYDRO-52. Annual Water Pumped for Intrepid East Potash Mill Location
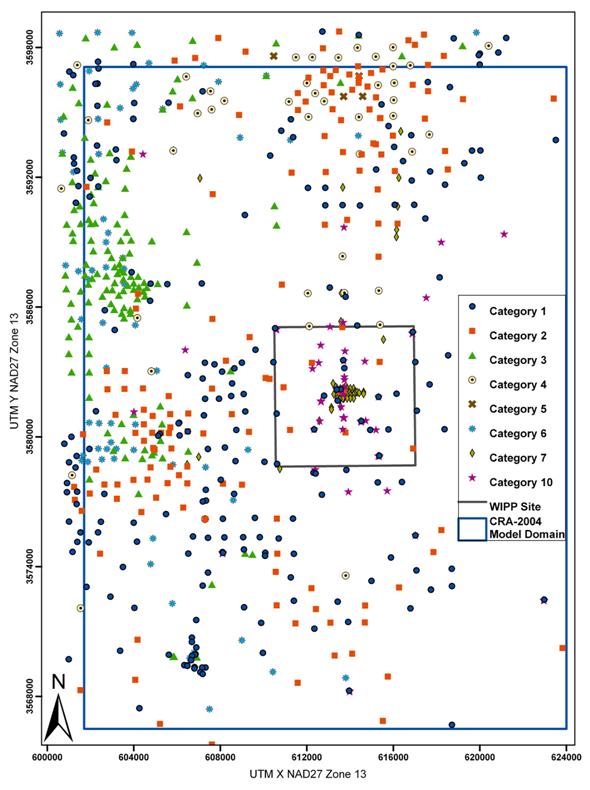
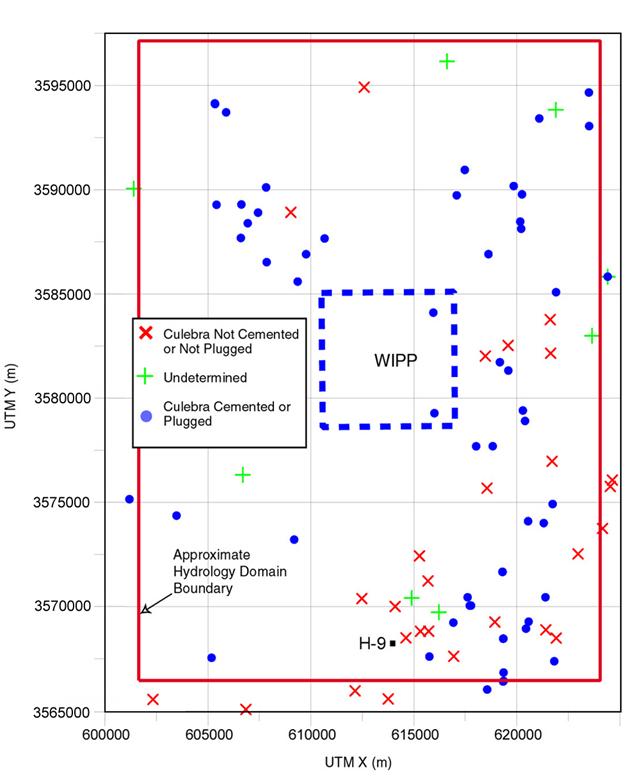
Figure HYDRO-54. Plugged and Abandoned Oil and Gas Wells Within and Near the Culebra Modeling Domain
Table HYDRO-1. Test and Analysis Plans Guiding Hydrological Studies, 2003–2007
Table HYDRO-2. Purposes of New Culebra Wells
Table HYDRO-3. Wells Plugged and Abandoned or Recompleted from 2004 to 2006
Table HYDRO-4. Hydraulic Testing in Culebra Wells from December 2003 through January 2008
Table HYDRO-5. Analytical Results for Water Samples Collected by SNL
Table HYDRO-6. Culebra Hydrochemical Facies
Table HYDRO-7. Cementing Categories for Potash and Other Drillholes in the Modeling Domain
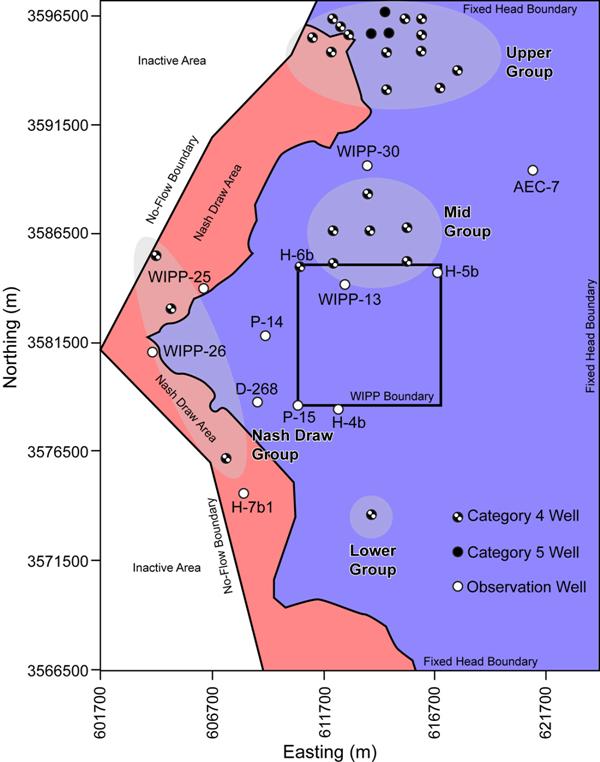
Table HYDRO-8. Options Used to Recalibrate T Fields to Leaking Boreholes
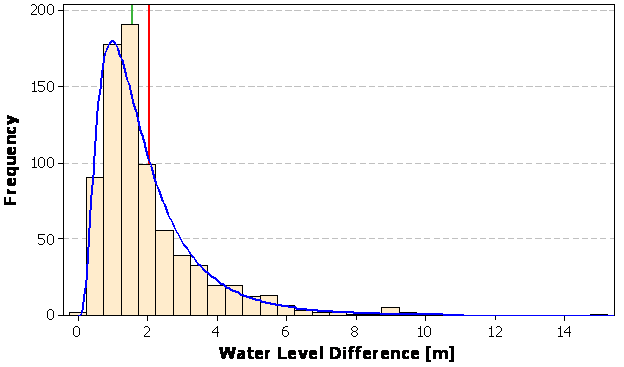
Table HYDRO-9. Option A Total Leakage Rates for Each Group of Leaky Boreholes
Table HYDRO-10. Option B Total Leakage Rates for Each Group of Leaky Boreholes
mmhos/cm micromhos per centimeter
acre-ft acre-foot
amsl above mean sea level
AP analysis plan
ASER Annual Site Environmental Report
bgs below ground surface
BLM U.S. Bureau of Land Management
CB Cabin Baby
cm centimeter
CRA Compliance Recertification Application
D diffusivity
DOE U.S. Department of Energy
EPA U.S. Environmental Protection Agency
ft feet
ft2/day square feet per day
gpm gallons per minute
HCl hydrochloric
high-T high transmissivity
hr hour
in. inch
km kilometer
L/s liters per second
low-T low transmissivity
m meter
m2/s square meters per second
m3 cubic meters
m3/s cubic meters per second
mg/L milligrams per liter
mi mile
mm millimeter
molal moles per kilogram
NR no response
P&A plugging and abandonment
PIP production-injection packer
S storativity
SNL Sandia National Laboratories
Ss specific storage
T field transmissivity field
TD total depth
T/S transmissivity and storativity
TDS total dissolved solids
TP test plan
T/S transmissivity and storativity
USGS U.S. Geological Survey
WIPP Waste Isolation Pilot Plant
WQSP Water Quality Sampling Program
WTS Washington TRU Solutions
yr year
This appendix provides a summary of the new information on Waste Isolation Pilot Plant (WIPP) hydrology collected since the September 2002 data-cutoff date for the 2004 Compliance Recertification Application (CRA-2004) (U.S. Department of Energy 2004a) through 2007, in accordance with the requirements of 40 CFR § 194.15 (U.S. Environmental Protection Agency 1996). Over that period, the U.S. Department of Energy (DOE) collected a significant amount of new information on WIPP hydrogeology, both in response to various requests from the U.S. Environmental Protection Agency (EPA) and as a result of ongoing monitoring programs. The EPA’s November 15, 2002, letter (Marcinowski 2002) requested that the DOE drill new monitoring wells completed to the Culebra Dolomite Member of the Rustler Formation (hereafter referred to as the Culebra) both north and south of the WIPP site to improve the understanding of flow properties and the causes of water-level changes. The EPA’s May 20, 2004 letter (Cotsworth 2004a) requested that a new well be drilled in the vicinity of the southeastern part of the WIPP site to establish whether high or low Culebra transmissivity existed in that area. The EPA’s September 2, 2004 letter (Cotsworth 2004b) requested that the DOE update the groundwater basin modeling and groundwater chemistry interpretations for the units above the Salado Formation.
The new hydrogeologic studies were initially laid out in a multiyear program plan for fiscal years 03-09 (Sandia National Laboratories [SNL] 2003). The overall program evolved as activities progressed, with specific activities being added and subtracted as conditions and new information warranted and as new requests were received from the EPA. A variety of test plans (TPs) and analysis plans (APs) were also written for specific activities (Table HYDRO-1). The activities performed under these plans are described in the following sections. The reader is referred to the reports cited in each section for additional, more detailed information on the work performed.
Section HYDRO-2.0 describes a modeling study used to optimize the number and locations of wells in the Culebra monitoring network. Section HYDRO-3.0 describes new wells that have been drilled and Section HYDRO-4.0 describes wells that have been plugged and abandoned since the CRA-2004. Section HYDRO-5.0 describes the water-level monitoring performed since the CRA-2004 and the changes in water levels that have been observed. Hydraulic testing and test analyses performed since the CRA-2004 are described in Section HYDRO-6.0. Section HYDRO-7.0 describes the geologic studies that have been performed since 2003, and Section HYDRO-8.0 describes the groundwater sampling and water-quality analyses performed over the same period. Section HYDRO-9.0 describes modeling exercises aimed at understanding what might be causing the observed rise in Culebra water levels. Section HYDRO-10.0 provides an integration of all the new hydrological information collected since the CRA-2004.
For general reference, Figure HYDRO-1 provides a map showing the locations of all wells discussed below. Figure HYDRO-2 and Figure HYDRO-3 are stratigraphic columns showing the geologic units discussed below.
Table HYDRO-1. Test and Analysis Plans Guiding Hydrological Studies, 2003–2007
|
Plan |
Title |
Author |
Effective Date |
|
TP 00-03 |
Chace |
2/18/03 |
|
|
TP 03-01 |
Chace and Beauheim |
1/18/06 |
|
|
TP 06-01 |
Hillesheim |
4/9/07 |
|
|
AP-070 |
Analysis Plan for Non-Salado Hydraulic-Test Interpretations, Revision 1 |
Beauheim |
10/20/04 |
|
AP-110 |
Analysis Plan for Evaluation of Culebra Water-Level-Rise Scenarios |
Beauheim |
11/11/03 |
|
AP-111 |
Analysis Plan for Optimization and Minimization of the Culebra Monitoring Network for the WIPP |
Beauheim and McKenna |
11/24/03 |
|
AP-114 |
Analysis Plan for Evaluation and Recalibration of Culebra T-Fields |
Beauheim |
10/11/04 |
|
AP-125 |
Analysis Plan for the Evaluation of Culebra Brine Compositions |
Domski and Beauheim |
8/18/05 |
Figure HYDRO-1. Locations of WIPP Wells
Figure HYDRO-2. General Stratigraphic Column of Geologic Units at the WIPP Site
Figure HYDRO-3. Detailed Rustler Formation Stratigraphy
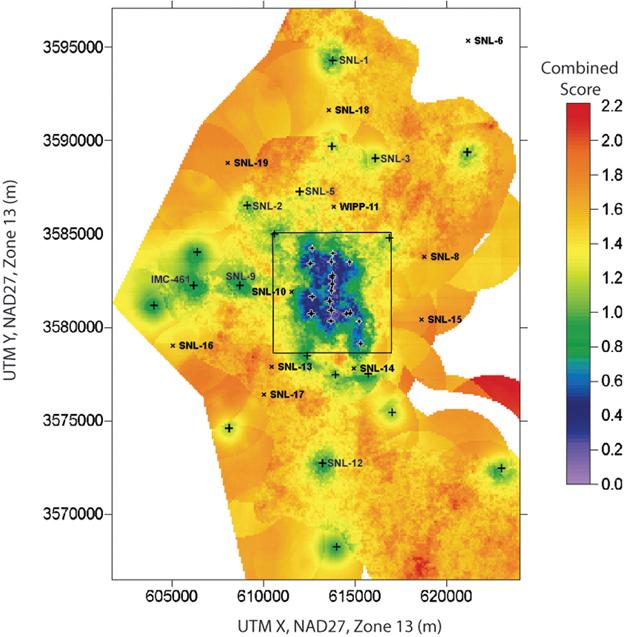
McKenna (2004) performed a well-network minimization and optimization study under AP-111, Analysis Plan for Optimization and Minimization of the Culebra Monitoring Network for the WIPP, developed by Beauheim and McKenna (2003). This study used the 100 transmissivity fields (T fields) developed for the CRA-2004 by McKenna and Hart (2003) to identify the locations where head and transmissivity data from new wells would cause the greatest reduction in uncertainty associated with calculating groundwater travel times in the Culebra from a point above the center of the WIPP disposal panels to the site boundary. McKenna (2004) used three different methods to determine the value of a well or potential well location, and then integrated the results to create “combined-score values” maps showing the relative value of additional head and transmissivity data at points throughout the modeling domain. The three methods used were geostatistical variance reduction, three-point estimation of local gradients, and spatial sampling-based sensitivity analysis.
Geostatistical variance reduction involves the use of ordinary kriging to interpolate head values between measurement points (Rouhani 1985). In addition to estimating head at a location, ordinary kriging also provides a variance about that estimate. Because the estimation variance is based on the spatial distribution of measurements, and not directly on the measurements themselves, the change in variance caused by adding an additional measurement point can be mapped over the area of interest (assuming that the underlying variogram model remains valid).
Hydraulic gradients can be estimated from head measurements at three points. Given some amount of noise (uncertainty) in the head measurements, the accuracy of the estimated gradient is dependent on the size, shape, and orientation of the triangle formed by the three measurement points. McKenna (2004) developed criteria for triangles that would provide accurate gradient estimates, and then calculated for each cell in the model grid how many new suitable triangles would be created, when combined with existing wells, by adding a well in that cell.
Spatial sampling-based sensitivity analysis was possible because 100 calibrated T fields were available for the CRA-2004, along with a calculated groundwater travel time from a point above the center of the WIPP disposal panels to the site boundary for each. By sampling on all 100 T fields, McKenna (2004) was able to calculate the sensitivity of the travel time to the head and transmissivity in every cell of the model grid. These sensitivities, however, are specific to the set of T fields used in the calculations. They do not show what the effects on travel time would be of high-T or low-T areas that are not present in any of the 100 T fields used.
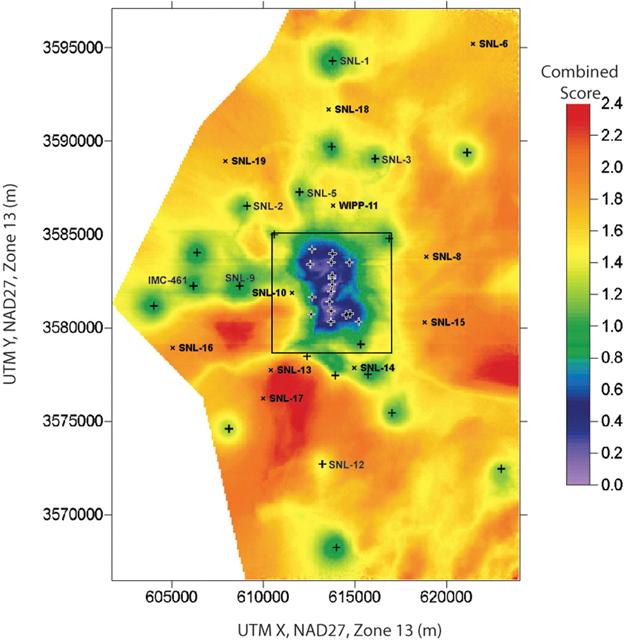
By normalizing the results from each of these analysis methods, McKenna (2004) was able to add the “scores” from each to create a combined score for each model cell, which he then mapped and contoured to show relative sensitivities. He first performed the analysis using the 30 wells for which head data were available in August 2003 (shown by the unlabeled + symbols in Figure HYDRO-4 and Figure HYDRO-5). He then included the locations of the first six “SNL” wells and IMC-461 drilled in 2003 and January 2004 (see Section HYDRO-3.0) in the geostatistical estimation variance and three-point gradient estimation procedures to produce revised combined-score values maps that were used to guide the locations of wells installed in
Figure HYDRO-4. Combined-Score Values Map From McKenna (2004) Including Estimation Variance, Number of Three-Point Estimators, and Sensitivity of Travel Time to Head. The Wells Used in the Study are Shown as + Symbols. Wells Sited Since this Map was Created are Shown as × Symbols. White Areas are Inactive Parts of Modeling Domain.
Figure HYDRO-5. Combined-Score Values Map From McKenna (2004) Including Estimation Variance, Number of Three-Point Estimators, and Sensitivity of Travel Time to Transmissivity. The Wells Used in the Study are Shown as + Symbols. Wells Sited Since this Map was Created are Shown as × symbols. White Areas are Inactive Parts of Modeling Domain or Areas Where Transmissivity Did Not Vary.
2005 and 2006 (Figure HYDRO-4 and Figure HYDRO-5). Figure HYDRO-4 combines the geostatistical variance, three-point estimation, and sensitivity of travel time to head while Figure HYDRO-5 combines the geostatistical variance, three-point estimation, and sensitivity of travel time to transmissivity.
Figure HYDRO-4 and Figure HYDRO-5 are qualitatively similar, with the differences reflecting the difference between travel-time sensitivity to head and sensitivity to transmissivity. Both figures show that additional wells in the center of the WIPP site, where many wells are already clustered, would be of little value (low sensitivity). Figure HYDRO-4 shows that the areas with the most travel-time sensitivity to head lie southwest of the WIPP. Based on these results, as well as geological and logistical considerations, new wells SNL-13, SNL-17A, and SNL-16 were drilled and now provide head information in that region, while others of the new wells provide head information in regions of moderate sensitivity. Figure HYDRO-5 shows that travel-time sensitivity to transmissivity does not differ greatly in regions distant from existing wells. SNL-8, SNL-13, SNL-15, SNL-16, SNL-17, SNL-18, SNL-19, and WIPP-11 have provided useful transmissivity information.
In something of a reversal of the process by which optimal positions for new wells were found, McKenna (2004) evaluated which wells could be eliminated without losing hydraulic head information needed to model flow through the Culebra, and which wells should be maintained in the Culebra monitoring network. He calculated the increase in head estimation variance and the decrease in the number of three-point estimators that would result from removal of each well in the existing network, and ranked the wells in order of value to the network. Wells WIPP-12 and WIPP-22 were identified as being of least value to the monitoring network, and hence candidates for plugging and abandonment (P&A), because their removal resulted in the smallest increase in head estimation variance and the smallest decrease in the number of three-point estimators. With those two wells removed from the network, the next candidates for P&A were WIPP-21 and ERDA-9. These four wells, along with a fifth well, WIPP-19, were situated along a north-south line extending about 1.6 kilometers (km) (1 mile [mi]) north from the center of the WIPP site (Figure HYDRO-1), and effectively provided an overabundance of head information within a small region. The wells identified as of most value to the monitoring network, as it then existed, were AEC-7, H-5b, WIPP-30, H-9c, and H-10c.
In summary, the monitoring network optimization study identified areas where new wells would be of value and where existing wells could be removed from the network with little loss of information. The study provided input for subsequent drilling and P&A decisions that also took factors such as costs of road construction, geologic objectives, well casing deterioration, and modeling data needs into account. The following two sections of this appendix describe the wells that were drilled (Section HYDRO-3.0) and plugged and abandoned (Section HYDRO-4.0) on the basis of the monitoring network optimization study in conjunction with these other considerations.
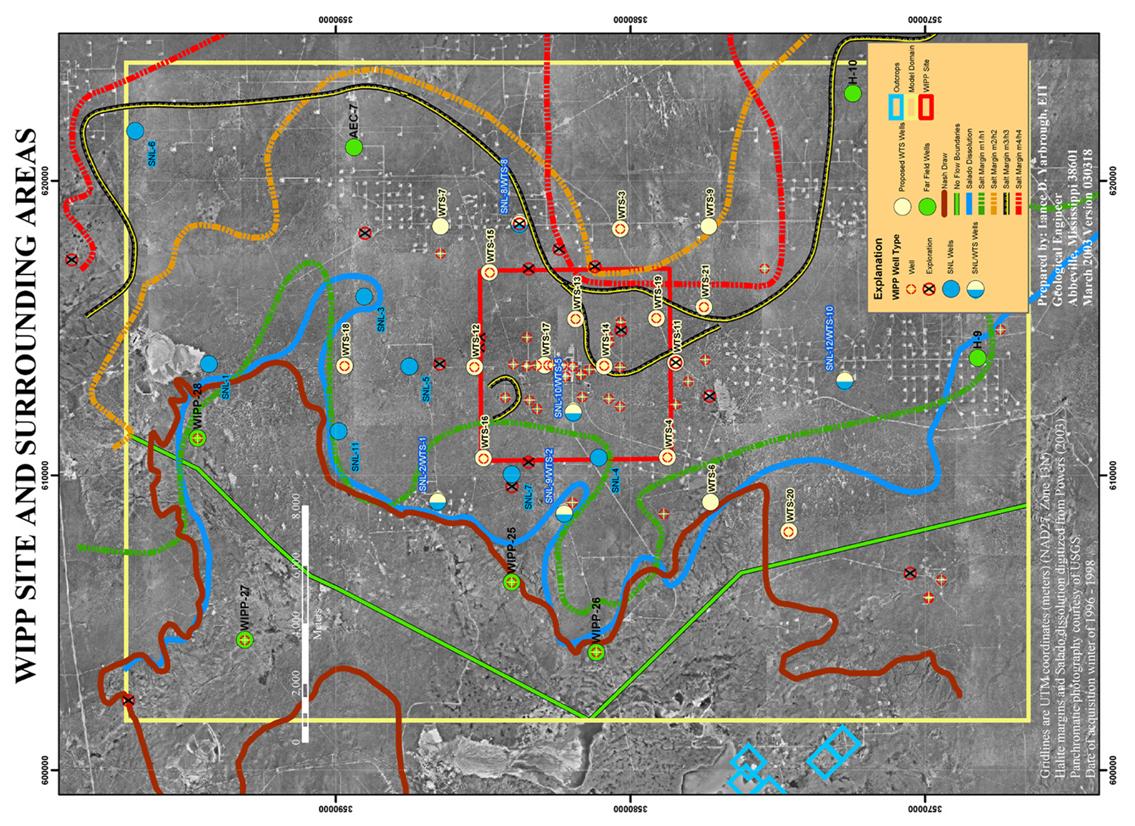
Eighteen new Culebra wells (Table HYDRO-2) were added to the monitoring network described in Section HYDRO-2.0 and shown in the CRA-2004, Chapter 2.0, Figure 2-3 and Figure 2-4 between April 2003 and October 2006. No additional Culebra wells were drilled between October 2006 and the data cutoff date for the CRA-2009 (12/31/2007). Drilling of these new wells began under a program plan (Sandia National Laboratories 2003) that included a preliminary design for a 41-well, long-term Culebra monitoring network. Twelve new wells given “SNL-#” designations were proposed in specific locations to confirm the correlations described in Powers et al. (2003) between Culebra transmissivity and various geologic conditions, provide information needed for numerical modeling, and provide information relevant to possible scenarios explaining the rise in Culebra water levels (see Section HYDRO-9.0). In addition, 21 proposed well locations given Washington TRU Solutions (“WTS-#”) designations were laid out in a geometric pattern to provide the long-term monitoring network required for the WIPP. Five of the “WTS” locations coincided with “SNL” locations, 12 coincided with existing (or previous) well locations, and 4 represented new locations. Seven existing “far-field” wells and the six Water Quality Sampling Program (WQSP) Culebra wells required by the WIPP Hazardous Waste Facility Permit were also planned to be retained. The remaining existing Culebra wells would be plugged and abandoned over time. The 35 proposed well locations exclusive of the WQSP wells are shown in Figure HYDRO-6 (originally published as Figure 8 in Sandia National Laboratories 2003), along with the Rustler halite margin information available at that time (see Figure HYDRO-3 and Section HYDRO-7.1).
The drilling program began in 2003, as SNL-2, 9, 12, and 3 were successively drilled between April and September of that year (Powers and Richardson 2003a, 2003b, 2004a, and 2004b). An unplanned well, IMC-461 (see Figure HYDRO-1), was completed in January 2004 when Mosaic Potash Carlsbad, Inc. (then known as IMC Potash Carlsbad, Inc) offered an exploratory borehole to the DOE west of the WIPP site (Beauheim 2005). SNL-1 and SNL-5 were then drilled between March and May 2004 (Powers and Richardson 2004c and 2004d) after preliminary results of the McKenna (2004) study were used to shift the final location of SNL-5 west of its originally planned location shown in Figure HYDRO-6 to an area where transmissivity information would be of more value (see Figure HYDRO-1). In September 2004, WIPP-11, an exploration hole originally drilled in 1978 (Sandia National Laboratories and U.S. Geological Survey 1982) that had lain sealed and dormant for decades, was completed in the Culebra by perforating the well casing across the Culebra interval.
Based on the work of McKenna (2004), six areas
were identified for installation of new wells: SNL-13, 15,
16, 17, 18, and 19. The precise locations of these wells
were selected to minimize the need for new road
construction. SNL-13 is approximately 1150 meters (m) (3773
feet [ft]) south and 226 m (741 ft) west of the proposed WTS-4
(which was to be on the old P-15 well pad) and takes the place of
that proposed long-term monitoring well. SNL-15 is the same
as the proposed WTS-3, situated on the old P-18 well pad.
SNL-17 is effectively the proposed WTS-6, shifted 763 m (2503 ft)
to the east and 1274 m (4180 ft) to the south. SNL-16, 18,
and 19 were sited at entirely new locations in or on the edge of
Nash Draw. SNL-14 was sited based on detailed
geologic information, independently of the work of McKenna
(2004), in response to a direct request from EPA for a well in
that vicinity (Cotsworth 2004a). SNL-13, 14, 15, 8, and 6
Table HYDRO-2. Purposes of New Culebra Wells
|
Well |
Purposes |
|
SNL-1 |
Look for potentiometric and geochemical evidence of leakage from Intrepid East tailings pile; test Culebra near margin of Salado dissolution |
|
SNL-2 |
Test Culebra near margin of Salado dissolution |
|
SNL-3 |
Confirm presence of inferred Salado dissolution reentrant and test Culebra |
|
SNL-5 |
Provide data in area of high sensitivity identified by McKenna (2004) |
|
SNL-6 |
Confirm high heads and very low-T expected in area east of M2-H2 and M3-H3 halite margins; provide head estimate for northern numerical model boundary condition |
|
SNL-8 |
Confirm low-T east of the WIPP site and look for evidence of dissolution along M3-H3 boundary |
|
SNL-9 |
Confirm presence of inferred Salado dissolution reentrant and test Culebra; provide pumping well for large-scale test west of the WIPP site |
|
SNL-10 |
Provide transmissivity data in western WIPP site near M1-H1 margin |
|
SNL-12 |
Confirm high-T expected south of WIPP site and look for evidence of Salado dissolution; provide potential pumping well for large-scale test south of the WIPP site |
|
SNL-13 |
Provide transmissivity data SW of the WIPP site near the edge of Nash Draw |
|
SNL-14 |
Specific request from EPA to confirm/disprove high-T zone extending from SE WIPP site to the south; provide pumping well for large-scale test south of the WIPP site |
|
SNL-15 |
Confirm high heads and very low-T expected in area east of M2-H2 and M3-H3 halite margins |
|
SNL-16 |
Evaluate effects of Salado dissolution on Culebra transmissivity and confinement |
|
SNL-17A |
Evaluate effects of Salado dissolution on Culebra transmissivity and confinement |
|
SNL-18 |
Evaluate effects of Salado dissolution on Culebra transmissivity and confinement; look for geochemical evidence of leakage from Intrepid East tailings pile |
|
SNL-19 |
Evaluate effects of Salado dissolution on Culebra transmissivity and confinement |
|
IMC-461 |
Well of opportunity near Nash Draw and edge of Salado dissolution |
|
WIPP-11 |
Well of opportunity that could serve as a replacement for DOE-2 and provide a pumping well for a large-scale test north of the WIPP site |
were drilled between April and September 2005 (Powers and Richardson 2008a, 2008b, and 2008c; Powers 2009a and [In progress]a) and SNL-16, 19, 10, 18, and 17A (the original SNL-17 had to be abandoned and redrilled) were drilled between April and July 2006 (Powers 2009b, [In progress]b, 2009c, [In progress]c, and [In progress]d).
Most of the new wells encountered geologic conditions typical for boreholes drilled at the WIPP. Six wells, however, encountered atypical (although not necessarily unpredicted) conditions. SNL-6 and SNL-15, the only two wells drilled on the eastern (halite) side of the Rustler M2-H2 and M3-H3 halite margins (see Figure HYDRO-3) (Powers 2007, Section HYDRO-7.1), encountered halite in the Culebra (Powers et al. 2006a), as predicted by Holt (1997). At SNL-1, a 0.6-m (2-ft) drilling bit drop occurred while drilling through the Culebra, and drilling fluid circulation was temporarily lost (Powers and Richardson 2004c). In addition, brine was encountered at a depth of approximately 11 m (36 ft) in the upper Dewey Lake in this drillhole located immediately south of the Intrepid (formerly Mississippi) East tailings pile (see
Figure HYDRO-6). High brine flows were encountered in a sandy, poorly indurated section of the M1 unit of the Los Medaños Member of the Rustler Formation in SNL-13, a first-of-its-kind encounter (Powers and Richardson 2008a). None of these conditions affected proper completion of the wells.
At SNL-17, sulfate beds of the Forty-niner Member of the Rustler were not distinguishable in either cuttings or geophysical logs, and the Magenta dolomite was altered. The cuttings indicate Dewey Lake above this zone, and the uppermost Rustler was apparently altered and partially dissolved along the Nash Draw escarpment that marks upper Salado dissolution. A 0.6-m (2-ft) drilling bit drop occurred while drilling through the lower Tamarisk in SNL-17 (Powers [In progress]d). High water production from the Culebra and problems with the core barrel sticking below the Culebra led to the decision to stop drilling and complete SNL-17 without drilling to the top of Salado as planned. Several cubic meters (m3) of gravel were required to fill voids in the Tamarisk (and possibly Culebra) when gravel-packing the well screen. SNL-17 could not be completed with certain isolation of the Culebra, so it was plugged and abandoned. A replacement well (SNL-17A) was drilled on the pad and successfully completed for monitoring.
SNL-18 (Powers [In progress]c) was drilled along the escarpment in the northeast arm of Nash Draw. Water was encountered while drilling the Dewey Lake. The Forty-niner Member of the Rustler is represented by poorly preserved gypsite in a zone of very poor core recovery; a tool drop of 0.3 m (1 ft) also occurred near the contact with the Dewey Lake. Short recovered intervals of the Magenta revealed high dips to the bedding. Little, if any, of the upper Tamarisk sulfate (A3) was recovered, as circulation of drilling fluid was limited or lost. The lower Tamarisk and upper Culebra were partially recovered in cores. A large amount of drilling mud was lost when drilling the well. Sections above the Culebra were cemented and redrilled to provide additional hole stability. An earlier attempt by Intrepid (then known as New Mexico Potash) to drill a potash exploration hole at the location of SNL-18 encountered drilling difficulties and was abandoned before reaching the Rustler.
SNL-4, 7, and 11 and WTS-7 and 9 are not currently planned to be drilled because McKenna (2004) did not show them to be in high-value locations. WTS-18 (planned replacement for WIPP-30 when that well has to be plugged and abandoned) and WTS-20 (planned replacement for H-7) will also likely never be drilled because of the presence of SNL-18 and SNL-17A, respectively. Final decisions on replacement of these wells and the wells designated as “Far Field” on Figure HYDRO-6 have not been made. In addition, use of the “WTS” designation has been abandoned—all wells at new locations are given “SNL” designations, while replacement wells will be given the original well name with an “R” appended (e.g., H-15R).
Figure HYDRO-6. Air-Photo Map From Sandia National Laboratories (2003, Figure 8) Showing Locations Proposed for SNL-and WTS-Series Wells
Until 1994, all wells installed for WIPP were constructed with steel well casing. Exposure to brine caused the steel casing to deteriorate, necessitating the P&A of many wells. In addition, having multiple Culebra wells on the same drilling pad (which were originally installed for now-completed testing purposes) is of little value for long-term monitoring. Hence, casing integrity was evaluated in all wells on the multiple-well drilling pads, and the most deteriorated wells were scheduled for P&A. Finally, the network optimization study performed by McKenna (2004) identified WIPP-12, WIPP-21, and WIPP-22 as being of little value to the monitoring network, and hence candidates for P&A.
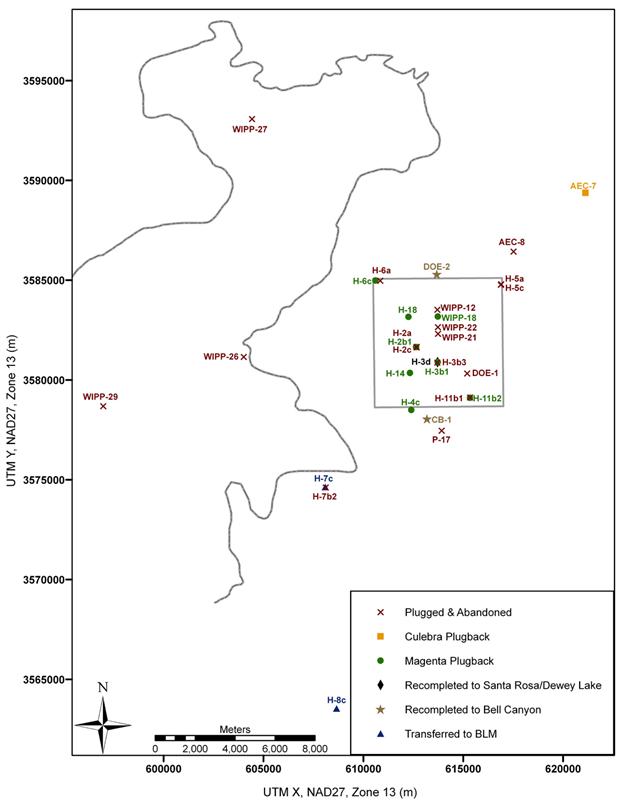
Since the CRA-2004, 17 wells have been plugged and abandoned (Salness 2006 and 2007). Three other wells have been permanently recompleted to monitor different horizons (Salness 2005a, 2005b, and 2006). Eight wells monitoring the Magenta, but with the capability to also monitor the Culebra, were plugged back to provide simpler, and irreversible, Magenta completions (Salness 2006). In addition, the lower uncased Salado-Castile portion of AEC-7 was plugged back so that a bridge plug would no longer be required in the well to monitor the Culebra (Salness 2005c). Well H-7c, completed to the Culebra, and well H-8c, completed across the Rustler-Salado contact, were transferred to the Bureau of Land Management (BLM) for use in their range-management program. These well activities are summarized in Table HYDRO-3, and the well locations are shown in Figure HYDRO-7.
|
Table HYDRO-3. Wells Plugged and Abandoned or Recompleted from 2004 to 2006 |
||||
|
Well |
Interval(s) Previously Monitored |
Activity |
Date of Activity |
Current Interval Monitored |
|
AEC-7 |
Culebra |
Plugback |
Mar.-Apr. 2004 |
Culebra |
|
AEC-8 |
Bell Canyon |
P&A |
April 2005 |
— |
|
CB-1 |
Culebra and Bell Canyon |
Recompleted |
Jan.-Feb. 2004 |
Bell Canyon |
|
DOE-1 |
Culebra |
P&A |
September 2006 |
— |
|
DOE-2 |
Culebra and Magenta |
Recompleted |
Feb.-Mar. 2004 |
Bell Canyon |
|
H-2a |
Culebra |
P&A |
April 2005 |
— |
|
H-2b1 |
Culebra and Magenta |
Plugback |
April 2005 |
Magenta |
|
H-2c |
Culebra |
P&A |
April 2005 |
— |
|
H-3b1 |
Culebra and Magenta |
Plugback |
June 2005 |
Magenta |
|
H-3b3 |
Culebra |
P&A |
June 2005 |
— |
|
H-3d |
Forty-niner and |
Recompleted |
June 2005 |
Santa Rosa- |
|
H-4c |
Culebra and Magenta |
Plugback |
May 2005 |
Magenta |
|
H-5a |
Culebra |
P&A |
June 2005 |
— |
|
H-5c |
Culebra & Magenta |
Plugback/P&A |
June 2005 |
(inadvertently plugged Magenta too) |
|
H-6a |
Culebra |
P&A |
May 2005 |
— |
|
H-6c |
Culebra and Magenta |
Plugback |
May 2005 |
Magenta |
|
Table HYDRO-3. Wells Plugged and Abandoned or Recompleted from 2004 to 2006 (Continued) |
||||
|
Well |
Interval(s) Previously Monitored |
Activity |
Date of Activity |
Current Interval Monitored |
|
H-7b2 |
Culebra |
P&A |
May 2005 |
— |
|
H-7c |
Culebra |
Transferred to BLM |
August 2005 |
— |
|
H-8c |
Rustler-Salado |
Transferred to BLM |
September 2005 |
— |
|
H-11b1 |
Culebra |
P&A |
May 2005 |
— |
|
H-11b2 |
Culebra and Magenta |
Plugback |
May 2005 |
Magenta |
|
H-14 |
Culebra and Magenta |
Plugback |
April 2005 |
Magenta |
|
H-18 |
Culebra and Magenta |
Plugback |
May 2005 |
Magenta |
|
P-17 |
Culebra |
P&A |
August 2006 |
— |
|
WIPP-12 |
Culebra |
P&A |
July 2005 |
— |
|
WIPP-18 |
Culebra and Magenta |
Plugback |
May 2005 |
Magenta |
|
WIPP-21 |
Culebra |
P&A |
May 2005 |
— |
|
WIPP-22 |
Culebra |
P&A |
May 2005 |
— |
|
WIPP-26 |
Culebra |
P&A |
October 2006 |
— |
|
WIPP-27 |
Culebra |
P&A |
August 2006 |
— |
|
WIPP-29 |
Culebra |
P&A |
May 2005 |
— |
Figure HYDRO-7. Locations of Plugged and Abandoned and Recompleted Wells
Groundwater monitoring activities at the WIPP are carried out under the Waste Isolation Pilot Plant Environmental Monitoring Plan (U.S. Department of Energy 2004b) and under Test Plan TP 06-01, Monitoring Water Levels in WIPP Wells (Hillesheim 2007). The first monitoring program consists of monthly water-level measurements in all accessible wells, with results reported in the Annual Site Environmental Reports (ASERs) (U.S. Department of Energy 2004c, 2005, 2006, 2007, and 2008). The second monitoring program involves both periodic water-level measurements and continuous measurement (typically at one-hour [hr] intervals) of fluid pressure in wells instrumented with downhole pressure gauges (TROLL®).
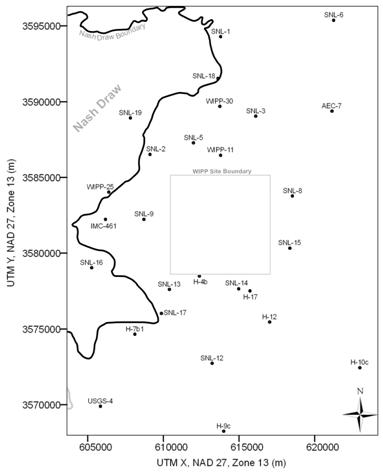
Water-level monitoring provides a general picture of the changes in hydraulic head occurring in the formations being monitored. Water levels are currently being monitored in the Culebra and Magenta Members of the Rustler, the Dewey Lake (Redbeds), and the Bell Canyon. The monitored well locations are shown in Figure HYDRO-8, Figure HYDRO-9, andFigure HYDRO-10. Wells in which monitoring has ceased since January 2004 are listed in Table HYDRO-3.
In addition to monitoring Culebra water levels, DOE monitors the fluid pressure in many wells with TROLL® gauges. The Culebra wells instrumented with TROLL® gauges are listed in Figure HYDRO-11, which shows the periods of time from October 2002 through 2007 during which the TROLL® gauges were installed. The continuous fluid-pressure measurements made using TROLL® gauges provide a clearer, more complete record of the changes in hydraulic head occurring in the wells than is provided by monthly water-level measurements.
Figure HYDRO-12 shows the TROLL® and water-level data from Culebra well WIPP-26 in Nash Draw from November 2003 through October 2006. The TROLL® pressure data show that what previously appeared to be random noise in the water-level data actually has a consistent underlying structure. Furthermore, the pressure data show a series of downward spikes and rapid recoveries, with the recoveries exceeding the prespike levels in many cases. Having a high temporal level of resolution in the head data is essential in understanding the causes of these head changes. By plotting daily rainfall measured at the WIPP rain gauge near the center of the WIPP site in parallel with the TROLL® pressure data from WIPP-26 (Figure HYDRO-13), it was discovered that the spikes in pressure correlate with rainfall events of approximately 10 millimeters (mm) (0.4 inches [in.]) or more in 24 hours (hrs). (Note that thunderstorms can be highly localized, and that any individual rain gauge may not always reflect rain that falls at remote wells.) It is hypothesized that rainfall accumulates in a localized area in Nash Draw, increasing the load on the Culebra at that location. The strata above the Culebra appear to act as a lever, with the increased load at the accumulation location causing a decreased load at WIPP-26. This effect seems to dissipate within approximately one day, usually followed by an increase in Culebra head related to the precipitation event, and then a gradual falloff in head. This phenomenon of precipitation causing an initial drop in pressure is also observed at well IMC-461 at approximately the same magnitude as at WIPP-26, and sometimes at WIPP-25 at a much smaller magnitude. No other wells show this response to rainfall.
Figure HYDRO-8. Locations of Culebra Monitoring Wells Outside the WIPP Site as of 1/1/2008
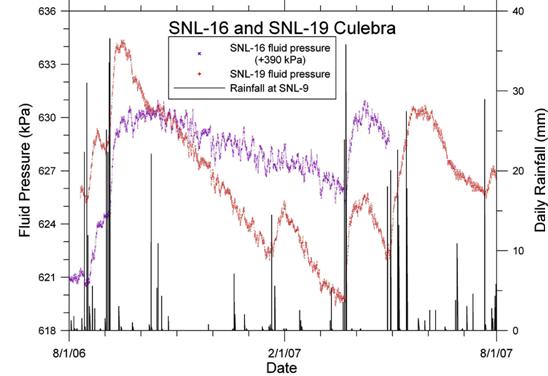
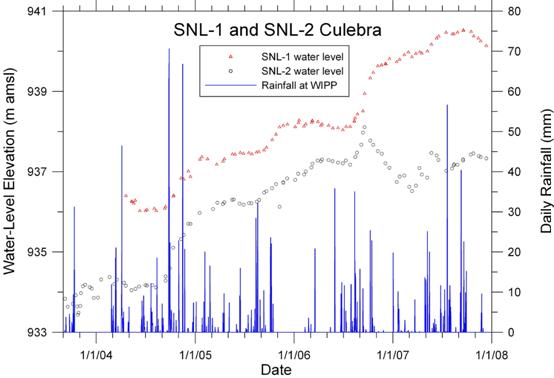
The high-resolution TROLL® pressure data have shown that two other wells in Nash Draw, SNL-16 and SNL-19 (Figure HYDRO-14), respond rapidly to rainfall events without showing the initial pressure decrease evident at WIPP-26 and IMC-461. (Note that the measured pressure is relative to the position of a TROLL® in a well, which differs among wells.) Two wells on the edge of Nash Draw, SNL-1 and SNL-2, show more gradual responses to major storms (Figure HYDRO-15). Thus, the Culebra appears to be unconfined in at least parts of Nash Draw, probably because of a combination of dissolution, collapse, and fracturing of the overlying units that act as confining beds under Livingston Ridge. This is not to say, however, that present-day rainfall actually enters the Culebra wherever a pressure response to rainfall is observed. Rather, the rainfall reaches a water table in a higher stratigraphic unit that is in sufficient hydraulic communication with the Culebra to transmit a pressure response rapidly.
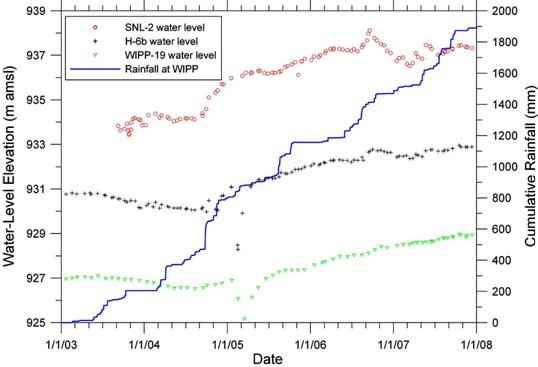
Once the head in the Culebra is increased in Nash Draw, a pressure transient propagates through the confined Culebra under Livingston Ridge and across the WIPP site over the following days to months (Hillesheim, Hillesheim, and Toll 2007), decreasing in magnitude as it goes. This can be seen in Figure HYDRO-16, which shows water levels measured in three wells with discrete rises associated with rainfall events becoming less distinct with increasing distance from Nash
Figure HYDRO-9. Locations of Culebra Monitoring Wells Within the WIPP Site as of 1/1/2008
Draw (top to bottom in Figure HYDRO-16; see Figure HYDRO-8 and Figure HYDRO-9 for well locations). Unlike the responses seen in wells in Nash Draw, however, where the water level declines with time after rainfall-induced rises, the water levels in wells outside of Nash Draw show little decline but instead seem to show a sustained, long-term rise (compare Figure HYDRO-14 with Figure HYDRO-15 and Figure HYDRO-16). This may indicate that something in addition to rainfall in Nash Draw is affecting these wells. Section HYDRO-9.0 describes the modeling of different scenarios to explain this long-term rise in water levels.
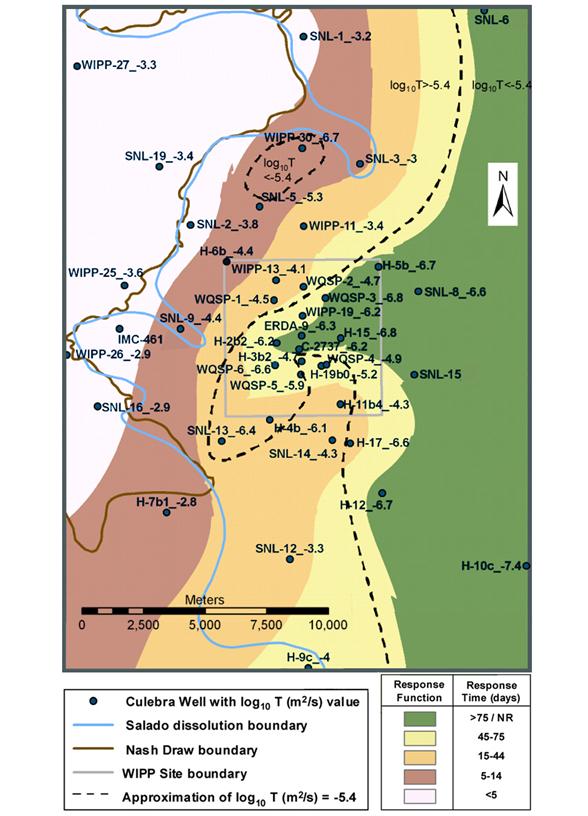
Hillesheim, Hillesheim, and Toll (2007) evaluated the lag time between major rainfall events and water-level (or pressure) responses in wells around WIPP. They determined lag times for 34 wells after a large September 25, 2004, rainfall and for 27 wells after an August 15, 2006, storm, both of which occurred over extensive areas in and around Nash Draw, grouping them into five time ranges. Figure HYDRO-17 shows the spatial distribution of wells in the different lag-time ranges, along with the log10 transmissivity (square meters per second [m2/s]) values for all Culebra wells. Also shown is a dashed line indicating the approximate contour of where the Culebra log10 transmissivity is -5.4, which is the approximate dividing line between fractured (double-porosity) and porous-medium hydraulic behavior in the Culebra (Holt, Beauheim, and Powers 2005). The lag-time ranges generally parallel this contour, and lag times are particularly long where the Culebra is unfractured and has a log10 transmissivity less than -5.4. This pattern is consistent with diffusive propagation of a pressure wave from Nash Draw to the east.
Figure HYDRO-10. Locations of Non-Culebra Monitoring Wells as of 1/1/2008
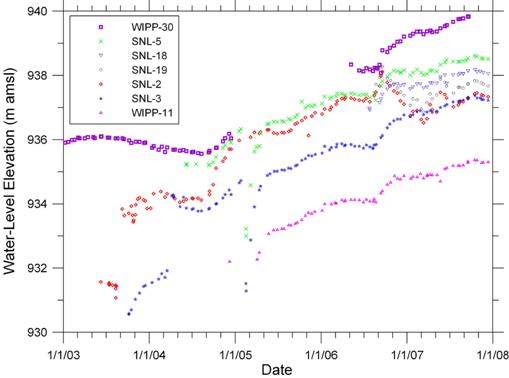
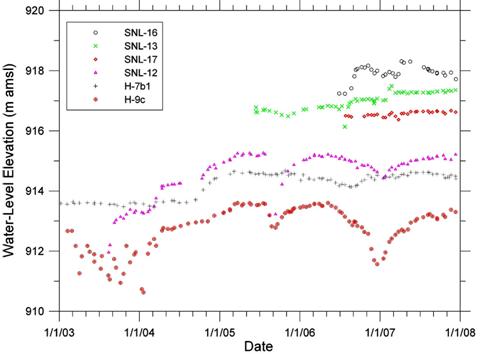
Figure HYDRO-18, Figure HYDRO-19, Figure HYDRO-20, Figure HYDRO-21, Figure HYDRO-22, Figure HYDRO-23, and Figure HYDRO-24 show the hydrographs from almost all Culebra wells monitored by the WIPP for the period from 2003 through 2007. No representative data were collected from AEC-7 over this period because of a leaking plug in the well, and H-15 was usually configured in such a way as to preclude Culebra water-level measurements. Figure HYDRO-18 and Figure HYDRO-19 show the hydrographs from seven Culebra wells north of the WIPP site and from seven Culebra wells in the northern portion of the WIPP site, respectively. The hydrographs from these 14 wells generally parallel one another, as well as the hydrograph from SNL-1 shown in Figure HYDRO-15. The seven wells with data going back to the beginning of 2003 show an early rise in 2003 followed by a decline that lasted until the second half of 2004, after which water levels again began to rise and generally showed more inflections than had been previously observed. These inflections are also seen in the hydrographs of the seven newer wells. The most pronounced of these inflections is the rise that occurred after the major rainstorms of mid-August and early September 2006. As discussed above, the inflections are more subtle in the wells farther from Nash Draw: WIPP-19 and H-2b2 (Figure HYDRO-19). Of the wells shown that existed at the time of the WIPP-11 19-day pumping test (February 1–20, 2005; see Section HYDRO-6.0), all but SNL-2 and H-2b2 showed drawdowns in response to the pumping. From late 2006 through 2007, SNL-2 (on the edge of Nash Draw) and SNL-19 (in Nash Draw) showed erratic behavior in contrast to the sustained water-level rise seen in the other wells (see also Figure HYDRO-14 and Figure HYDRO-15).
Figure HYDRO-11. Time Periods During Which Culebra Wells Have Been Monitored Using TROLL® Gauges
Figure HYDRO-12. WIPP-26 Culebra TROLL® and Water-Level Data
Figure HYDRO-13. WIPP-26 Culebra Fluid Pressure With Daily Rainfall Measured at the WIPP
Figure HYDRO-14. SNL-16 and SNL-19 Culebra Fluid Pressures With Daily Rainfall Measured at SNL-9
Figure HYDRO-15. SNL-1 and SNL-2 Culebra Water Levels With Daily Rainfall Measured at the WIPP
Figure HYDRO-16. SNL-2, H-6b, and WIPP-19 Culebra Water Levels With Cumulative Rainfall Measured at the WIPP
Figure HYDRO-17. Map of Culebra Lag-Time Response to Major Rainfall Events (from Hillesheim, Hillesheim, and Toll 2007). “NR” Denotes No Response.
Figure HYDRO-18. Water Levels in Seven Culebra Wells North of the WIPP Site
Figure HYDRO-19. Water Levels in Seven Culebra Wells in the Northern Portion of the WIPP Site
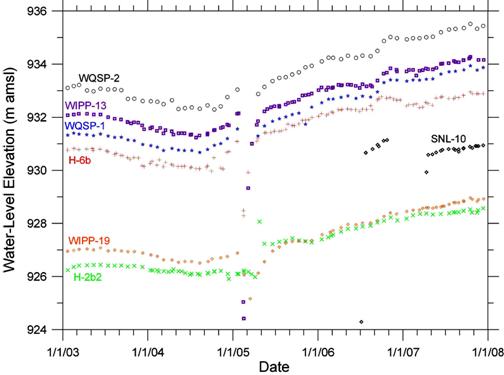
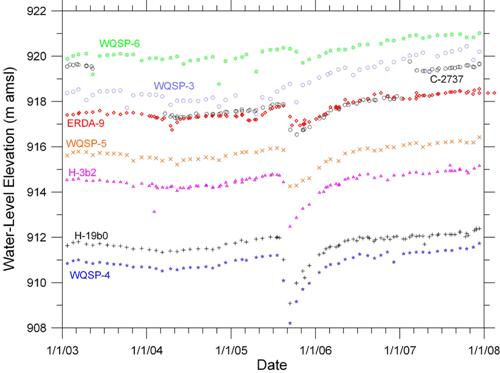
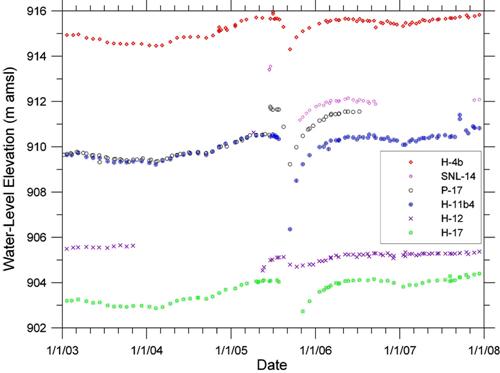
Figure HYDRO-20 and Figure HYDRO-21 show hydrographs from eight Culebra wells in the central portion of the WIPP site and six Culebra wells to the south of the WIPP site, respectively. The hydrographs from these 14 wells parallel one another, and are similar to the hydrograph for H-2b2 shown in Figure HYDRO-19. These wells did not respond to the WIPP-11 pumping test as the northern wells did, but (with the exception of WQSP-3) responded instead to the 22-day pumping test conducted at SNL-14 from August 4–26, 2005 (see Section HYDRO-6.0). Water levels in these 14 wells were generally more stable than the water levels in the northern wells, in particular showing less rise in 2006 and 2007.
Figure HYDRO-22 shows hydrographs from six Culebra wells in or near the southeastern arm of Nash Draw. With the exception of a possible rise in SNL-13, these wells show no consistent water-level trends. As described in the discussion of Figure HYDRO-14, SNL-16 responds to major rainfall events. The seemingly erratic behavior of H-9c in 2003 is ascribed to pumping of the nearby Engle stock well. Some sustained pumping appears to have occurred in that vicinity in the latter part of 2006 as well, seen most clearly in the H-9c hydrograph but also recognizable in the hydrographs from SNL-12, H-17, H-11b4, and H-4b (Figure HYDRO-21). SNL-12 and H-9c also responded to the August 2005 SNL-14 pumping test.
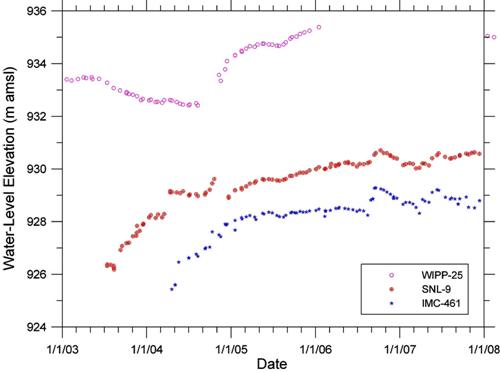
Figure HYDRO-23 shows hydrographs from three Culebra wells west of the WIPP site; IMC-461, SNL-9, and WIPP-25. The Culebra was not accessible for water-level measurements in WIPP-25 after January 2006 because of Magenta testing activities. The major upturns in water levels represent delayed responses to major rainfall events (see also Figure HYDRO-31 and Figure HYDRO-32 for WIPP-25). The general water-level trends are upward, but from late 2006 through 2007, water levels at IMC-461 and SNL-9 followed the pattern observed at SNL-2 and SNL-19 (Figure HYDRO-14 and Figure HYDRO-15) of rising after major storms followed by falloffs of similar magnitude.
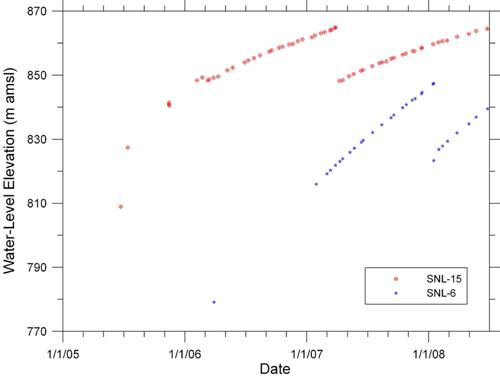
Figure HYDRO-24 shows hydrographs from Culebra wells SNL-6 and SNL-15. These wells were drilled in areas where the Culebra contains halite cements (Powers et al. 2006a), and are recovering very slowly from well-development activities (and a March 30, 2007, slug test in SNL-15). At the rates at which these wells are recovering, water levels will not be representative of undisturbed Culebra conditions for many years. SNL-15 is on the old P-18 well pad. The Culebra water level in P-18 was monitored for 25 years (1977–2001) and rose from an elevation of approximately 741 m (2432 ft) above mean sea level (amsl) (Mercer and Orr 1979) to 964.4 m (3164 ft) amsl (Westinghouse TRU Solutions, LLC 2002) before the well was plugged and abandoned without the water level stabilizing.
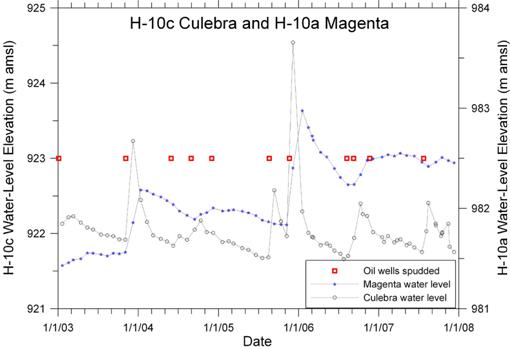
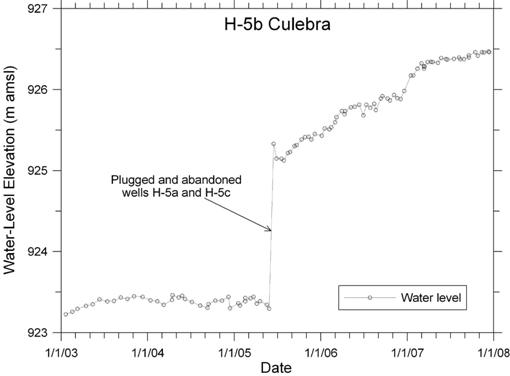
Water levels are also locally affected by human activities around WIPP. For instance, water levels in well H-10c are affected by the drilling of nearby oil wells (Figure HYDRO-25). Invasion of drilling fluid as oil wells penetrate the Culebra briefly causes water levels at H-10c to rise. The water level then falls when the Rustler interval is cased and cemented. Similar responses have been observed in well H-6b (Hillesheim and Beauheim 2007). Water levels in H-5b were apparently affected by the P&A of H-5a and H-5c approximately 30 m away. The P&A activities caused the water level in H-5b to rise by nearly 2 m (6.7 ft) (Figure HYDRO-26). (Note that the subsequent sustained rise in water level is consistent with the water-level behavior observed in most other wells at the WIPP site, such as H-6b and WIPP-19 [Figure HYDRO-16], and is probably not, therefore, related to the P&A activities.) Water levels in other wells were
Figure HYDRO-20. Water Levels in Eight Culebra Wells in the Central WIPP Site
Figure HYDRO-21. Water Levels in Six Culebra Wells South of the WIPP Site
Figure HYDRO-22. Water Levels in Six Culebra Wells in and Near the Southeastern Arm of Nash Draw
Figure HYDRO-23. Water Levels in Three Culebra Wells West of the WIPP Site
Figure HYDRO-24. Water Levels in Culebra Wells SNL-6 and SNL-15
affected by cleaning and rehabilitation activities (scraping scale from casing, removing sloughed materials from the bottom of a well, etc.).
Magenta water levels were monitored in 17 wells during some or all of the period from 2003 through 2007. The 15 wells still being monitored at the end of 2007 are shown in Figure HYDRO-10. The Magenta is no longer being monitored in DOE-2 and H-5c (see Table HYDRO-3). Water levels in most of the Magenta wells were significantly disrupted by a variety of activities at one time or another between 2003 and 2007.
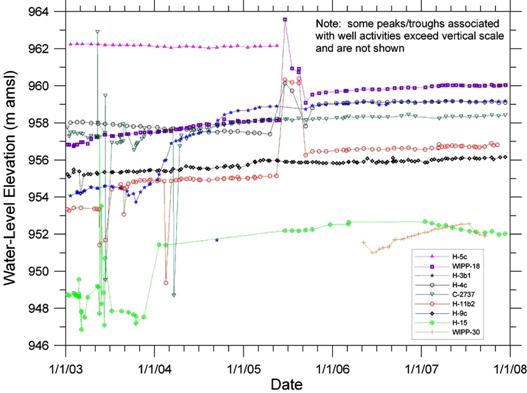
Figure HYDRO-27 shows hydrographs from nine of the Magenta wells. Of these wells, H-9c was disturbed the least over the period shown, as the only activity in the well was the replacement of a bridge plug set below the Magenta with a production-injection packer (PIP) on tubing to allow simultaneous monitoring of the Magenta and Culebra in March 2003. Over the 5-yr period shown, the Magenta water level in H-9c rose by approximately 1 m (3.2 ft). C-2737 and H-15 are also dual-completion (Magenta and Culebra) wells that were disrupted by removing or replacing bridge plugs and PIPs for a variety of testing and water-quality sampling exercises. Changes in fluid density are often associated with replacement of bridge plugs and PIPs. The Magenta water level in C-2737 appeared to be rising slightly, while that in H-15 declined in 2007. A variety of activities occurred in WIPP-30 from 2003 through early 2006 preventing measurement of Magenta water levels. When monitoring resumed, water levels rose slightly until mid-2007.
Figure HYDRO-25. H-10c Culebra and H-10a Magenta Water Levels With Spud Dates for Oil Wells Within 1.0 km
Figure HYDRO-26. H-5b Culebra Water Levels
Figure HYDRO-27. Water Levels in Nine Magenta Wells
H-3b1, H-4c, H-5c, H-11b2, and WIPP-18 had similar configurations in 2003—they had all been drilled past the Magenta, were open to both the Magenta and Culebra (and also the Rustler-Salado contact in the case of H-3b1, H-4c, and H-5c), and had bridge plugs set below the Magenta to isolate the interval(s) below. In mid-2005, the bridge plugs were removed from these wells, and the lower portions of the holes were cemented up to depths 3.7 to 8.5 m (12 to 28 ft) below the Magenta (Salness 2006). (In the case of H-5c, the entire Magenta interval of the well was also cemented by mistake, ending its usefulness as a monitoring well.) The cementing operations displaced the water in the wells to higher levels. This caused water to enter the Magenta thereby dissipating the excess head. Several months later, before pressure equilibration was reached, the wells were bailed to remove the cement-contaminated water, and water flowed back out of the Magenta to reestablish equilibrium. For H-4c, H-11b2, and WIPP-18, the water flowing into the well had a lower specific gravity than the water that had been in the well previously, causing the water level to stabilize at a higher elevation. All four of the plugged-back wells showed slight increases in Magenta water levels in 2006 and 2007.
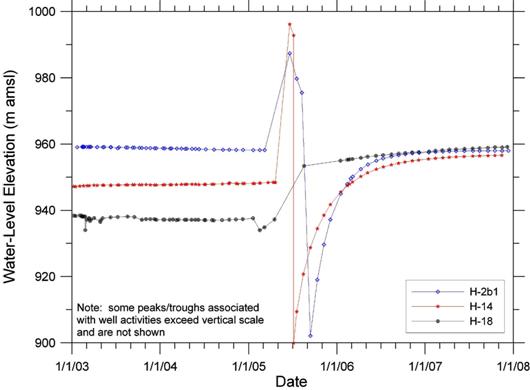
Figure HYDRO-28 shows hydrographs of Magenta water levels in H-2b1, H-14, and H-18. These wells were plugged back and then bailed in a similar fashion to the five wells discussed above (Salness 2006). In H-2b1 and H-14, the recovery from bailing took over a year to complete, reflecting the low-T of the Magenta. The postplugback water-level behavior in H-18 was quite different from the preplugback behavior. Postplugback, the water level quickly reached a level ~16 m (53 ft) higher than it was preplugback, and then continued to rise steadily through 2006 and 2007. A 16-m (53 ft) change in water levels cannot be explained by a change in the specific gravity of the water in the well. The most likely explanation for the change is that the inflatable bridge plug set in the well in 2001 to isolate the Culebra from the Magenta was leaking, allowing Magenta head to bleed into the Culebra. Magenta water levels from 2001 through 2004 were within 6 m (20 ft) of the last water level measured in the Culebra in 2001, an unusually small difference between Magenta and Culebra water levels. The difference between the Magenta water levels observed since the Culebra portion of the hole was plugged with cement and the 2001 Culebra water level is much more consistent with the differences typically observed at locations such as the H-2 hydropad or WIPP-18. Hence, water levels representative of the Magenta at H-18 may only now be measured.
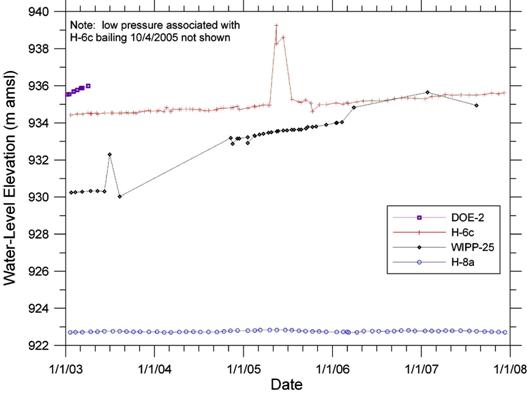
Figure HYDRO-29 shows Magenta water levels in DOE-2, H-6c, H-8a, and WIPP-25. The period of record in DOE-2 is short, and shows only a rising trend. Water levels in H-6c show a steady rising trend, little affected by the plugback and subsequent bailing that occurred in 2005. The Magenta water level in H-8a was stable for the entire period shown. Measurement of Magenta water levels in WIPP-25 was repeatedly interrupted by various activities in the well. Water levels rose steadily through 2005, the longest continuous period of measurement.
Magenta water levels measured in well H-10a are shown in Figure HYDRO-25. Water levels clearly increased in response to drilling of nearby oil and gas wells.
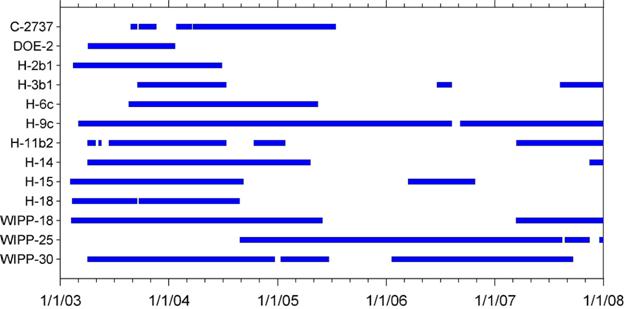
TROLL® downhole pressure gauges were installed in 13 of the Magenta wells during the periods shown in Figure HYDRO-30. The TROLL® data are consistent with the water-level measurements made in those wells. The TROLL® data provide a more complete record of pumping, water-quality sampling, and other activities in the wells than the water-level data alone.
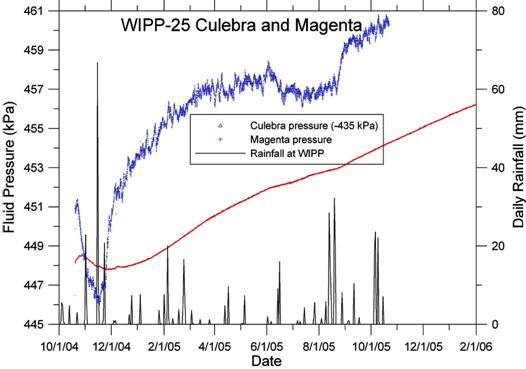
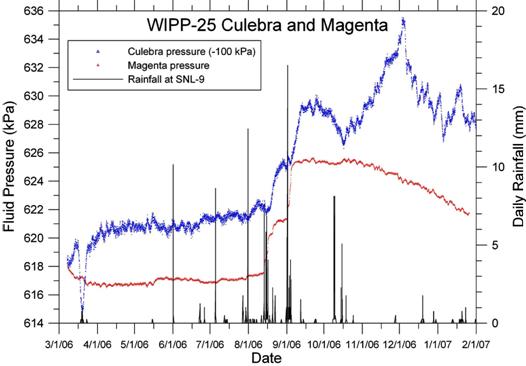
In WIPP-25, the TROLL® data also show that the Magenta there responds to some major rainfall events. Figure HYDRO-31 and Figure HYDRO-32 show the TROLL® records from both the Magenta and Culebra in WIPP-25 from October 2004 through January 2006 and March 2006 through January 2007, respectively, along with daily rainfall measured at the WIPP and at the SNL-9 pad (Figure HYDRO-32 only). (Note that the pressures measured are relative to the TROLL® positions and do not imply anything about the hydraulic gradient between the Culebra and Magenta.) Whereas the Culebra clearly responded to the rainfall events in November 2004 (which occurred when the Culebra was being drawn down by the 32-day pumping test at SNL-9; see Section HYDRO-6.0) and August 2005 (Figure HYDRO-31), the Magenta showed only delayed increases in the rate of pressure rise. The Magenta pressure clearly responded, however, to the rainfall events that occurred in mid-August 2006 and the first four days of September 2006, as did the Culebra pressure (Figure HYDRO-32). Neither zone, however, appears to have responded to the storm on June 1, 2006, and the Magenta appears to have responded little if at all to the series of rainfall events beginning on October 9, 2006, and to the rainfall on July 31, 2006. This may indicate that less rain fell near WIPP-25 than at the measurement locations. No other TROLL® data from Magenta wells indicate a response to rainfall.
Figure HYDRO-28. Magenta Water Levels in Wells H-2b1, H-14, and H-18
Figure HYDRO-29. Magenta Water Levels in Wells DOE-2, H-6c, H-8a, and WIPP-25
Figure HYDRO-30. Time Periods During Which Magenta Wells Have Been Monitored Using TROLL® Gauges
Figure HYDRO-31. WIPP-25 Culebra and Magenta Fluid Pressures from October 2004 Through January 2006 with Daily Rainfall Measured at the WIPP
Figure HYDRO-32. WIPP-25 Culebra and Magenta Fluid Pressures from March 2006 Through January 2007 with Daily Rainfall Measured at SNL-9
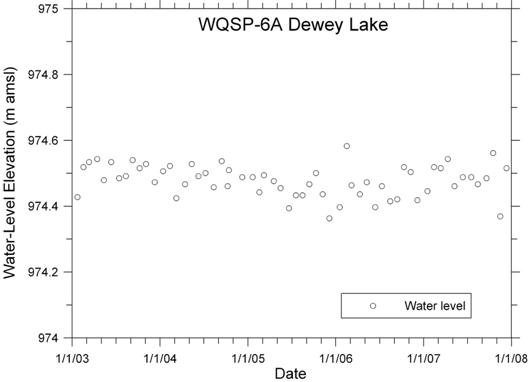
The DOE monitors Dewey Lake water levels in only one well, WQSP-6A (Figure HYDRO-10). Figure HYDRO-33 is a hydrograph of Dewey Lake water levels in WQSP-6A from 2003 through 2007. The hydrograph shows that water levels were stable within an approximately 20-centimeter (cm) (8-in.) band over that period, with perhaps a slight downward trend. Note that some of the fluctuations in the water levels are probably related to the water-quality sampling performed in the well twice a year (e.g., U.S. Department of Energy 2007).
Bell Canyon monitoring wells are situated at the
northern (DOE-2) and southern (Cabin Baby [CB]-1) WIPP site
boundaries (see Figure HYDRO-10). The primary purpose of this
monitoring is to determine if oil production, secondary recovery,
and/or brine-disposal activities in the Bell Canyon are affecting
the hydraulic head of the Bell Canyon at the WIPP site.
Bell Canyon water levels had been monitored in DOE-2 between
August 1985 and March 1986 through tubing attached to a PIP set
at the base of the Castile Formation (Beauheim 1986) before the well was recompleted as a Culebra
monitoring well. After swabbing ~22 m3 (775
ft3) of brine from the tubing to develop the open Bell
Canyon interval, the Bell Canyon fluid specific gravity was
approximately 1.1 and the water level stabilized at approximately
925 m (3033 ft) amsl. DOE-2 was converted to a
single-completion Bell Canyon well in February and March 2004 (Salness 2005b), and water-level monitoring began in July
2004. Figure HYDRO-34 shows the water-
Figure HYDRO-33. WQSP-6A Dewey Lake Water Levels
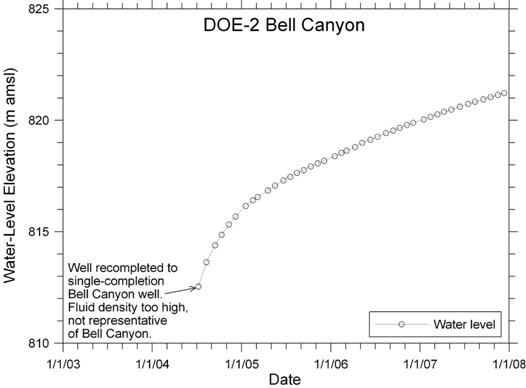
Figure HYDRO-34. DOE-2 Bell Canyon Water Levels
level data collected since that time. Although some of the water left in the well after recompletion was removed by bailing, the remaining water in the well was drilling brine having a specific gravity of approximately 1.2. Consequently, the water levels shown in Figure HYDRO-34 are not comparable to those measured between 1985–1986. Fluid-density issues notwithstanding, the Bell Canyon water level is steadily rising. Whether this is caused by gradual dilution of the heavy brine in the bottom of the hole by flowing groundwater or by some other factor cannot be determined until all of the water in the well is more nearly representative of Bell Canyon fluid. DOE-2 will be developed in 2008 to establish a specific gravity and water levels more representative of the Bell Canyon.
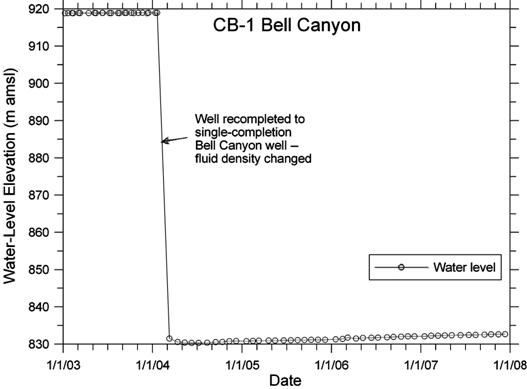
CB-1 was temporarily completed to the Bell Canyon shortly after drilling in September 1983 by setting a PIP on tubing in the lower anhydrite of the Castile Formation. After swabbing 16.8 m3 (595 ft3) of brine from the tubing to develop the open Bell Canyon interval, the Bell Canyon fluid-specific gravity was approximately 1.128 (Beauheim, Hassinger, and Klaiber 1983). Bell Canyon water levels were monitored in CB-1 through September 1986, and the water level stabilized at ~920 m (3020 ft) amsl (Intera Technologies, Inc. 1986). Monitoring of the Bell Canyon was suspended in late 1986 when CB-1 was converted to a Culebra monitoring well. In August 1999, a double-packer assembly was installed in the well to allow simultaneous monitoring of the Bell Canyon and Culebra (Beauheim 1999). After swabbing ~22 m3 (775 ft3) of fluid from the tubing connected to the Bell Canyon, the specific gravity stabilized at 1.126 and the water level subsequently stabilized at ~919 m (3015 ft) amsl. In January and February of 2004, CB-1 was reconfigured as a single-completion Bell Canyon monitoring well (Salness 2005a). As at DOE-2, some of the water left in the well after recompletion was removed by bailing, but the remaining water in the well was drilling brine with a specific gravity of approximately 1.2. Consequently, the water levels measured since that time are not comparable to those measured previously (Figure HYDRO-35). Like DOE-2, the Bell Canyon water level in CB-1 is steadily rising, albeit more slowly. Whether this is caused by gradual dilution of the heavy brine in the bottom of the hole by flowing groundwater or by some other factor cannot be determined until all of the water in the well is more nearly representative of Bell Canyon fluid. CB-1 will be developed in 2008 to establish a specific gravity and water levels more representative of the Bell Canyon.
Water-level monitoring provides a general picture of the changes in hydraulic head occurring in the formations being monitored. Water levels are currently being monitored in the Culebra, Magenta, Dewey Lake, and Bell Canyon. From 2003 through 2007, Culebra water levels generally rose by 1 to 3 m (3 to 10 ft), with most of the rise occurring between late 2004 and the end of 2007. Water levels rose more in Nash Draw and north of the WIPP site than they did elsewhere. Water levels in most Magenta wells generally rose over the same period, although only by ~1 m (3 ft) or less. The Dewey Lake water level (measured only in well WQSP-6A) was stable within a ~20-cm (8-in.) band over the 5-yr period. Bell Canyon water levels rose steadily as a recovery response to well recompletion, and were well below historic levels because the water left in the wells after recompletion was much denser than the native Bell Canyon water.
Figure HYDRO-35. CB-1 Bell Canyon Water Levels
In addition to monitoring water levels, fluid pressures in most Culebra and Magenta wells were monitored on an hourly basis using TROLL® gauges. These continuous fluid-pressure measurements provide a clearer, more complete record of the changes in hydraulic head occurring in the wells than that provided monthly water-level measurements. When coupled with rainfall data, the TROLL® data show that wells in and on the edge of Nash Draw respond to rainfall events of ~10 mm (0.4 in.) or more in 24 hr. Wells more distant from Nash Draw show smaller responses delayed by days to months for rainfall events of several cm, reflecting pressure propagation from Nash Draw to the east.
Hydraulic testing provides data to generate Culebra T fields for performance assessment (PA). Between the September 2002 data-cutoff date for the CRA-2004 and January 2008, hydraulic testing was performed in 20 Culebra wells. The wells tested, the types of tests performed, the dates of the tests, and the pumping rates during pumping tests are summarized in Table HYDRO-4. The testing was performed under TP 03-01, Test Plan for Testing of Wells at the WIPP Site (Chace and Beauheim 2006) and is documented in Johnson (2008).
|
Table HYDRO-4. Hydraulic Testing in Culebra Wells from December 2003 through January 2008 |
||||
|
Well |
Test Type |
Test Date(s) |
Pumping Rate (L/s) |
Transmissivity (m2/s) |
|
C-2737 |
Pumping |
3/4-5/2004 |
0.019 |
6.6 × 10⁻⁷ |
|
IMC-461 |
Slug |
1/25-26/2005 |
Not applicable |
1.9 × 10⁻⁴ |
|
SNL-1 |
Pumping |
5/25-29/2004 |
0.69 |
Not calculated |
|
Pumping |
3/7-10/2005 |
2.2 |
6.2 × 10⁻⁴ |
|
|
SNL-2 |
Pumping |
1/13-17/2004 |
0.047 |
Not calculated |
|
Pumping |
1/20-24/2005 |
0.76 |
1.1 × 10⁻⁴ |
|
|
SNL-3 |
Pumping |
4/14-16/2004 |
0.63 |
9.9 × 10⁻⁴ |
|
SNL-5 |
Pumping |
7/20-24/2004 |
0.22 |
4.9 × 10⁻⁶ |
|
SNL-6 |
Slug |
1/16/2008 |
Not applicable |
8.7 × 10⁻¹² |
|
SNL-8 |
Slug |
12/14/2006 |
Not applicable |
2.4 × 10⁻⁷ |
|
SNL-9 |
Pumping |
12/2-6/2003 |
0.79 |
3.9 × 10⁻⁵ |
|
Pumping |
10/22-11/23/2004 |
1.0 |
Not calculated |
|
|
SNL-10 |
Pumping |
10/30-11/3/2006 |
0.016 |
3.3 × 10⁻⁷ |
|
SNL-12 |
Pumping |
8/10-14/2004 |
1.3 |
5.0 × 10⁻⁴ |
|
SNL-13 |
Pumping |
7/17/2006 |
Variable |
3.8 × 10⁻⁷ |
|
SNL-14 |
Pumping |
8/4-26/2005 |
1.9 |
4.9 × 10⁻⁵ |
|
SNL-15 |
Slug |
3/30/2007 |
NA |
1.4 × 10⁻¹³ |
|
SNL-16 |
Pumping |
6/5-9/2006 |
1.6 |
1.3 × 10⁻³ |
|
SNL-17A |
Pumping |
9/11-15/2006 |
2.0 |
3.4 × 10⁻⁴ |
|
SNL-18 |
Pumping |
8/14-18/2006 |
1.9 |
1.4 × 10⁻⁴ |
|
SNL-19 |
Pumping |
7/24-28/2006 |
1.9 |
4.3 × 10⁻⁴ |
|
WIPP-11 |
Pumping |
2/1-20/2005 |
2.2 |
4.3 × 10⁻⁴ |
|
WIPP-25 |
Pumping |
9/22/2004 |
1.9 |
2.5 × 10⁻⁴ |
The initial attempts at pumping SNL-1, SNL-2, and WIPP-11 revealed that the wells were poorly connected to the Culebra. Subsequently, the wells were acidized to improve the connections. SNL-1 was acidized on March 3, 2005, by injecting 7.6 m3 (270 ft3) of a 15% hydrochloric (HCl) acid solution followed by 7.6 m3 (270 ft3) of fresh water into the well. SNL-2 was acidized in a similar fashion on January 19, 2005. WIPP-11 was acidized on January 5, 2005, by injecting 6.8 m3 (241 ft3) of a 15% HCl acid solution charged with liquid nitrogen followed by 9.2 m3 (326 ft3) of fresh water into the well. All three wells could sustain much higher pumping rates after acidization.
The Culebra hydraulic-test data have been analyzed by Roberts (2006 and 2007) and Bowman and Roberts (2009) under AP-070, Analysis Plan for Non-Salado Hydraulic-Test Interpretations (Beauheim 2004a) using techniques described in Beauheim and Roberts (2004). The transmissivity values inferred by Roberts (2006 and 2007) and Bowman and Roberts (2009) from the tests are also listed in Table HYDRO-4.
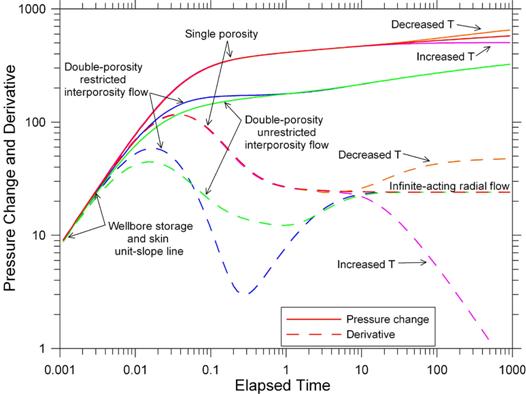
In addition to the quantitative information on transmissivity obtained from the Culebra pumping tests, qualitative information on Culebra heterogeneity can also be inferred. A log-log plot of pressure change and the derivative of the pressure change with respect to log time during a pumping or recovery period is the standard “diagnostic” plot used by the petroleum industry to develop a conceptual model of the formation being tested (Bourdet, Ayoub, and Pirard 1989). At early time, both the pressure change and pressure derivative curves have a unit slope (Figure HYDRO-36), indicating that water is coming predominantly from storage in the wellbore rather than the formation. The duration of this wellbore-storage period is increased if the formation is poorly connected to the well, as can result from drilling mud buildup on the wall of the hole or mud invasion of the formation (referred to as a positive “skin”). If the formation is directly connected to the well by open fractures, very little wellbore storage may be observed and the well may have a negative skin. A minimum observed in the derivative after the wellbore-storage period is indicative of double-porosity (fractured) conditions, with the amplitude of the minimum increasing if flow between the fractures and rock matrix is inhibited by mineralization or some other coating on the fracture surface. In a homogeneous, isotropic system (whether single or double porosity), flow to a pumping well is radial and the pressure derivative takes on a constant value at late time, forming a horizontal line on the diagnostic plot. A decline in the derivative at late time indicates that transmissivity is increasing with distance from the pumping well or that some higher-T region (in the extreme, a constant-pressure boundary) has been encountered by the expanding pressure transient from the test. A rise in the derivative indicates that transmissivity is decreasing or that flow is being constrained by a lower-T region (in the extreme, a no-flow boundary). Referring to these basic characteristics of the pressure derivative on a diagnostic plot, information on Culebra heterogeneity can be inferred from the diagnostic plot of each pumping test.
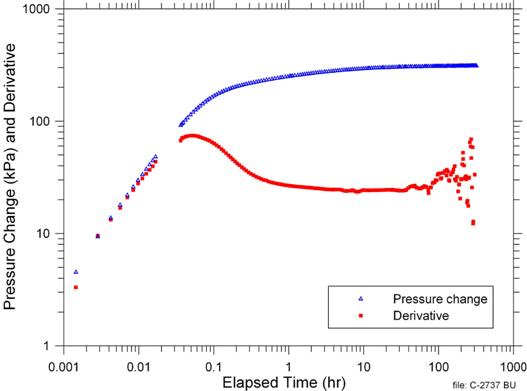
Figure HYDRO-37 shows the diagnostic plot of the pressure recovery following the C-2737 pumping test. Wellbore storage and single-porosity, radial flow are readily apparent in the derivative. Note that the late-time derivative is erratic because the signal-to-noise ratio decreases as the rate of pressure change decreases. The diagnostic plot shows that the transmissivity of the Culebra varies little within the area interrogated by the 10.4-hr pumping test. Similar uniform transmissivity conditions were found from the SNL-9, SNL-10, SNL-13, SNL-16, and WIPP-25 pumping tests, with SNL-9 and SNL-16 also providing clear indications of double-porosity conditions (Roberts 2006 and 2007).
Figure HYDRO-36. Log-Log Diagnostic Plot Showing Different Aquifer Conditions
Figure HYDRO-37. Log-Log Diagnostic Plot of C-2737 Recovery
Figure HYDRO-38 shows the diagnostic plot from the pressure recovery following the SNL-3 pumping test. The SNL-3 response shows much more wellbore storage and (positive) skin effect than the C-2737 response shown in Figure HYDRO-37. The minimum in the derivative may reflect either double porosity or simply a highly positive skin. In either case, the minimum is not followed by a stabilized derivative representing radial flow through a region of uniform transmissivity. Instead, the derivative steadily climbs, which reflects either decreasing transmissivity or channelization of flow through a quasi-linear region with higher T than the surrounding rock. Similar, steadily rising late-time derivatives were observed in the tests of SNL-1 and SNL-12 (Roberts 2006). The SNL-12 diagnostic plot also showed apparent double-porosity effects.
The log-log diagnostic plot of the recovery from the WIPP-11 pumping test (Figure HYDRO-39) shows a more complicated pattern of heterogeneity. After a brief period of wellbore storage, the derivative appears to stabilize for nearly one log cycle of time, then rises for another log cycle, stabilizes (or drops slightly) for another log cycle, and then begins a final sustained rise. This pattern could indicate a series of rings around WIPP-11 with progressively lower T or, more likely, regions of lower T encountered at different distances in different directions. A similar derivative was seen in the diagnostic plot for the SNL-14 pumping test with the addition of apparent double-porosity effects (Roberts 2006).
The log-log diagnostic plot of the recovery from the SNL-5 pumping test (Figure HYDRO-40) shows yet another type of heterogeneity. After the wellbore storage and skin period, the derivative hints at a radial-flow stabilization at ~2-3 hr elapsed time, but then begins a steady decline. This decline indicates that the transmissivity of the Culebra increases with distance from SNL-5. Similar late-time declines were observed in the pressure derivatives from the tests at SNL-2, SNL-18, and SNL-19 (Roberts 2006 and 2007). The SNL-18 diagnostic plot also showed apparent double-porosity effects.
The log-log diagnostic plot of the recovery from the SNL-17A pumping test (Figure HYDRO-41) provides a final example of the heterogeneity observed in Culebra testing. After a brief wellbore-storage period, the derivative displays a double-porosity minimum, rises and begins to stabilize, then rises again before rolling over into a sustained decline. This behavior is indicative of a double-porosity system with homogeneous properties in the near-well region and then lower T at some distance in one direction followed by much higher T in another direction.
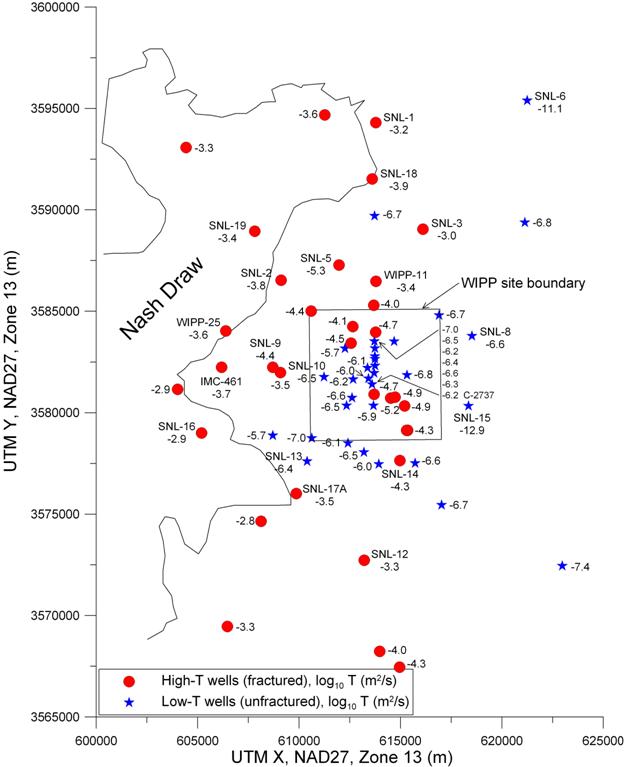
The changes in transmissivity implied by the Culebra pumping test diagnostic plots are consistent with knowledge of the Culebra transmissivity distribution. Figure HYDRO-42 shows the log10 transmissivity (m2/s) values for all of the Culebra wells around the WIPP site. Those wells at which the Culebra was observed to be fractured and/or where double-porosity hydraulic responses were observed are shown as red dots, while those wells at which few (or no) open fractures were observed and only single-porosity hydraulic responses were observed are shown as blue stars. C-2737 is seen to be at the southern end of an area with log10 transmissivity values between -7 and -6. The effects of the short (10.4-hr), low-rate (0.019 liters per second [L/s] [0.3 gallons per minute (gpm)]) pumping test conducted at C-2737 appear to have been confined
Figure HYDRO-38. Log-Log Diagnostic Plot of SNL-3 Recovery
Figure HYDRO-39. Log-Log Diagnostic Plot of WIPP-11 Recovery
Figure HYDRO-40. Log-Log Diagnostic Plot of SNL-5 Recovery
Figure HYDRO-41. Log-Log Diagnostic Plot of SNL-17A Recovery
Figure HYDRO-42. log10 Transmissivity (m2/s) Values of Culebra Wells Around the WIPP Site
to this low-T region. A longer test would be expected to show the effects of the higher T (log10 transmissivity = -4.7) seen at H-3 to the south. SNL-3 can be seen to be in a region with lower T to both the east and west, leading to the derivative behavior seen in Figure HYDRO-38. The derivative behavior seen at the other tested Culebra wells can be similarly explained by referring to Figure HYDRO-42.
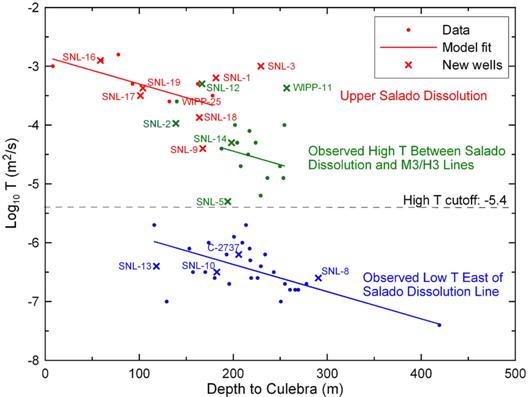
The transmissivity values inferred from the hydraulic tests listed in Table HYDRO-4 are generally consistent with a correlation between Culebra transmissivity and overburden thickness, taking other geologic factors into consideration. This correlation was developed by Holt and Yarbrough (2002) and was used to generate the CRA-2004 T fields. Figure HYDRO-43 shows the results listed in Table HYDRO-4 added to the data and correlation of Holt and Yarbrough (2002). The data are divided into three categories: wells where upper Salado dissolution has occurred, wells where no Salado dissolution has occurred and log10 transmissivity (m2/s) is greater than -5.4, and wells where no Salado dissolution has occurred and log10 transmissivity is less than -5.4. log10 transmissivity = -5.4 is the cutoff used by Holt and Yarbrough (2002) to differentiate wells showing double-porosity hydraulic behavior indicative of fractures from wells showing single-porosity (porous medium) hydraulic behavior. SNL-5 (log10 transmissivity = 5.3, single porosity) had not yet been drilled at the time of this demarcation. Not shown are the results from SNL-6 and SNL-15, which are from a different geologic domain (Culebra bounded by and containing halite [see Section HYDRO-7.1]) than the data shown on the plot and have much lower transmissivities.
Most of the new transmissivity data are in good agreement with the correlation of Holt and Yarbrough (2002). SNL-12 and WIPP-11 have higher transmissivities than would have been expected. The evidence for upper Salado dissolution at SNL-9 is tenuous (Powers and Richardson 2003b), and SNL-9 might be more properly assigned to the middle population (shown in green) on Figure HYDRO-43. SNL-5 is shown as belonging to the middle (green) group only because its log10 transmissivity value falls above the cutoff used by Holt and Yarbrough (2002). Some fracturing was observed in the core from SNL-5 (Powers and Richardson 2004d), but no indication of double-porosity hydraulic behavior is seen in the diagnostic plot of the pumping test recovery (Figure HYDRO-40). The cutoff could perhaps be redefined (as was done in Beauheim 2007) and SNL-5 assigned to the lower (blue) group. In either category, it would represent an end member.
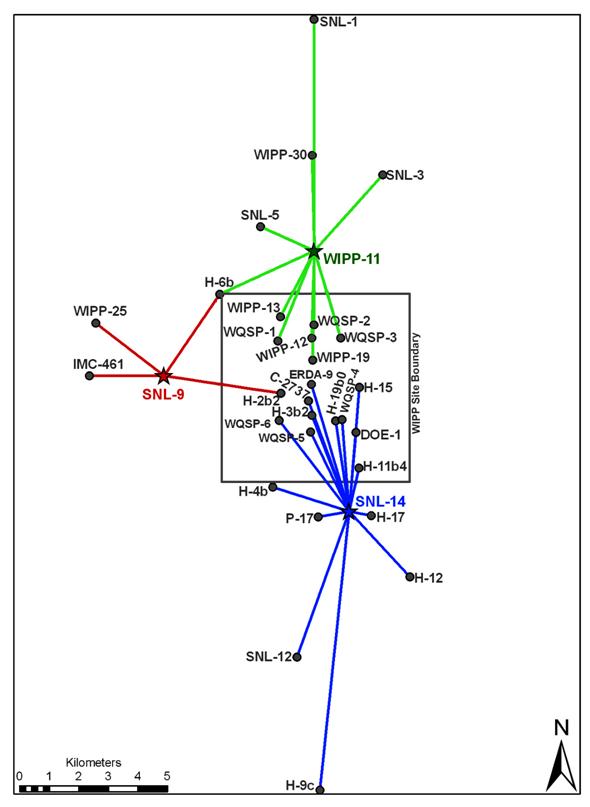
Most of the tests performed since 2003 were single-well tests, meaning that the test was only intended to produce a response in the well being tested. Three longer-term pumping tests were conducted in 2004 and 2005, however, that were designed to produce responses in surrounding observation wells that could be used to calibrate the groundwater-flow model of the Culebra. Total production from these tests was limited to the 3700 m3 (3 acre-feet[acre-ft]) the New Mexico Office of the State Engineer specifies as the maximum amount that can be pumped from a well in a calendar year without obtaining additional water rights. These tests were conducted at SNL-9, WIPP-11, and SNL-14, and lasted 32 days, 19 days, and 22 days, respectively (Table HYDRO-4). The observation wells that responded to these tests are shown in Figure HYDRO-44.
Figure HYDRO-43. New Transmissivity Data Added to Correlation of Holt and Yarbrough (2002)
Beauheim (2007) compiled hydraulic diffusivity data from observation-well responses to 15 Culebra pumping tests to identify the areas that are, and are not, interconnected by fractures. In a highly heterogeneous medium such as the Culebra, only hydraulic diffusivity, the ratio of transmissivity and storativity (S), can be determined from the responses of observation wells to pumping tests. Independent estimation of transmissivity and S requires knowledge of the areal distribution of flow during pumping, which is not known in a heterogeneous system. Generally speaking, higher values of diffusivity reflect higher degrees of connectivity between wells.
The diffusivity data represent tests in which the observation-well-to-pumping-well distances ranged from 398 m (1304 ft) to 9472 m (31075 ft) (Beauheim 2007). All Culebra pumping tests that have produced observable responses at wells over 100 m (330 ft) away were performed at wells showing high T (log10 T ≥ -5.4) and evidence of fracturing. (Indeed, lower-T locations typically cannot sustain pumping rates of at least 0.25 L/s (4 gpm) required to produce observable responses over great distances in the Culebra.) Thus, the pressure responses observed at distant wells all involve some amount of propagation through fractures before, perhaps, encountering unfractured dolomite. The objective, therefore, was to distinguish pressure-transient propagation entirely through fractures from that which starts in fractures but ends in unfractured rock (Beauheim 2007). This was accomplished by comparing the diffusivities (D) calculated for each pumping well/observation well pair in the context of the other information available about fracturing in the Culebra.
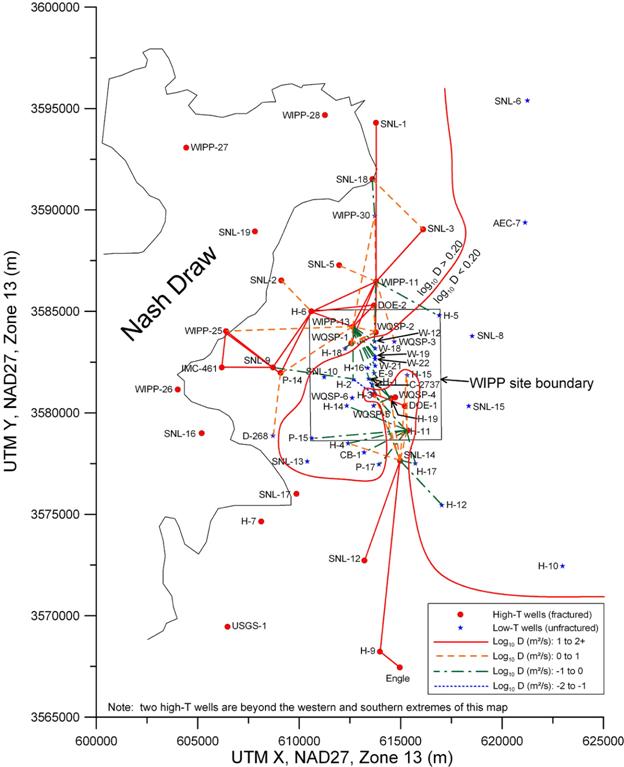
Beauheim (2007) found that all of the well pairs showing log10 D (m2/s) values of 1.0 or greater involve wells already known to have high-T (log10 T ≥ -5.4) and other evidence of fracturing. Thus, these wells are likely directly interconnected by fractures. At the other extreme, all well pairs showing log10 D values less than 0 involve an observation well known to have low-T and no evidence of fracturing. Thus, these wells are probably not directly interconnected by fractures. The well pairs showing log10 D values between 0 and 1 required more detailed attention because they involved wells with and wells without evidence of fracturing. Based largely on the response of H-15 to the H-11b1 pumping test, which produced a log10 D estimate of 0.21 (Beauheim 1989), Beauheim (2007) concluded that a log10 D value of approximately 0.20 appears to represent the cut-off between well pairs connected by fractures from those that are not. H-15 encountered little fracturing in the Culebra, with most fractures filled with gypsum (Mercer and Snyder 1990) but, as suggested by Beauheim (1989), it must be near to hydraulically significant fractures to have responded to the pumping at H-11b1 (and later at SNL-14) as it did.
The spatial pattern of estimated Ds is shown in Figure HYDRO-45. A red line shows the separation between regions with log10 D values greater and less than 0.20. The regions containing high-T wells show log10 D values greater than 0.20, reflecting fracture interconnections. The high-T region in the southeastern part of the WIPP site clearly seems to be interconnected to high Ts farther to the south. The swath of Culebra running roughly NE to SW across the WIPP site that encompasses only low-T wells generally shows log10 D values less than 0.20. Combining this information with the fact that no responses to pumping in a high-T well on one side of this swath have ever been observed in high-T wells on the other side of the swath, Beauheim (2007) inferred that a continuous band of low-T Culebra lacking hydraulically significant fractures separates the high-T Culebra found in the northwestern part of the WIPP site from the high-T Culebra found in the southeastern part of the site.
Hydraulic testing of Magenta wells was performed under TP 00-03, Compliance Monitoring Program: Recompletion and Testing of Wells for Evaluation of Monitoring Data from the Magenta Member of the Rustler Formation at the WIPP Site (Chace 2003). Slug tests of the Magenta were performed in well C-2737 in January 2007. Bowman and Roberts (2009) inferred a transmissivity of 1.5 ´ 10-7 m2/s (0.14 square feet (ft2)/day) from these tests.
Tests of the Magenta were also attempted in WIPP-25, where Mercer (1983) reported the transmissivity of the Magenta to be 4.0 ´ 10-4 m2/s (375 ft2/day), higher than the 2.9 ´ 10-4 m2/s (270 ft2/day) reported for the Culebra at that location. Lambert and Robinson (1984) reported maintaining a pumping rate of 2.1 L/s (33 gpm) when they sampled the Magenta at WIPP-25 in 1980. Two attempts were made to pump the well in February 2006 and September 2007, but even a pumping rate of 0.08 L/s (1.25 gpm) was more than the well could sustain, and the well was rapidly dewatered. Pressure recovery to the prepumping level then took several months. Video inspection inside the well showed that the casing perforations across the Magenta interval were open. It is surmised that the packer separating the Culebra and Magenta in WIPP-25 was
Figure HYDRO-44. Observation Wells Responding to 2004–2005 Long-Term Pumping Tests
Figure HYDRO-45. log10 D Values Observed for Pumping Well-Observation Well Pairs (modified from Beauheim 2007)
leaking when Lambert and Robinson (1984) sampled the well, because they reported virtually identical water chemistries for the Culebra and Magenta. The Magenta transmissivity value reported by Mercer (1983) was derived from the same pumping test as the water-quality samples; hence, the transmissivity value is not representative of the Magenta. Based on the rapid dewatering and slow recovery observed in 2006 and 2007, the true Magenta transmissivity value at WIPP-25 may be two or more orders of magnitude lower than the value reported by Mercer (1983).
As a historical note, the U.S. Geological Survey (USGS) performed hydraulic tests in wells H-1, H-2a, H-2b, H-2c, and H-3 (later referred to as H-3b1) in 1979 and 1980 that provided data for transmissivity estimates for the Magenta, Culebra, and Rustler-Salado contact interval reported in Mercer (1983). However, the data from those tests were not published at that time. The USGS completed documentation of the data from those tests in Huff and Gregory (2006).
Extensive hydraulic testing has been performed in the new wells. This testing has involved both single-well tests, which provide information on local transmissivity and heterogeneity, and long-term (19 to 32 days) pumping tests that have created observable responses in wells up to 9.5 km (5.9 mi) away. The transmissivity values inferred from the single-well tests support the correlation between geologic conditions and Culebra transmissivity developed by Holt and Yarbrough (2002) and elucidated by Holt, Beauheim, and Powers (2005). The types of heterogeneities indicated by the diagnostic plots of the pumping-test data are consistent with the known spatial distribution of transmissivity in the Culebra. Mapping of diffusivity values obtained from analysis of observation-well responses to pumping tests shows areas north, west, and south of the WIPP site connected by fractures, and also a wide area that includes a NE-to-SW swath across the WIPP site where hydraulically significant fractures are largely absent (Beauheim, 2007). This mapping, combined with the responses observed to the long-term SNL-14 pumping test, has confirmed the presence of a high-T area extending from the SE quadrant of the WIPP site to at least 10 km (6.2 mi) to the south.
The data from hydraulic testing provide the basis for developing T fields that are used for PA to describe radionuclide transport in the Culebra. However, the T fields for the CRA-2009 PA are the same T fields as were used for the CRA-2004 PABC. New T fields based on the data presented in Section HYDRO-6.0 are undergoing peer review.
Geological investigations conducted from 2003 through 2007 focused on two major topics: delineation of halite margins in the nondolomite members of the Rustler and karst. Separate karst studies were performed to (1) evaluate the potential for karst at the WIPP site, and (2) increase understanding of karst in Nash Draw.
A reexamination of Rustler halite margins using geophysical log data from new and/or additional oil and gas wells and other boreholes around the WIPP was performed under AP-114, Analysis Plan for Evaluation and Recalibration of Culebra Transmissivity Fields (Beauheim 2004b), as part of refining the WIPP conceptual hydrology model and Culebra T fields. Mudstone and halite are lateral facies equivalents in the nondolomite members of the Rustler (Powers and Holt 2000). Holt and Powers (1988) recognized the facies equivalency, and defined the informal stratigraphic nomenclature for the Rustler shown in Figure HYDRO-3. Powers (2002) delineated the halite margins based on the then-available data for CRA-2004.
As described by Holt, Beauheim, and Powers (2005), deposition (and preservation) of halite in units adjacent to the Culebra is related to the hydraulic properties of the Culebra in several ways. First, when halite was deposited above the Culebra, high-salinity fluids circulated through the Culebra, depositing halite in Culebra pores as well, resulting in extremely low-T. Second, if the Culebra is fractured, allowing high flux, halite immediately below or above the Culebra would probably not survive for millions of years. Therefore, the presence of halite below or above the Culebra can indicate the lack of open fractures in the Culebra. Third, if halite is dissolved from below the Culebra, it could cause fracturing of the Culebra (as Salado dissolution has caused in Nash Draw). As halite is most likely to be dissolved along its depositional margin, the M2-H2 margin below the Culebra should be evaluated as a potential location of high Culebra transmissivity.
Thus, mapping the occurrence of halite in the Rustler members allows inferences about Culebra transmissivity in areas where there are no Culebra wells. Powers (2007) completed this investigation and produced the revised halite-margin map shown in Figure HYDRO-46. The revised map shows more detail and complexity than the previous version, made possible by the data available from newly drilled oil and gas wells. The revised halite margins will be used in developing new Culebra T fields.
In response to WIPP stakeholder comments about the potential effects of karst on WIPP regulatory compliance and a request from EPA (U.S. Environmental Protection Agency 2006, p. 18015), the DOE initiated a comprehensive review of all claims and information pertaining to karst in the WIPP vicinity. This review (Lorenz 2006a and 2006b) supported the previous DOE position on karst, concluding that most of the geological evidence offered for the presence of karst in the subsurface at the WIPP site “has been used uncritically and out of context, and
Figure HYDRO-46. Revised Rustler Halite Margins
does not form a mutually supporting, scientifically defensible framework. …The remaining evidence is more readily interpreted as primary sedimentary features” (Lorenz 2006b, p. 243). Lorenz (2006b, p. 250) summarized his findings as follows:
Analysis of primary data suggests that the overwhelming majority of data support an interpretation of unkarsted strata in the Rustler Formation at and near the WIPP site. There is some evidence for local dissolution at the top of the Magenta horizon in the WIPP-33 drillhole, but extrapolation of the known karst features in Nash Draw eastward to the WIPP site is unwarranted. The arguments offered for karst in the Rustler Formation at the WIPP site are speculative, and what evidence exists for karst is inconsistent and contradictory, and subject to other, more plausible interpretations.
Interpretations of ‘insoluble residues’ in the cores were based on undeveloped theory, faulty analogy, and severely limited exposures. These early interpretations have been erroneously cited as evidence for karst in the Rustler Formation. More recently, better exposures of these strata, and their interpretation by analogy to modern depositional environments, have documented the presence of primary sedimentary structures including the disruption of bedding related to syndepositional desiccation and cracking, proving that they are primary deposits that have not been subjected to post-burial dissolution.
Topographic depressions near the WIPP site that have been cited as being the probable locations of sinkholes are few, and the data that have been cited to interpret these depressions as sinkholes have been taken out of context and have other, more scientifically valid and better supported interpretations. The characteristics of these depressions are not similar to the characteristics of the unambiguous sinkholes which pirate drainage systems in Nash Draw to the west. The stratigraphic thinning commonly cited as evidence of dissolution of the Rustler Formation at the WIPP site is in fact related to dissolution only in the immediate vicinity of Nash Draw. This dissolution-related thinning overlaps with and obscures the depositional thinning and thickening that is common to the Rustler Formation across the Delaware Basin. Rustler halites were deposited in shallow depressions at the same time that muddy deposits were accumulating at the margins of the pans, and this lateral facies equivalency, a well-documented and founding principle of stratigraphy, caused most of the sedimentary patterns that are mistakenly cited as evidence for post-depositional dissolution and removal of halite from the thinner parts of the Rustler Formation in the vicinity of the WIPP site. The laterally extensive and uniform dolomite layers are not evidence for the original extents of the halite layers. Finally, it would be impossible to obtain the observed thicknesses of the muddy and silty deposits that have been called “residues” by dissolving the limited available volumes of muddy and silty halite.
While Lorenz (2006a and 2006b) focused on evidence for karst at the WIPP site, Powers et al. (2006b) provided new details on karst in Nash Draw. Quoting from their discussion,
Nash Draw is a complicated geological feature whose origins, history, and processes have been broadly outlined by previous investigations. Powers and Owsley (2003) provided additional details of karst features in the southeastern arm of Nash Draw, and many of the features reported there are discussed or described further here. Some of the approaches taken here will be extended elsewhere in the draw.
Upper Salado halite was dissolved to form a distinct margin along Livingston Ridge and the eastern margin of Nash Draw. Drillhole control is not as dense, however, in most other areas, and the precise control and details of the history would be more difficult to extract elsewhere. We can be reasonably confident that, by analogy, much of the eastern margin of Nash Draw develops by similar processes, although perhaps at differing rates and times. Sulfate was also removed from the Rustler in Nash Draw, although data on structure and well logs indicate this is not the dominant process along the Livingston Ridge at the Cabin Lake Field. Data on upper Salado halite have not been developed in comparable detail along the western margin of Nash Draw, and we cannot evaluate the relationship between upper Salado halite dissolution and that very distinctive margin. The fact that the western margin can be drawn along different escarpments suggests an even more complicated history. Nevertheless, based on additional data, we feel more confident than Vine (1963) about the relationship between Nash Draw topography and upper Salado halite dissolution.
The data on upper Salado halite around Laguna Grande are consistent with a low along a north-south axis of the lake that may provide, or have provided, a pathway for brine movement southward out of the area under the lake before migrating further south and southwest toward the Pecos River. The elevation on the top of halite, as shown by a few wells in this area, indicates more halite removal, and the rocks at the surface have developed internally-drained, elongate valleys as well as small, circular basins over this area in response. There are some indications that more localized topography, including some drainages east of Laguna Grande, have developed in response to local differences in halite dissolution. This inference will likely remain very tentative since it is unlikely that significantly closer spacing of drillhole data will be obtained.
The array of surface karst features that developed on gypsum beds and gypsite in the southeastern arm of Nash Draw show evidence of stratigraphic control and reveal some aspects of their evolution. Sharply defined, vertical-walled collapse sinks are more common on upper Rustler beds, but they also are more recently exposed by erosion. Similar beds, lower stratigraphically and exposed farther from the edge of the draw, show more collapse and fill. These features likely show some steps in the evolution of karst with time in this setting. Blind valleys are, at least now, associated with the Magenta Dolomite and upper Tamarisk gypsum. They do not resemble collapse sink development; rather it appears that the less-soluble carbonate over gypsum is an important factor in maintaining the cave system instead of collapsing. The features we call karst valleys, however, may be a later step in collapse sink development, where they coalesce into a longer feature. Because the karst valleys developed in lower stratigraphic units than do the more individual collapse sinks described here, it is not certain what role stratigraphy plays in the evolutionary timing of these features.
Springs near the mouth of the southeastern arm of Nash Draw are dominated by sulfate-rich water. Moderate specific gravity and gypsum formation from the evaporating water differentiate these springs from those with high specific gravity and brines that precipitate halite. The brines precipitating halite undoubtedly flow through very shallow gypsum karst, but the brine source is a lake maintained by potash refinery effluent. The sulfate-rich springs are part of the karst hydraulic system in the southeastern arm of Nash Draw, which is developed mainly on beds of sulfate and gypsite. Given the year-round flow in an area with strong seasonal differences in rainfall, the system has considerable storage. Because we cannot quantify what proportion of the fluid flow in this arm of Nash Draw goes to this spring, and have not quantified flow from the springs into Laguna Cinco, it is not practical to estimate how storage occurs there. Subsurface fluids are likely stored in the alluvium that fills some sinks and valleys. Thin (~3–5 m thick) mudstones between Rustler gypsum beds and Rustler dolomites may also provide storage. Hillesheim, Beauheim, and Richardson (2006) suggest recharge reaches the Culebra Dolomite (which is significantly deeper than the near-surface features described here). The Culebra is not storage for these springs, however, as the hydraulic heads for the Culebra are not sufficient to reach the surface here. The systems that discharge to the springs are quite likely feeding open porosity that is locally strata-bound. The degree to which the shallow system in the southeastern arm of Nash Draw is connected to deeper beds, such as the Culebra, is not yet established. Hillesheim et al. (2006) show that heavier precipitation across Nash Draw does affect water levels in the Culebra. Local gradients and flow toward the springs at Laguna Grande, as described here, is not evidence that the Culebra follows a similar local flow path.
The investigations of springs in the southeastern arm of Nash Draw discussed above are documented by Powers (2006a). Powers (2006b) also mapped numerous closed catchment basins in southeastern Nash Draw (Figure HYDRO-47). The basins drain to holes in Rustler gypsum units above the Culebra. Some of the water entering this gypsum karst discharges into brine ponds (“lagunas”) in Nash Draw, such as Laguna Cinco (Powers 2006a). Some water must also reach a water table in the gypsum units with which the Culebra is in hydraulic communication, at least locally, because Culebra wells in Nash Draw show water-level responses to major rainfall events (e.g., Figure HYDRO-14).
Figure HYDRO-47. Catchment Basins (color coded) Mapped in Southeastern Nash Draw
Water-quality sampling has been performed under two programs at WIPP. Culebra wells WQSP-1 through WQSP-6 and Dewey Lake well WQSP-6A are sampled twice a year under the WIPP Water Quality Sampling Program (WQSP). Sample analysis results are published in the ASERs (U.S. Department of Energy 2004c, 2005, 2006, 2007, and 2008). Water-quality samples are collected in conjunction with pumping tests, as well as during dedicated sampling events under TP 03-01 (Chace and Beauheim 2006) or TP 00-03 (Chace 2003). Most Culebra samples were collected after repeated field measurements showed that pH, specific gravity, and electrical conductivity had stabilized while several wellbore volumes were pumped.
Two exceptions were the samples from SNL-6 and SNL-15. Because of the very low Culebra transmissivity at these two locations (Table HYDRO-4), these wells could not be pumped at any sustainable rate. The wells had been drilled using compressed air as the circulation medium (Powers [In progress]a, Powers and Richardson 2008c), and very little water had accumulated in the holes by the time the wells were completed. Thus, almost all of the water in the wells came from the Culebra. The SNL-6 sample was collected at the depth of the Culebra after ~140 m (460 ft) of water had accumulated in the well, and the SNL-15 sample was collected ~43 m (150 ft) below the water surface in the well.
A few samples from various formations were collected opportunistically during drilling of new wells. No purging or well cleanup was performed before collecting these samples—the waters were representative of what flowed into the borehole after drilling through the sampled interval using compressed air as the circulation medium. These samples cannot be considered as reliable as those collected during pumping tests or dedicated sampling events, but should provide qualitative indications of the waters in the sampled formations.
The non-WQSP samples are analyzed only for major ions and general chemical parameters (pH, specific gravity, and specific conductance). The non-WQSP wells sampled and the analytical results are listed in Table HYDRO-5. All these samples were analyzed by Hall Environmental Analysis Laboratory, Albuquerque, NM. Evaluation of the water-chemistry data is being performed under AP-125, Analysis Plan for the Evaluation of Culebra Brine Compositions (Domski and Beauheim 2005).
Repeated sampling of the WQSP wells has demonstrated how stable the Culebra water chemistry is in these wells. Figure HYDRO-48 presents Piper plots (Piper 1944) for each well showing that the groundwater composition between 2003 and 2007 was consistent with that measured since the WQSP program began in 1995.
Table HYDRO-5. Analytical Results for Water Samples Collected by SNL
|
Well ID |
Unit |
Sample Date |
Cl- (mg/L) |
SO42- (mg/L) |
HCO3- (mg/L) |
Br- (mg/L) |
F- (mg/L) |
Ca2+ (mg/L) |
Mg2+ (mg/L) |
K+ (mg/L) |
Na+ (mg/L) |
Sr2+ (mg/L) |
Specific Conductance (µmhos/cm@ 25°C) |
pHa |
Specific Gravitya |
Charge Balance Error (%)j |
|
C-2737 |
C |
3/4/2004 |
44000 |
6000 |
71 |
65 |
0.7 |
1600 |
770 |
320 |
28000 |
NA |
140000 |
7.16 |
1.064 |
0.03 |
|
H-19b0 |
C |
8/31/2006 |
47000 |
4800 |
46 |
50 |
ND |
1600 |
1100 |
680 |
27000 |
23 |
170000 |
7.25 |
1.068 |
-2.33 |
|
IMC-461 |
C |
8/4/2006 |
3900 |
2300 |
100 |
ND |
2.3 |
1000 |
250 |
30 |
1800 |
15.4 |
14000 |
6.80 |
1.008 |
-3.45 |
|
SNL-1 |
C |
5/29/2004 |
19000 |
3700 |
76 |
17 |
ND |
1400 |
730 |
340 |
10000 |
NA |
150000 |
7.04 |
1.027 |
-3.5 |
|
SNL-2 |
C |
1/17/2004 |
4800 |
2400 |
90 |
3.1 |
2 |
930 |
230 |
46 |
2600 |
NA |
19000 |
7.32 |
1.010 |
-2.2 |
|
SNL-3 |
C |
4/16/2004 |
26000 |
4700 |
63 |
32 |
ND |
1400 |
740 |
360 |
14000 |
NA |
140000 |
7.36 |
1.036 |
-5.31 |
|
SNL-5 |
C |
7/24/2004 |
7000 |
1700 |
64 |
17 |
1.5 |
1400 |
510 |
67 |
1900 |
NA |
19000 |
7.02 |
1.011 |
-8.89 |
|
SNL-6b |
C |
1/16/2008 |
220000 |
1800 |
170 |
5100 |
ND |
5500 |
22000 |
4800 |
97000 |
140 |
580000 |
6.17d |
1.21d |
1.24 |
|
SNL-8 |
C |
8/2/2007 |
77000 |
6400 |
49 |
100 |
ND |
2000 |
3100 |
1500 |
47000 |
33 |
280000 |
6.95 |
1.097 |
2.74 |
|
SNL-9 |
C |
11/19/2004 |
14000 |
1600 |
140 |
16 |
2.5 |
3100 |
810 |
44 |
4700 |
NA |
50000 |
6.73 |
1.021 |
-0.52 |
|
SNL-10 |
C |
11/3/2006 |
1100 |
4400 |
46 |
2.3 |
2.7 |
500 |
170 |
72 |
1900 |
9.3 |
11000 |
8.11 |
1.008 |
-0.12 |
|
SNL-12 |
C |
8/14/2004 |
740 |
1900 |
92 |
1.7 |
3.3 |
610 |
120 |
15 |
440 |
NA |
5000 |
7.07 |
1.004 |
-2.15 |
|
SNL-13 |
C |
7/17/2006 |
8500 |
3300 |
50 |
31 |
3.2 |
990 |
330 |
190 |
5200 |
16.9 |
40000 |
8.42 |
1.017 |
-0.39 |
|
SNL-14 |
C |
8/21/2007 |
47000 |
6900 |
48 |
40 |
2.5 |
1500 |
1100 |
620 |
30000 |
22 |
130000 |
7.81 |
1.061 |
0.51 |
|
SNL-15b |
C |
3/30/2007 |
180000 |
1600 |
200 |
1100 |
6.2 |
4800 |
12000 |
6800 |
90000 |
130 |
610000 |
6.64d |
1.205d |
1.79 |
|
SNL-16 |
C |
6/9/2006 |
8600 |
2500 |
97 |
ND |
2.5 |
1400 |
430 |
290 |
4400 |
18.2 |
35000 |
7.01 |
1.014 |
1.22 |
|
SNL-17A |
C |
9/15/2006 |
250 |
1800 |
94 |
ND |
1.3 |
620 |
150 |
5.3 |
130 |
7.8 |
3500 |
7.26 |
1.003 |
2.5 |
|
SNL-18 |
C |
8/18/2006 |
8700 |
3700 |
75 |
5.6 |
1.7 |
1100 |
360 |
120 |
5200 |
15.9 |
38000 |
7.44 |
1.016 |
-1.62 |
|
SNL-19 |
C |
7/28/2006 |
2700 |
2300 |
90 |
1.6 |
1.5 |
850 |
220 |
43 |
1600 |
11.4 |
12000 |
7.19 |
1.007 |
1.88 |
|
USGS-4 |
C |
7/19/2006 |
1100 |
1800 |
35 |
ND |
2.3 |
530 |
120 |
15 |
540 |
7.24 |
5900 |
6.80 d |
NA |
-7.05 |
|
WIPP-11 |
C |
2/20/2005 |
26000 |
6300 |
78 |
37 |
ND |
1600 |
810 |
360 |
15000 |
NA |
160000 |
7.07 |
1.038 |
-3.49 |
|
WIPP-25 |
C |
9/23/2004 |
14000 |
2600 |
100 |
ND |
ND |
1800 |
660 |
720 |
8000 |
NA |
130000 |
6.92 |
1.023 |
6.12 |
|
WIPP-30 |
C |
5/6/2005 |
18000 |
3900 |
44 |
12 |
3.3 |
1300 |
320 |
170 |
13000 |
NA |
130000 |
8.58 |
1.030 |
5.66 |
|
SNL-1c |
DLe |
3/25/2004 |
190000 |
15000 |
290 |
440 |
ND |
540 |
4500 |
21000 |
91000 |
NA |
>199900 |
6.82d |
1.210 |
-7.45 |
|
SNL-13c |
DLf |
4/12/2005 |
440 |
2200 |
58 |
1.3 |
1.6 |
680 |
150 |
5.7 |
270 |
NA |
4300 |
8.02d |
1.000 |
-1.42 |
|
SNL-14c |
DLg |
5/3/2005 |
54 |
160 |
180 |
ND |
1.1 |
74 |
51 |
6.1 |
29 |
NA |
860 |
7.98d |
1.026 |
1.25 |
|
SNL-14c |
DLh |
5/5/2005 |
350 |
1300 |
140 |
0.86 |
1.4 |
430 |
150 |
4.9 |
240 |
NA |
3100 |
7.68d |
1.003 |
4.91 |
|
SNL-13c |
LMi |
4/26/2005 |
190000 |
5300 |
76 |
1400 |
ND |
3700 |
10000 |
2300 |
95000 |
NA |
NA |
6.55d |
1.190 |
-2.72 |
|
C-2737 |
M |
1/30/2007 |
4100 |
2400 |
38 |
6 |
3.4 |
910 |
290 |
26 |
2200 |
17 |
14000 |
8.32 |
1.011 |
-0.3 |
|
C – Culebra ND – Not detected above detection limit e open hole 11 m deep DL – Dewey Lake a Denotes measurement made in the field; pH values uncorrected for ionic strength f open hole 64 m deep LM – Los Medaños b Denotes sample collected by bailing/pumping with little purging g open hole 63.4 m deep M – Magenta c Denotes opportunistic sample collected during drilling h open hole 92.7 m deep NA – Not analyzed d Denotes laboratory value instead of field measurement; pH values uncorrected for ionic strength i open hole 146.3 m deep mg/L – milligrams per liter j ([sum of cation milliequivalents-sum of anion milliequivalents]/[sum of cation milliequivalents+sum of anion milliequivalents])×100 |
||||||||||||||||
Figure HYDRO-48. Piper Plots for Water Samples from Culebra Wells WQSP-1 Through WQSP-6 Showing Both Historical Data from 1995 Through 2002 (Gray Areas) and Results from 2003 Through 2007 (Blue Stars)
Using data from only 22 wells, Siegel, Robinson, and Myers (1991) originally defined four hydrochemical facies (A, B, C, and D) for Culebra groundwater based primarily on ionic strength and major constituents (Table HYDRO-6). With the data now available from 59 wells, Domski and Beauheim (2008) defined transitional A/C and B/C facies, as well as a new facies E for high- moles per kilogram (molal) Na-Mg Cl brines. The spatial distribution of these wells and facies is shown in Figure HYDRO-49, along with the ionic strength of the Culebra water at each well. Note especially the position of facies E with respect to the Rustler halite margins. Figure HYDRO-50 presents a Piper plot showing how the facies differ in the relative percentages of major ions.
Table HYDRO-6. Culebra Hydrochemical Facies
|
|
Facies |
Siegel, Robinson, and Myers (1991) |
Domski and Beauheim (2008) |
|
B |
Dilute (ionic strength ≤0.1 molal) CaSO4-rich groundwater, from southern high-T area |
Same as Siegel, Robinson, and Myers (1991), Mg/Ca molar ratio 0.32 to 0.52 |
|
|
B/C |
Not differentiated |
Ionic strength 0.18 to 0.29 molal, Mg/Ca molar ratio 0.4 to 0.6 |
|
|
C |
Variable composition waters, Mg/Ca molar ratio 0.3 to 1.2 for waters with ionic strength <1.25 molal |
Ionic strength 0.3 to 1.0 molal, Mg/Ca molar ratio 0.4 to 1.1 |
|
|
A/C |
Not differentiated |
Ionic strength 1.1 to 1.6 molal, Mg/Ca molar ratio 0.5 to 1.2 |
|
|
A |
Ionic strength ~2 to 3 molal, Mg/Ca molar ratio 1.2 to 2 |
Ionic strength >1.66 molal, up to 5.3 molal, Mg/Ca molar ratio 1.2 to 2.4 |
|
|
D |
Defined based on inferred contamination related to potash refining operations. Ionic strength 3 molal, K/Na weight ratios of ~0.2 |
Same as Siegel, Robinson, and Myers (1991) |
|
|
E |
Not sampled |
Wells east of the mudstone-halite margins, ionic strength 6.4 to 8.6, Mg/Ca molar ratio 4.1 to 6.6 |
The low-ionic-strength (≤0.1 molal) facies B waters contain more sulfate than chloride, and are found southwest and south of the WIPP site within and down the Culebra hydraulic gradient from the southernmost closed catchment basins mapped by Powers (2006b) in the southwest arm of Nash Draw (Figure HYDRO-47). These waters reflect relatively recent recharge through gypsum karst overlying the Culebra. However, with total dissolved solids (TDS) concentrations in excess of 3000 mg/L, the facies B waters do not in any way represent modern-day precipitation rapidly reaching the Culebra. They must have residence times in the Rustler sulfate units of thousands of years before reaching the Culebra.
The higher-ionic-strength (0.3–1 molal) facies C brines have differing compositions, representing meteoric waters that have dissolved CaSO4, overprinted with mixing and localized processes. Facies A brines (ionic strength 1.6–5.3 molal) are high in NaCl and are clustered along the M3-H3 halite margin (Figure HYDRO-49). Facies A represents old waters (long flow paths) that have dissolved halite and/or mixed with connate brine from facies E. The facies D
Figure HYDRO-49. Culebra Hydrochemical Facies
Figure HYDRO-50. Piper Plot for Culebra Water Samples Categorized by Hydrochemical Facies
brines, as identified by Siegel, Robinson, and Myers (1991), are high-ionic-strength solutions found in western Nash Draw with high K/Na ratios representing waters contaminated with effluent from potash refining operations. Similar water is found at shallow depth (<11 m [36 ft]) in the upper Dewey Lake at SNL-1, just south of the Intrepid East tailings pile (see below). The newly defined facies E waters are very high ionic strength (6.4–8.6 molal) NaCl brines with high Mg/Ca ratios. The facies E brines are found east of the WIPP site, where Rustler halite is present above and below the Culebra, and halite cements are present in the Culebra. They represent primitive brines present since deposition of the Culebra and immediately overlying strata.
Five “opportunistic” groundwater samples are listed in Table HYDRO-5. A sample was collected during the drilling of SNL-1 when the hole was at a depth of 11 m (36 ft) in the upper Dewey Lake (Powers and Richardson 2004c). The water level in the hole at the time of sampling was approximately 9.5 m (31 ft) below ground surface (bgs). Another sample was collected during drilling of SNL-13 when the hole was at a depth of 64 m (210 ft), 5.5 m (18 ft) past the Dewey Lake-Rustler contact in the upper anhydrite of the Forty-niner (Powers and Richardson 2008a). The water level in the hole at the time of sampling was approximately 45.9 m (151 ft) bgs. Two samples were collected during drilling of SNL-14 when the hole was at different depths in the Dewey Lake: 63.4 m (208 ft) and 92.7 m (304 ft) bgs (Powers and Richardson 2008b). When the first sample was collected, the water level was at approximately 53.8 m (176.6 ft) bgs, and was at approximately 51.2 m (167.9 ft) bgs when the second sample was collected. The fifth sample was collected during drilling of SNL-13 when the hole was at a depth of 146.3 m (480 ft) in the Los Medaños Member of the Rustler (Powers and Richardson 2008a). The lower ~4 m (12 ft) of the hole produced 1.6 to 1.9 L/s (25 to 30 gpm) of brine, preventing continuation of the hole using compressed air as the circulation medium. The sample was collected from a container used to hold the brine blown from the hole. Considering how little water was produced to the hole from other zones (e.g., Culebra, Magenta, Dewey Lake), the sample should be largely representative of the Los Medaños brine.
Figure HYDRO-51 shows a Piper plot of the relative solute concentrations for the five opportunistic groundwater samples and also for Dewey Lake water from well WQSP-6A (Round 17; U.S. Department of Energy 2004c). The Dewey Lake samples from SNL-13, SNL-14, and WQSP-6A fall in approximately the same region as Culebra facies B samples (Figure HYDRO-50), except that the SNL-14 sample collected when the hole was only 63.4 m (208 ft) deep contained more magnesium and bicarbonate than the other samples. These are all low-TDS waters originating from meteoric recharge. The Dewey Lake sample from SNL-1, in contrast, is a high-TDS brine with a K/Na weight ratio of 0.23, similar to the Culebra facies D brines. This brine appeared to be perched in the upper Dewey Lake and probably comes from the Intrepid potash tailings pile, which is only a few hundred meters north of SNL-1 (see Figure HYDRO-6). The Los Medaños sample from SNL-13 is also a high-TDS brine, but it lacks a high K/Na ratio. It appears to be similar to the Culebra facies E brines, which occur where halite is present above, below, and within the Culebra (Figure HYDRO-49). While no halite was noted in the Los Medaños at SNL-13 during drilling (Powers and Richardson 2008a), the hole is adjacent to the margin of halite in the Los Medaños (M1-H1) identified by Powers 2007, Figure HYDRO-49. Halite may be dissolving, or have been dissolved, along this margin.
Biannual sampling of wells WQSP-1 through 6 has shown that Culebra water chemistry has remained stable for over 12 years at these wells, as expected. Groundwater sampling over the entire Culebra well network has greatly expanded on the database used by Siegel, Robinson, and Myers (1991) to delineate four Culebra groundwater facies. Five primary facies and two transitional facies are now recognized. The new facies (E) is a high ionic strength (6.4-8.6 molal) Na-Mg Cl brine found in new wells east of all the Rustler M-H boundaries where halite is present in the Culebra. It is thought to represent primitive brine present since deposition of the Culebra and immediately overlying strata. The definition of transitional A/C and B/C facies adds detail to the original conclusions of Siegel, Robinson, and Myers (1991).
A brine sample collected from the Los Medaños in SNL-13 near the M1-H1 boundary is very similar to the Culebra facies E brine, and may have a similar Permian origin. A sample collected at shallow depth in SNL-1 is a high-TDS brine similar to the Culebra facies D brines that have
Figure HYDRO-51. Piper Plot of WQSP-6A and Opportunistic Samples
been contaminated by potash processing. The SNL-1 brine probably originates from the Intrepid East tailings pile a few hundred meters to the north. Dewey Lake samples from SNL-13, SNL-14, and WQSP-6A are low-TDS waters similar to, but fresher than, the Culebra facies B waters. The Dewey Lake water originates from meteoric recharge of undetermined age.
Since 1989, a general long-term rise in Culebra and Magenta water levels has been observed in WIPP wells. As the rise in water levels continued through the 1990s and early 2000s, observed heads exceeded the ranges of uncertainty established for the steady-state heads in most of the 32 wells used to calibrate the T fields for the CCA, necessitating an investigation into the cause(s) and consequences of the rise. In AP-110, Analysis Plan for Evaluation of Culebra Water-Level-Rise Scenarios, Beauheim (2003) postulated three scenarios that could account for the long-term water-level rise. The scenarios were (1) leakage into the Culebra of refining process water discharged onto potash tailings piles or into ponds, probably through subsidence-induced fractures and/or leaky boreholes; (2) leakage into the Culebra of water from units above the Culebra (Magenta and/or Dewey Lake) or below the Culebra (e.g., Salado, Bell Canyon) through poorly plugged and abandoned boreholes; and (3) leakage into the Culebra of water being injected at depth (e.g., into the Bell Canyon Formation) through leaky boreholes. Note that this analysis plan and the strategy it defined to evaluate the three scenarios were developed before the wells and new data showing Culebra water-level responses to rainfall discussed in Section HYDRO-5.0 were available.
Three tasks defined in AP-110 have been completed to date:
Task 1—Data assembly and screening
Task 2—Simulate leakage from tailings pile
Task 3—Simulate leakage through poorly plugged and abandoned potash boreholes
The Intrepid East tailings pile located 10 to 12 km (6 to 7.5 mi) due north of the WIPP site (Figure HYDRO-6) is the tailings pile most likely to affect water levels north of and on the WIPP site. Disposal of mine tailings and refining-process effluent at that location began in 1965. Records obtained from the New Mexico Office of the State Engineer show how much water has been pumped from local aquifers (Ogallala or Capitan) each year from 1973 through 1999 for use in the potash-refining process at the Intrepid East facility (Figure HYDRO-52). Over that period, an average of 2400 acre-ft (3.0 ´ 106 m3) of water per year was pumped. Geohydrology Associates (1978) estimated that approximately 90% of this water is discharged onto the tailings pile, and that approximately half of the brine discharged seeps into the ground annually, while the remainder evaporates. Therefore, on average, approximately 1100 acre-ft (1.4 ´ 106 m3) of brine may infiltrate each year. Brine from this tailings pile may enter the Rustler through leaky boreholes and/or by first moving laterally into Nash Draw and then downward through subsidence fractures that have opened over potash mine workings.
For Task 1 of AP-110 (data assembly and screening), Powers (2004a) examined the P&A records filed with the BLM for 576 potash exploration holes within (or very near to) the Culebra modeling domain, and divided the holes among the categories given in Table HYDRO-7. The spatial distribution of these holes is shown in Figure HYDRO-53. Twenty-six holes within the active portion of the Culebra modeling domain were found to belong to Categories 4 or 5, indicating the potential for communication between the Culebra and other units.
Figure HYDRO-52. Annual Water Pumped for Intrepid East Potash Mill Location
Table HYDRO-7. Cementing Categories for Potash and Other Drillholes in the Modeling Domain
|
Cementing Category |
Characteristics |
|
1 |
Data indicate drillhole was cemented from total depth to surface |
|
2 |
Data indicate Culebra interval is completely cemented, with a high degree of certainty |
|
3 |
Culebra intercepted by drillhole; cement intervals in drillhole; data not clear regarding cementing across Culebra interval |
|
4 |
Culebra intercepted by drillhole; cement interval in drillhole does not match Culebra interval |
|
5 |
Apparent open hole |
|
6 |
Plugging information not available for drillhole |
|
7 |
Drillhole is too shallow to intercept Culebra; plugging not considered |
|
10 |
Drillhole is completed to Culebra for monitoring or water well; plugging not considered |
Figure HYDRO-53. Cementing Categorization for Potash Exploration Holes Within and Near the Culebra Modeling Domain. (See Table HYDRO-7 for Key to Categories.)
Powers (2004b) also evaluated cementing and casing records for all plugged and abandoned oil and gas wells within or near the Culebra modeling domain. He found records for 92 plugged and abandoned wells, of which 57 were clearly plugged through the Culebra, 24 were clearly not plugged through the Culebra, 8 lacked information to evaluate plugging through the Culebra, and 3 were possibly open to at least part of the Culebra (Figure HYDRO-54).
For Task 2 of AP-110 (simulate leakage from tailings pile), Lowry and Beauheim (2004) used MODFLOW (Harbaugh et al. 2000) and PEST (Doherty 2002) to model the amount of water that would have to infiltrate into the Culebra at the Intrepid East tailings pile north of the WIPP site to cause water levels to rise as much as has been observed. The modeling was performed using the 100 calibrated T fields from McKenna and Hart (2003) found in CRA-2004. Each T field was recalibrated using PEST to match the average rates of water-level rise in 13 monitoring wells (AEC-7, D-268, DOE-2, H-4b, H-5b, H-6b, H-7b1, P-14, P-15, WIPP-13, WIPP-25, WIPP-26, and WIPP-30) close to the tailings pile or Nash Draw over the last 10 to 25 years of record. The recalibration was performed using three calibration parameters: specific storage (Ss) in the Nash Draw area, Ss outside the Nash Draw area, and a constant leakage or recharge rate from the Intrepid East tailings pile to the Culebra. The calibration was transient using a simulation time of 27 years, 1977 through 2003, which goes back to the beginning of water-level monitoring for the WIPP. The simulations did not attempt to match transient aspects of the water-level rise in a well, but only the average rise over the period showing a consistent rise. Simple linear regression was used to calculate the average slopes of both the observed and simulated water-level changes.
Inverse modeling using PEST only guarantees that an objective function reaches a minimum value. It does not guarantee that the calibrated values will reflect reality, or other observations not included in the calibration process. Thus, the recalibrated T fields were filtered using the following criteria:
1. If the calibrated value of any parameter reached its allowable maximum or minimum, or if the total recharge was greater than the amount applied to the tailings pile, the T field was not included
2. If the value for Ss in the Nash Draw area was lower than that elsewhere in the model domain, the T field was not included
Filtering the 100 original T fields resulted in 53 left for analysis.
The calibrated recharge through the Intrepid East tailings pile to the Culebra ranged from 2.17 ´ 10-4 to 1.47 ´ 10-2 cubic meters per second (m3/s) (5.5 to 376 acre-ft/yr), with a mean value of 2.88 ´ 10-3 m3/s (73.5 acre-ft/yr). Thus, only 0.5 to 34% of the 1100 acre-ft/yr estimated to be infiltrating from the tailings pile, with a mean of 6.7%, would have to reach the Culebra to cause water levels to rise as much as has been observed in the various wells. This may indicate that the majority of the infiltrating water may be reaching only shallower strata, such as the Dewey Lake and/or Magenta.
Figure HYDRO-54. Plugged and Abandoned Oil and Gas Wells Within and Near the Culebra Modeling Domain
For Task 3 of AP-110 (simulate leakage through poorly plugged and abandoned potash boreholes), Lowry and Beauheim (2005) used the information compiled by Powers (2004a) on plugged and abandoned potash boreholes to model the effects that leakage into the Culebra through these holes might have on Culebra water levels. Specifically, using each of the 100 T fields developed for CRA-2004, they attempted to calibrate the T fields to the observed rates of water-level rise at 12 wells (those used for Task 2, excluding DOE-2) by adjusting the leakage rates in the 26 holes identified by Powers (2004a) as being in Categories 4 and 5. To simplify the calibration, the 26 potentially leaky holes were divided into 4 groups based on their locations, as shown in Figure HYDRO-55, and the same leakage rate was applied to all holes within a group.
Lowry and Beauheim (2005) tried three ways of matching the observed water-level rises. All three methods involved linearizing the observation-well hydrographs over the last 10 to 25 years of record to calculate an average rate of water-level rise. Information about the three options is summarized in Table HYDRO-8. The calibration attempted to adjust the calibration variables to minimize the difference between the linearized observed and simulated water-level change at each of the 12 wells. The values of variables kept fixed during the calibrations are shown in parentheses in Table HYDRO-8.
In the first method (Option A), the leakage (injection) rates in the four groups of boreholes were varied in an attempt to match the amount (not rate) of water-level rise that would be produced by injecting water into the Culebra at the leaky borehole locations for 15 years to the amount of rise given by the linearized observed rate over the same period. Of the 100 T fields, 66 completed the calibration process. The calibrated leakage rates for the groups of boreholes are shown in Table HYDRO-8.
On average, a total of 4.41 ´ 10-4 m3/s (11.3 acre-ft/yr or 7 gpm) of leakage was required to match the observed water-level rises, with 66.5% leaking through the Upper group of holes, 0.1% from the Mid group, 16.1% from the Nash Draw group, and 17.3% from the Lower group. However, the Option A method tended to produce higher rates of water-level rise at the start of the 15-year simulation and lower rates at the end than the linearized observed rates. On average, the Option A fits tended to be worst at wells P-14, WIPP-25, H-4b, and P-15, and best at wells H-5b and AEC-7.
For Option B, rather than attempting to match the amount of water-level rise over 15 years, only the rise over the last 6 years of the 15-year simulation period was compared to the rise produced by the linearized observed rate. In addition, the Mid and Nash Draw groups of boreholes were combined into a single group for this option. T fields were disqualified if the calibration produced a total water-level rise in any well over the 15-year simulation period exceeding 50 m, because that would put the head above that of the potential sources of leakage in the Magenta and Dewey Lake. With this exclusion criterion, 77 of the 100 T fields produced acceptable results. The calibrated leakage rates for Option B for the groups of boreholes are shown in Table HYDRO-10.
Figure HYDRO-55. Modeling Domain Showing Boundary Features, Monitoring Well Locations, Nash Draw Area, WIPP Boundary, and the Grouping of the Leaky Boreholes for Use in the Calibration Process. Well Categories are Defined in Table HYDRO-7.
|
Table HYDRO-8. Options Used to Recalibrate T Fields to Leaking Boreholes
Table HYDRO-9. Option A Total Leakage Rates for Each Group of Leaky Boreholes |
||||||||||||||||||||||||||||||||||||||||||||
|
Statistic |
Leakage by Group (m3/s) |
|||||||||||||||||||||||||||||||||||||||||||
|
Upper |
Mid |
Nash Draw |
Lower |
Total |
||||||||||||||||||||||||||||||||||||||||
|
Average |
2.93 ´ 10-4 |
6.39 ´ 10-7 |
7.09 ´ 10-5 |
7.63 ´ 10-5 |
4.41 ´ 10-4 |
|||||||||||||||||||||||||||||||||||||||
|
Median |
2.31 ´ 10-4 |
3.00 ´ 10-9 |
5.95 ´ 10-5 |
6.47 ´ 10-5 |
3.55 ´ 10-4 |
|||||||||||||||||||||||||||||||||||||||
|
Maximum |
3.17 ´ 10-3 |
4.94 ´ 10-6 |
2.56 ´ 10-4 |
3.10 ´ 10-4 |
3.28 ´ 10-3 |
|||||||||||||||||||||||||||||||||||||||
|
Minimum |
1.33 ´ 10-5 |
6.00 ´ 10-10 |
5.19 ´ 10-9 |
7.60 ´ 10-6 |
8.10 ´ 10-5 |
|||||||||||||||||||||||||||||||||||||||
|
Std. Dev. |
4.01 ´ 10-4 |
1.34 ´ 10-6 |
6.56 ´ 10-5 |
5.64 × 10⁻⁵ |
4.05 ´ 10-4 |
|||||||||||||||||||||||||||||||||||||||
Table HYDRO-10. Option B Total Leakage Rates for Each Group of Leaky Boreholes
|
Statistic |
Leakage by Group (m3/s) |
||||
|
Upper |
Mid |
Nash Draw |
Lower |
Total |
|
|
Average |
8.00 ´ 10-4 |
7.24 ´ 10-8 |
3.62 ´ 10-8 |
2.32 ´ 10-3 |
3.12 ´ 10-3 |
|
Median |
8.85 ´ 10-5 |
5.78 ´ 10-8 |
2.89 ´ 10-8 |
1.63 ´ 10-3 |
2.26 ´ 10-3 |
|
Maximum |
1.22 ´ 10-2 |
5.65 ´ 10-7 |
2.82 ´ 10-7 |
1.02 ´ 10-2 |
1.22 ´ 10-2 |
|
Minimum |
7.54 ´ 10-8 |
6.33 ´ 10-10 |
3.17 ´ 10-10 |
2.50 ´ 10-6 |
2.46 ´ 10-4 |
|
Std. Dev. |
1.80 ´ 10-3 |
9.18 ´ 10-8 |
4.59 ´ 10-8 |
2.33 ´ 10-3 |
2.60 ´ 10-3 |
As expected, more leakage was required under Option B than under Option A. On average, a total of 3.12 ´ 10-3 m3/s (80 acre-ft/yr or 49 gpm) of leakage was required to match the observed water-level rises, with 25.6% leaking through the Upper group of holes and 74.4% through the Lower group. The leakages through the Mid and Nash Draw groups of holes were comparatively negligible. On average, the Option B fits tended to be worst at wells P-14, WIPP-25, H-4b, and P-15, the same as for Option A, but best at wells H-7b1 and WIPP-13, different from Option A.
For Option C, modeling attempted to match only the rise over the last 6 years of the 15-year calibration period, as was done for Option B, but the leakage rate for the Nash Draw group of boreholes was fixed at 7.09 ´ 10-5 m3/s (1.8 acre-ft/yr or 1.12 gpm) (the average rate from Option A), and Ss was allowed to vary between Nash Draw and the area outside of Nash Draw. T-fields were disqualified if the water-level rise at any well exceeded 50 m (164 ft), if the calculated Ss reached either the upper or lower calibration limit (1 ´ 10-4 and 1 ´ 10-8 m-1, respectively), or if the Ss calculated for Nash Draw was lower than that calculated for the region outside of Nash Draw. As a result, only 65 of the 100 T fields produced results considered acceptable. The calibrated leakage rates and Ss values for Option C are shown in Table HYDRO-11.
Less total leakage was required under Option C than under Option B, but more than under Option A. On average, a total of 1.28 ´ 10-3 m3/s (33 acre-ft/yr or 20 gpm) of leakage was required to match the observed water-level rises, with 28.5% leaking through the Upper group of holes, 1.9% through the Mid group, 5.5% (fixed) through the Nash Draw group, and 64.1% through the Lower group. The average Ss in Nash Draw was 4.9 ´ 10-5 m-1, while that outside of Nash Draw was 6.4 ´ 10-6 m-1. On average, the Option C fits tended to be worst at wells H-7b1, WIPP-13, WIPP-25, and P-14, and best at wells AEC-7 and WIPP-26, and generally better than the fits from either Option A or Option B. Overall, the Option C fits were better than those from the other options.
Table HYDRO-11. Option C Total Leakage Rates for Each Group of Leaky Boreholes and Ss values. SsND is the Specific Storage in Nash Draw, Ss is the Specific Storage Elsewhere.
|
Statistic |
Leakage by Group (m3/s) |
Specific Storage (m-1) |
||||
|
Upper |
Mid |
Lower |
Totala |
SsND |
Ss |
|
|
Average |
3.64 ´ 10-4 |
2.42 ´ 10-5 |
8.18 ´ 10-4 |
1.28 ´ 10-3 |
4.91 ´ 10-5 |
6.40 ´ 10-6 |
|
Median |
2.30 ´ 10-4 |
9.10 ´ 10-6 |
6.57 ´ 10-4 |
1.18 ´ 10-3 |
4.72 ´ 10-5 |
3.02 ´ 10-6 |
|
Maximum |
1.59 ´ 10-3 |
3.07 ´ 10-4 |
2.98 ´ 10-3 |
3.85 ´ 10-3 |
9.99 ´ 10-5 |
5.55 ´ 10-5 |
|
Minimum |
8.23 ´ 10-7 |
6.65 ´ 10-8 |
7.19 ´ 10-5 |
2.73 ´ 10-4 |
3.28 ´ 10-6 |
1.02 ´ 10-8 |
|
Std. Dev. |
4.07 ´ 10-4 |
4.55 ´ 10-5 |
6.04 ´ 10-4 |
7.08 ´ 10-4 |
2.51 ´ 10-5 |
8.91 ´ 10-6 |
|
a Includes the fixed leakage of 7.09 ´ 10-5 m3/s for the Nash Draw group. |
||||||
The calibrated Option C T fields were then used to evaluate the continuing effects of leakage. Simulations were run for an additional 100-yr period holding the leakage rates constant at their calibrated values to see how much water levels might continue to rise. For most wells and T fields, the additional rise is less than 8 m (26 ft). Figure HYDRO-56 shows a histogram of the results.
Figure HYDRO-56. Histogram of the Maximum Additional Water-Level Rise for the Last 100 Years of the Long-Term Option C Simulations. The Vertical Green and Red Lines Represent the Median (1.53 m [5.01 ft]) and Mean (2.02 m [6.62 ft]) Values, Respectively.
Comparisons of the leakage rate in each group of boreholes for each option are shown in Table HYDRO-12. For all three options, the leakage rate for the Upper group of boreholes was the most consistent, ranging from 2.93 ´ 10-4 to 8.00 ´ 10-4 m3/s (7.5 to 20.5 acre-ft/yr or 4.64 to 12.7 gpm). Leakage rates for the other three groups show a variability of two to three orders of magnitude among the different options. The total leakage rate was about one order of magnitude higher for Options B and C than for Option A, primarily because the early transient period, in which most of the head rise occurred, was excluded from the calibration process for Options B and C. With this early period excluded, more leakage was required to match the late-time head rise.
The contribution to the total leakage from
the Upper group of boreholes for Option A was much higher than
for Options B or C (66.5% for Option A versus 25.6% and 28.5 %
for Options B and
Table HYDRO-12. Comparison of Mean Calibration Parameters for All Three Options. Percentages Show Percent of Leakage from That Group to the Total Leakage
|
Parameter |
Option |
||
|
A |
B |
C |
|
|
Leakage in Upper Group (m3/s) |
2.93 ´ 10-4 (66.5%) |
8.00 ´ 10-4 (25.6%) |
3.64 ´ 10-4 (28.5%) |
|
Leakage in Mid Group (m3/s) |
6.39 ´ 10-7 (0.1%) |
7.24 ´ 10-8 (0.0%) |
2.42 ´ 10-5 (1.9%) |
|
Leakage in Nash Draw Group (m3/s) |
7.09 ´ 10-5 (16.1%) |
3.62 ´ 10-8 (0.0%) |
7.09 ´ 10-5a (5.5%) |
|
Leakage in Lower Group (m3/s) |
7.63 ´ 10-5 (17.3%) |
2.32 ´ 10-3 (74.4%) |
8.18 ´ 10-4 (64.1%) |
|
Total Leakage (m3/s) |
4.41 ´ 10-4 |
3.12 ´ 10-3 |
1.28 ´ 10-3 |
|
a Fixed as the average from Option A |
|||
C, respectively). Conversely, the contribution by the Lower group was 17.3%, 74.4%, and 64.1% for Options A, B, and C, respectively. This highlights the difference between the two conceptual models (full-time calibration and late-time calibration) and means that if the water-level rise is in quasi-steady-state, a significant amount of leakage must be entering the Culebra from a source south of the WIPP site.
The amounts of leakage listed in Table HYDRO-12 are not large, and are not unreasonable when compared to the capacities of the potential sources. Taking the Option C results as an example, the average total leakage through the Upper group of boreholes is only 3.64 ´ 10-4 m3/s (5.8 gpm or 9.3 acre-ft/yr), distributed among 16 boreholes. The 1100 acre-ft/yr of water that may be infiltrating from the Intrepid East tailings pile into the upper groundwater system in the vicinity of the Upper group is over 100 times the amount calculated to be leaking through the Upper group boreholes. The average total leakage through the Mid group of boreholes is only 2.42 ´ 10-5 m3/s (0.6 acre-ft/yr or 0.38 gpm), distributed among 6 boreholes. This is within the capacity of the Magenta in this area (but see the discussion in the next paragraph). The fixed leakage through the 3 boreholes in the Nash Draw group totaled 7.09 ´ 10-5 m3/s (1.8 acre-ft/yr or 1.12 gpm). Considering the fractured nature of most of the geologic section in Nash Draw due to subsidence and collapse, the Magenta (or Dewey Lake where saturated) could easily be the source of the leakage through the Nash Draw group of boreholes. The average total leakage through the single borehole in the Lower group is 8.18 ´ 10-4 m3/s (20.9 acre-ft/yr or 13.0 gpm). A Dewey Lake water table is present in this area (Powers and Richardson 2004a). Beauheim and Ruskauff (1998) report that the Dewey Lake could be pumped at a rate of 7.57 ´ 10-4 m3/s (19.4 acre-ft/yr or 12 gpm) in well WQSP-6A with only 2 m of drawdown. Hence, the Dewey Lake could plausibly be providing 8.18 ´ 10-4 m3/s to a leaky borehole.
With respect to the Mid group of boreholes, monitoring points on the nearby NW and NE corners of the WIPP site (wells H-6 and H-5, respectively) show Magenta heads rising in a manner similar to those in the Culebra, the opposite of what would be expected if Magenta water were leaking into the Culebra. The Dewey Lake does not appear to be saturated in any zone with significant permeability in this region, so no driving force seems to be present above the Magenta. Given these observations and the low leakage rates calculated by the model, the boreholes in the Mid group may not, in fact, be leaking. The observed rises in both Culebra and Magenta heads in the vicinity of the Mid group of boreholes may be explained by pressure propagation from the Upper group of boreholes, or by pressure propagation from recharge reaching the Magenta and Culebra in Nash Draw.
The modeling results show that a balance must be achieved between leakage in the Upper group of boreholes and in the Lower and (to a much lesser extent) Nash Draw groups of boreholes in order to produce the observed head rise in the 12 monitoring wells. If no water is leaking through the Lower borehole, then heads to the south of the WIPP site are too low and the observed water-level rise cannot be reproduced in the middle part of the modeling domain. As discussed above, the required amount of leakage could plausibly be coming from the Dewey Lake to the Culebra through the Lower group borehole. As a conceptual model alternative to the potentially leaking Lower group borehole, however, the Culebra could instead (or also) be receiving natural recharge southwest of the WIPP site, where it is believed to be unconfined. This hypothesis is consistent with the recent observations of Culebra wells responding to rainfall in Nash Draw discussed in Section HYDRO-5.0.
Lowry and Beauheim (2005) expected the leaky-borehole scenario to require less water to match the observed water-level rise than the tailings-pile scenario investigated by Lowry and Beauheim (2004) because it distributes the source, allowing head rises to occur in the south without the water having to come from the north. The tailings-pile scenario, on the other hand, relied only on inflow from the northern portion of the model domain. The mean leakage rate from the tailings-pile recharge scenario from Lowry and Beauheim (2004) is 2.88 ´ 10-3 m3/s (73.6 acre-ft/yr or 45.6 gpm). This value is similar to the total leakage rates from Options B and C for the leaky-borehole scenario. However, the tailings-pile-scenario modeling used the Option A method of trying to match the head rise over the entire simulation period to the linearized hydrographs. Had that modeling used the Option B or Option C method of fitting to only the last six years’ data, an order of magnitude more leakage may well have been required. Note that the tailings-pile scenario introduces water into the Culebra at essentially the same location as the Upper group of boreholes in the leaky-borehole scenario. Even using the Option A method of calibration, the tailings-pile scenario required an order of magnitude more leakage at the north end of the model domain than the leaky-borehole scenario.
Given the uncertainties and limitations in the model and available data, Lowry and Beauheim (2005) concluded that leakage from units above the Culebra through poorly plugged and abandoned boreholes is a plausible explanation for the long-term rise in water levels observed on and around the WIPP site. The Intrepid East tailings pile may well be the source of the water leaking through a northern group of boreholes, so a combination of the tailings-pile and leaky-borehole scenarios is probably the best explanation for the water-level rises. Natural recharge south of the WIPP where the Culebra is unconfined (or leakage through poorly plugged oil and gas wells) could provide the water ascribed to the southern borehole in the Task 3 calculations. The objective of the water-level rise investigation is considered to have been met by the completion of Tasks 2 and 3. Consequently, modeling the effects of leakage through poorly plugged oil and gas wells and simulation of leakage from injection wells (Task 4 of AP-110) are no longer considered necessary—they would only provide further confirmation that some physically reasonable amount of leakage through unconfirmed, but realistic, pathways is consistent with the observed rising water levels.
Hydrological investigations conducted from 2003 through 2007 provided a wealth of new information, some of it confirming long-held assumptions and some offering new insight into the hydrological system around the WIPP site. A Culebra monitoring-network optimization study was completed by McKenna (2004) to identify the locations where new Culebra monitoring wells would be of most value, and to identify wells that could be removed from the network with little loss of information. Eighteen new wells have been completed, guided by the optimization study, geologic motivations, and/or unique opportunities. Seventeen unneeded wells have been plugged and abandoned, and two others have been transferred to the BLM.
The WIPP groundwater monitoring program has augmented monthly water-level measurements in wells with continuous (~hourly) fluid-pressure measurements using downhole programmable pressure gauges (TROLL®). The most significant new finding arising from the high-frequency measurements has been the observation of Culebra water-level responses to rainfall in Nash Draw. The Culebra has long been suspected of being unconfined in at least portions of Nash Draw because of dissolution of the upper Salado, subsidence and collapse of the overlying Rustler, and karst in Rustler gypsum units (e.g., Beauheim and Holt 1990). Continuous monitoring with TROLL® gauges, however, has provided the first direct evidence of Culebra water levels responding to rainfall. Furthermore, the rainfall-induced head changes originating in Nash Draw are now observed to propagate under Livingston Ridge and across the WIPP site over periods of days to months (Hillesheim, Hillesheim, and Toll 2007), explaining some of the changes in Culebra water levels that have occurred from one month to the next. Other water-level changes that appear to occur quite suddenly can now be conclusively related to drilling of nearby oil and gas wells.
Extensive hydraulic testing has been performed in the new wells. This testing has involved both single-well tests, which provide information on local transmissivity and heterogeneity, and long-term (19 to 32 days) pumping tests that have created observable responses in wells up to 9.5 km (5.9 mi) away. The transmissivity values inferred from the single-well tests support the correlation between geologic conditions and Culebra transmissivity developed by Holt and Yarbrough (2002) and elucidated by Holt, Beauheim, and Powers (2005). The types of heterogeneities indicated by the diagnostic plots of the pumping-test data are consistent with the known spatial distribution of transmissivity in the Culebra. Mapping of diffusivity values obtained from analysis of observation-well responses to pumping tests shows areas north, west, and south of the WIPP site connected by fractures, and also a wide area that includes a NE-to-SW swath across the WIPP site where hydraulically significant fractures are largely absent (Beauheim 2007). This mapping, combined with the responses observed to the long-term SNL-14 pumping test, has confirmed the presence of a high-T area extending from the SE quadrant of the WIPP site to at least 10 km to the south.
Geologic studies between 2003 and 2007 focused on Rustler halite margins and karst. The map of Rustler halite margins delineated by Powers (2002) for CRA-2004 was revised by Powers (2007) to incorporate data from recent drilling around the WIPP site. Lorenz (2006a and 2006b) reviewed all historical data and arguments on karst at WIPP, concluding that most of the geological evidence offered for the presence of karst in the subsurface at the WIPP site “has been used uncritically and out of context, and does not form a mutually supporting, scientifically defensible framework. The remaining evidence is more readily interpreted as primary sedimentary features” (Lorenz 2006b, p. 243). Powers et al. (2006b) provided new details on the gypsum karst present in the Rustler in Nash Draw. Powers (2006a) studied some of the natural brine lakes in Nash Draw, finding some of them to be fed by a shallow gypsum karst system with enough storage to sustain year-round flow, while others were fed by the potash processing effluent discharged by Mosaic Potash Carlsbad into Laguna Uno. Powers (2006a) also mapped closed catchment basins in the southwestern arm of Nash Draw that drain internally to karst features.
Extensive groundwater sampling has been performed in the new wells and selected older wells. The last major geochemical evaluation of Culebra groundwater was performed by Siegel, Robinson, and Myers (1991) based on samples from 22 wells. Samples are now available from 59 wells, allowing refinement and deepening of the conceptual understanding provided by Siegel et al. (1991). Whereas Siegel, Robinson, and Myers (1991) identified only four hydrochemical facies based primarily on ionic strength and major constituents, two transitional facies and one entirely new facies can now be delineated (Domski and Beauheim 2008). The spatial distribution of these facies is consistent with the locations of the Rustler halite margins, the distribution of transmissivity in the Culebra, and the areas of known or suspected recharge to the Culebra.
Combining the Culebra monitoring data with the mapping of catchment basins in southwestern Nash Draw and with groundwater geochemistry data provides insight into Culebra recharge. While some of the water entering gypsum karst in Nash Draw discharges into brine ponds such as Laguna Cinco, some portion of it must come into hydraulic communication with the Culebra, at least locally, because Culebra wells in Nash Draw show water-level responses to major rainfall events (e.g., Figure HYDRO-14). However, these responses do not mean that the precipitation reached the Culebra. Rather, they indicate that the Culebra cannot be completely confined, but must be in hydraulic communication with a water table in a higher unit that does receive direct recharge from precipitation. Some of this water must eventually reach the Culebra, where it is recognized as hydrochemical facies B, but it must first have spent a considerable period in the Rustler gypsum beds to have as high a TDS as it does. As a further indication of the indirect nature of recharge, the water from SNL-16 (located within the small catchment basin shown in yellow in Figure HYDRO-47) does not even fall in the domain of facies B, but is instead facies C water, even though SNL-16 shows a clear pressure response to major rainfall events (Figure HYDRO-14). This shows conclusively that rainfall is not flushing the Culebra rapidly in this area.
Lowry and Beauheim (2004 and 2005) concluded from two modeling studies that leakage from units above the Culebra through poorly plugged and abandoned boreholes is a plausible explanation for the long-term rise in water levels observed on and around the WIPP site. The Intrepid East tailings pile may well be the primary source of leaking water north of the WIPP site, while natural recharge where the Culebra is unconfined southwest of the site could provide the leaking water ascribed to a southern borehole in one of the modeling studies. The studies showed that a physically reasonable amount of leakage through unconfirmed but realistic pathways is consistent with the observed rising water levels.
Beauheim, R.L. 1986. Hydraulic-Test Interpretations for Well DOE-2 at the Waste Isolation Pilot Plant (WIPP) Site. SAND86-1364. ERMS 227656. Albuquerque: Sandia National Laboratories.
Beauheim, R.L. 1989. Interpretation of H-11b4 Hydraulic Tests and the H-11 Multipad Pumping Test of the Culebra Dolomite at the Waste Isolation Pilot Plant (WIPP) Site. SAND89-0536. Albuquerque, NM: Sandia National Laboratories.
Beauheim, R.L. 1999. Memo to Bryan Howard (Subject: Recompletion of Cabin Baby-1). 20 October 1999. ERMS 507982. Carlsbad, NM: Sandia National Laboratories.
Beauheim, R.L. 2003. Analysis Plan for Evaluation of Culebra Water-Level-Rise Scenarios. AP-110. ERMS 532799. Carlsbad, NM: Sandia National Laboratories.
Beauheim, R.L. 2004a. Analysis Plan for Non-Salado Hydraulic-Test Interpretations(Revision 1). AP-070. ERMS 537479. Carlsbad, NM: Sandia National Laboratories.
Beauheim, R.L. 2004b. Analysis Plan for Evaluation and Recalibration of Culebra Transmissivity Fields. AP-114. ERMS 537208. Carlsbad, NM: Sandia National Laboratories.
Beauheim, R.L. 2005. Memo to file (Subject: IMC-461, 462, and 463). 24 October 2005. ERMS 541654. Carlsbad, NM: Sandia National Laboratories.
Beauheim, R.L. 2007. “Diffusivity Mapping of Fracture Interconnections.” Proceedings of the 2007 U.S. EPA/NGWA Fractured Rock Conference (pp. 235–49). Westerville, OH: National Ground Water Association.
Beauheim, R.L., and R.M. Holt. 1990. “Hydrogeology of the WIPP Site.” Geological and Hydrological Studies of Evaporites in the Northern Delaware Basin for the Waste Isolation Pilot Plant (WIPP), New Mexico (pp. 131–79). Geological Society of America Field Trip No. 14 Guidebook. Dallas: Dallas Geological Society.
Beauheim, R.L., and S.A. McKenna. 2003. Analysis Plan for Optimization and Minimization of the Culebra Monitoring Network for the WIPP. AP-111. ERMS 533092. Carlsbad, NM: Sandia National Laboratories.
Beauheim, R.L., and R.M. Roberts. 2004. “Well-Test Analysis Techniques Developed for the Waste Isolation Pilot Plant.” Proceedings: 66th EAGE Conference and Exhibition, Paris, France, 7–10 June 2004 (Paper H005). Houten, the Netherlands: European Association of Geoscientists and Engineers.
Beauheim, R.L., and G.J. Ruskauff. 1998. Analysis of Hydraulic Tests of the Culebra and Magenta Dolomites and Dewey Lake Redbeds Conducted at the Waste Isolation Pilot Plant Site. SAND98-0049. ERMS 251839. Albuquerque: Sandia National Laboratories.
Beauheim, R.L., B.W. Hassinger, and J.A. Klaiber. 1983. Basic Data Report for Borehole Cabin Baby-1 Deepening and Hydrologic Testing, Waste Isolation Pilot Plant (WIPP) Project, Southeastern New Mexico. WTSD-TME-020. ERMS 241315. Carlsbad, NM: Westing House Electric Corporation.
Bourdet, D., J.A. Ayoub, and Y.M. Pirard. 1989. “Use of Pressure Derivative in Well-Test Interpretation.” SPE Formation Evaluation, vol. 4: 293–302.
Bowman, D.O., and R.M. Roberts. 2008. Analysis Report for AP-070: Analysis of Hydraulic Tests Performed in Wells IMC-461, SNL-6, H-11b2, H-15, and C-2737. ERMS Package # 539221. Carlsbad, NM: Sandia National Laboratories.
Chace, D.A. 2003. Compliance Monitoring Program: Recompletion and Testing of Wells for Evaluation of Monitoring Data from the Magenta Member of the Rustler Formation at the WIPP Site, Test Plan TP 00-03 (Rev. 1). ERMS 525860. Carlsbad, NM: Sandia National Laboratories.
Chace, D.A., and R.L. Beauheim. 2006. Test Plan for Testing of Wells at the WIPP Site, TP 03-01, Revision 2. ERMS 542262. Carlsbad, NM: Sandia National Laboratories.
Cotsworth, E. 2004a. Letter to R.P. Detwiler (1 Enclosure). 20 May 2004. ERMS 535554. U.S. Environmental Protection Agency, Office of Air and Radiation, Washington, DC.
Cotsworth, E. 2004b. Letter to R. Paul Detwiler, Acting Manager, Carlsbad Field Office, U.S. DOE. 2 September 2004. U.S Environmental Protection Agency, Office of Radiation and Indoor Air. Washington, DC.
Doherty, J. 2002. PEST: Model-Independent Parameter Estimation User Manual. 4th ed. Brisbane: Watermark Numerical Computing.
Domski, P.S., and R.L. Beauheim. 2005. Analysis Plan for the Evaluation of Culebra Brine Compositions. AP-125. ERMS 540680. Carlsbad, NM: Sandia National Laboratories.
Domski, P.S., and R.L. Beauheim. 2008. Evaluation of Culebra Brine Chemistry. AP-125. ERMS 549336. Carlsbad, NM: Sandia National Laboratories.
Geohydrology Associates, Inc. 1978. Ground-Water Study Related to Proposed Expansion of Potash Mining near Carlsbad, New Mexico. Contractor report to Bureau of Land Management, Denver, CO, Contract No. YA-512-CT7-217. Albuquerque, NM: Geohydrology Associates, Inc.
Harbaugh, A.W., E.R. Banta, M.C. Hill, and M.G. McDonald. 2000. MODFLOW-2000: The U.S. Geological Survey Modular Ground-Water Model—User Guide to Modularization Concepts and the Ground-Water Flow Process. Open File Report 00-92. Reston, VA: U.S. Geological Survey.
Hillesheim, M.B. 2007. Test Plan TP 06-0: Monitoring Water Levels in WIPP Wells, Rev. 1. ERMS 545770. Carlsbad, NM: Sandia National Laboratories.
Hillesheim, M.B., and R.L. Beauheim. 2007. “Hydrologic Monitoring and Data Assessment.” Sandia National Laboratories Technical Baseline Report (TBR) 2004–2005. ERMS 548259. Carlsbad, NM: Sandia National Laboratories.
Hillesheim, M.B., R.L. Beauheim, and R.G. Richardson. 2006. “Overview of the WIPP Groundwater Monitoring Programs with Inferences about Karst in the WIPP Vicinity.” Caves and Karst of Southeastern New Mexico (pp. 277–86). L. Land, V.W. Lueth, W. Raatz, P. Boston, and D.L. Love, eds. 57th Annual Fall Field Conference Guidebook. Socorro, NM: New Mexico Geological Society.
Hillesheim, M.B., L.A. Hillesheim, and N.J. Toll. 2007. “Mapping of Pressure-Head Responses of a Fractured Rock Aquifer to Rainfall Events.” Proceedings of the 2007 U.S. EPA/NGWA Fractured Rock Conference (pp. 522–36). Westerville, OH: National Ground Water Association.
Holt, R.M. 1997. Conceptual Model for Transport Processes in the Culebra Dolomite Member, Rustler Formation. SAND97-0194. Albuquerque: Sandia National Laboratories.
Holt, R.M., and D.W. Powers. 1988. Facies Variability and Post-Depositional Alteration within the Rustler Formation in the Vicinity of the Waste Isolation Pilot Plant, Southeastern New Mexico. DOE/WIPP 88-004. ERMS 242145. Carlsbad, NM: U.S. Department of Energy.
Holt, R.M., and L. Yarbrough. 2002. Analysis Report: Task 2 of AP-088; Estimating Base Transmissivity Fields (July 8). ERMS 523889. Carlsbad, NM: Sandia National Laboratories.
Holt, R.M., R.L. Beauheim, and D.W. Powers. 2005. “Predicting Fractured Zones in the Culebra Dolomite.” Dynamics of Fluids and Transport in Fractured Rock (pp. 103–16). B. Faybishenko, P.A. Witherspoon, and J. Gale, eds. Geophysical Monograph Series 162. Washington, DC: American Geophysical Union.
Huff, G.F., and A. Gregory. 2006. Aquifer-Test Data for Wells H-1, H-2A, H-2B, H-2C, and H-3 at the Waste Isolation Pilot Plant, Southeastern New Mexico. Open File Report 2006-1129. Reston, VA: U.S. Geological Survey.
Intera Technologies, Inc. 1986. WIPP Hydrology Program, Waste Isolation Pilot Plant, Southeastern New Mexico, Hydrologic Data Report #3. SAND86-7109. Albuquerque, NM: Sandia National Laboratories.
Johnson, P.B. 2008. Hydrologic Data Reports: Post-2003. ERMS 549162. Carlsbad, NM: Sandia National Laboratories.
Lambert, S.J., and K.L. Robinson. 1984. Field Geochemical Studies of Groundwaters in Nash Draw, Southeastern New Mexico. SAND83-1122. Albuquerque, NM: Sandia National Laboratories.
Lorenz, J.C. 2006a. Assessment of the Potential for Karst in the Rustler Formation at the WIPP Site. SAND2005-7303. Albuquerque: Sandia National Laboratories.
Lorenz, J.C. 2006b. “Assessment of the Geological Evidence for Karst in the Rustler Formation at the WIPP Site.” Caves and Karst of Southeastern New Mexico (pp. 243–52). L. Land, V.W. Lueth, W. Raatz, P. Boston, and D.L. Love, eds. 57th Annual Fall Field Conference Guidebook. Socorro, NM: New Mexico Geological Society.
Lowry, T.S., and R.L. Beauheim. 2004. Analysis Report: Task 2 of AP-110; Evaluation of Water-Level Rise in the Culebra Due to Recharge from Refining Process Water Discharged onto Potash Tailings Piles. ERMS 536239. Carlsbad, NM: Sandia National Laboratories.
Lowry, T.S., and R.L. Beauheim. 2005. Analysis Report: Task 3 of AP-110; Evaluation of Water-Level Rise in the Culebra Due to Leakage through Poorly Plugged and Abandoned Potash Boreholes. ERMS 540187. Carlsbad, NM: Sandia National Laboratories.
Marcinowski, F. 2002. Letter to I. Triay. 15 November 2002. U.S. Environmental Protection Agency, Office of Air and Radiation, Washington, DC.
McKenna, S.A. 2004. Analysis Report: Culebra Water Level Monitoring Network Design. AP-111. ERMS 540477. Carlsbad, NM: Sandia National Laboratories.
McKenna, S.A., and D.B. Hart. 2003. Analysis Report: Task 4 of AP-088; Conditioning of Base T Fields to Transient Heads. ERMS 531124. Carlsbad, NM: Sandia National Laboratories.
Mercer, J.W. 1983. Geohydrology of the Proposed Waste Isolation Pilot Plant Site, Los Medaños Area, Southeastern New Mexico. Water-Resources Investigations Report 83-4016. Albuquerque: U.S. Geological Survey.
Mercer, J.W., and B.R. Orr. 1979. Interim Data Report on the Geohydrology of the Proposed Waste Isolation Pilot Plant Site, Southeast New Mexico. Water-Resources Investigations 79–98. Albuquerque, NM: U.S. Geological Survey...\..\references\Others\Mercer_Orr_1979_Interim_Data_Report_on_the_Geohydrology.pdf
Mercer, J.W., and R.P. Snyder. 1990. Basic Data Report for Drillholes H-14 and H-15 (Waste Isolation Pilot Plant-WIPP). SAND89-0202. Albuquerque: Sandia National Laboratories...\..\references\Others\Mercer_Snyder_1990_Basic_Data_Report_for_Drillholes_H14_and_H15_SAND89_0202.pdf
Piper, A.M. 1944. “A Graphic Procedure in the Geochemical Interpretation of Water-Analyses.” Transactions, American Geophysical Union, vol. 25: 914–23.
Powers, D.W. 2002. Analysis Report: Task 1 of AP-088; Construction of Geologic Contour Maps(April 17). ERMS 522086. Carlsbad, NM: Sandia National Laboratories.
Powers, D.W. 2004a. Analysis Report: Task 1A of AP-110: Identify Potash Holes Not Sealed Through the Culebra with Cement, and Units to Which the Culebra Might Be Connected. ERMS 535377. Carlsbad, NM: Sandia National Laboratories.
Powers, D.W. 2004b. Analysis Report: Task 1B of AP-110: Identify Plugged and Abandoned Oil or Gas Wells Not Sealed Through the Culebra with Cement, and Units to Which the Culebra Might Be Connected. ERMS 538279. Carlsbad, NM: Sandia National Laboratories.
Powers, D.W. 2006a. Analysis Report: Task 1D of AP-114; Collect Current and Historic Information on Water Levels and Specific Gravity in Potash Tailings Ponds within the Culebra Modeling Domain (March 31). ERMS 543124. Carlsbad, NM: Sandia National Laboratories.
Powers, D.W. 2006b. Analysis Report: Task 1B of AP-114; Identify Possible Area of Recharge to the Culebra West and South of WIPP (April 1). ERMS 543094. Carlsbad, NM: Sandia National Laboratories.
Powers, D.W. 2007. Analysis Report for Task 1A of AP-114: Refinement of Rustler Halite Margins within the Culebra Modeling Domain (October 5). ERMS 547559. Carlsbad, NM: Sandia National Laboratories.
Powers, D.W. 2009a. Basic Data Report for Drillhole SNL-8 (C-3150) (Waste Isolation Pilot Plant). (February). DOE/WIPP 05-3324. Carlsbad, NM: U.S. Department of Energy.
Powers, D.W. 2009b. Basic Data Report for Drillhole SNL-10 (C-3221) (Waste Isolation Pilot Plant). (February). DOE/WIPP 07-3363. Carlsbad, NM: U.S. Department of Energy.
Powers, D.W. 2009c. Basic Data Report for Drillhole SNL-16 (C-3220) (Waste Isolation Pilot Plant). DOE/WIPP 07-3364. Carlsbad, NM: U.S. Department of Energy.
Powers, D.W. [In progress]a. Basic Data Report for Drillholes SNL-6 and -6A (C-3151) (Waste Isolation Pilot Plant). (Copy on file with author; to be published as DOE/WIPP 05-3323. Carlsbad, NM: U.S. Department of Energy.)
Powers, D.W. [In progress]b. Basic Data Report for Drillhole SNL-19 (C-3234) (Waste Isolation Pilot Plant). (Copy on file with author; to be published as DOE/WIPP 07-3367. Carlsbad, NM: U.S. Department of Energy.)
Powers, D.W. [In progress]c. Basic Data Report for Drillhole SNL-18 (C-3233) (Waste Isolation Pilot Plant). (Copy on file with author; to be published as DOE/WIPP 07-3366. Carlsbad, NM: U.S. Department of Energy.)
Powers, D.W. [In progress]d. Basic Data Report for Drillholes SNL-17 and -17A (C-3222) (Waste Isolation Pilot Plant). (Copy on file with author; to be published as DOE/WIPP 07-3365. Carlsbad, NM: U.S. Department of Energy.)
Powers, D.W., and R.M. Holt. 2000. “The Salt That Wasn’t There: Mudflat Facies Equivalents to Halite of the Permian Rustler Formation, Southeastern New Mexico.” Journal of Sedimentary Research, vol. 70: 29–36. ERMS 532369.
Powers, D.W., and D. Owsley. 2003. “Field Survey of Evaporite Karst along New Mexico Highway 128 Realignment Routes,” Evaporite Karst and Engineering/Environmental Problems in the United States (pp. 233–40). Circular 109. K.S. Johnson and J.T. Neal, eds. Norman, OK: Oklahoma Geological Survey.
Powers, D.W., and R.G. Richardson. 2003a. Basic Data Report for Drillhole SNL-2 (C-2948) (Waste Isolation Pilot Plant). DOE/WIPP 03-3290. Carlsbad, NM: U.S. Department of Energy.
Powers, D.W., and R.G. Richardson. 2003b. Basic Data Report for Drillhole SNL-9 (C-2950) (Waste Isolation Pilot Plant). DOE/WIPP 03-3291. Carlsbad, NM: U.S. Department of Energy.
Powers, D.W., and R.G. Richardson. 2004a. Basic Data Report for Drillhole SNL-12 (C-2954) (Waste Isolation Pilot Plant). DOE/WIPP 03-3295. Carlsbad, NM: U.S. Department of Energy.
Powers, D.W., and R.G. Richardson. 2004b. Basic Data Report for Drillhole SNL-3 (C-2949) (Waste Isolation Pilot Plant). DOE/WIPP 03-3294. Carlsbad, NM: U.S. Department of Energy.
Powers, D.W., and R.G. Richardson. 2004c. Basic Data Report for Drillhole SNL-1 (C-2953) (Waste Isolation Pilot Plant). DOE/WIPP 04-3301. Carlsbad, NM: U.S. Department of Energy.
Powers, D.W., and R.G. Richardson. 2004d. Basic Data Report for Drillhole SNL-5 (C-3002) (Waste Isolation Pilot Plant). DOE/WIPP 04-3305. Carlsbad, NM: U.S. Department of Energy.
Powers, D.W., and R.G. Richardson. 2008a. Basic Data Report for Drillhole SNL-13 (C-3139) (Waste Isolation Pilot Plant). DOE/WIPP 05-3319. Carlsbad, NM: U.S. Department of Energy.
Powers, D.W., and R.G. Richardson. 2008b. Basic Data Report for Drillhole SNL-14 (C-3140) (Waste Isolation Pilot Plant). DOE/WIPP 05-3320. Carlsbad, NM: U.S. Department of Energy.
Powers, D.W., and R.G. Richardson. 2008c. Basic Data Report for Drillhole SNL-15 (C-3152) (Waste Isolation Pilot Plant). DOE/WIPP 05-3325. Carlsbad, NM: U.S. Department of Energy.
Powers, D.W., R.M. Holt, R.L. Beauheim, and S.A. McKenna. 2003. “Geological Factors Related to the Transmissivity of the Culebra Dolomite Member, Permian Rustler Formation, Delaware Basin, Southeastern New Mexico.” Evaporite Karst and Engineering/Environmental Problems in the United States (pp. 211–18). Circular 109. Norman, OK: Oklahoma Geological Survey...\..\references\Others\Powers_Holt_Beauheim_McKenna_2003_Geological_Factors_Related_to_the_Transmissivity.pdf
Powers, D.W., R.M. Holt, R.L. Beauheim, and R.G. Richardson. 2006a. “Advances in Depositional Models of the Permian Rustler Formation, Southeastern New Mexico.” Caves and Karst of Southeastern New Mexico (pp. 267–76). L. Land, V.W. Lueth, W. Raatz, P. Boston, and D.L. Love, (eds.) 57th Annual Fall Field Conference Guidebook. Socorro, NM: New Mexico Geological Society...\..\references\Others\Powers_et_al_2006_Advances_in_Depositional_Models.pdf
Powers, D., R. Beauheim, R. Holt, and D. Hughes. 2006b. “Evaporite Karst Features and Processes at Nash Draw, Eddy County, New Mexico.” Caves and Karst of Southeastern New Mexico (pp. 253–66). L. Land, V.W. Lueth, W. Raatz, P. Boston, and D.L. Love, eds. 57th Annual Fall Field Conference Guidebook. Socorro, NM: New Mexico Geological Society...\..\references\Others\Powers_et_al_2006_Evaporite_karst.pdf
Roberts, R.M. 2006. Analysis Report for AP-070: Analysis of Culebra Pumping Tests Performed between December 2003 and August 2005. ERMS 543901. Carlsbad, NM: Sandia National Laboratories.
Roberts, R.M. 2007. Analysis Report for AP-070: Analysis of Culebra Hydraulic Tests Performed between June 2006 and September 2007. ERMS 547418. Carlsbad, NM: Sandia National Laboratories.
Rouhani, S. 1985. “Variance Reduction Analysis.” Water Resources Research, vol. 21: 837–846.
Salness, R.A. 2005a. Basic Data Report for Monitor Well Cabin Baby 1 (CB-1) Reconfiguration Activities. DOE/WIPP 04-3306. Carlsbad, NM: U.S. Department of Energy.
Salness, R.A. 2005b. Basic Data Report for Monitor Well DOE-2 Reconfiguration Activities. DOE/WIPP 04-3307. Carlsbad, NM: U.S. Department of Energy.
Salness, R.A. 2005c. Basic Data Report for Monitor Well AEC-7 (C-2742) Reconfiguration Activities. DOE/WIPP 04-3308. Carlsbad, NM: U.S. Department of Energy.
Salness, R.A. 2006. Basic Data Report for Well Plugging and Abandonment and Reconfiguration Activities for Fiscal Year 2005. DOE/WIPP 05-3326. Carlsbad, NM: U.S. Department of Energy.
Salness, R.A. 2007. Basic Data Report for Well Plugging and Abandonment Activities for Fiscal Year 2006. DOE/WIPP 07-3326. Carlsbad, NM: U.S. Department of Energy.
Sandia National Laboratories. 2003. Program Plan: WIPP Integrated Groundwater Hydrology Program, FY03-09 (Revision 0). ERMS 526671. Carlsbad, NM: Sandia National Laboratories.
Sandia National Laboratories and U.S. Geological Survey. 1982. Basic Data Report for Drillhole WIPP 11 (Waste Isolation Pilot Plant—WIPP). SAND79-0272. Albuquerque: Sandia National Laboratories.
Siegel, M.D., K.L. Robinson, and J. Myers. 1991. “Solute Relationships in Groundwaters from the Culebra Dolomite and Related Rocks in the Waste Isolation Pilot Plant Area, Southeastern New Mexico.” Hydrogeochemical Studies of the Rustler Formation and Related Rocks in the Waste Isolation Pilot Plant Area, Southeastern New Mexico(Chapter 2). M.D. Siegel, S.J. Lambert, and K.L. Robinson, eds. SAND88-0196. Albuquerque: Sandia National Laboratories.
U.S. Department of Energy (DOE). 2004a. Title 40 CFR Part 191 Compliance Recertification Application for the Waste Isolation Pilot Plant (March). 10 vols. DOE/WIPP 2004-3231. Carlsbad, NM: Carlsbad Field Office.
U.S. Department of Energy. 2004b. Waste Isolation Pilot Plant Environmental Monitoring Plan. DOE/WIPP 99-2194. Carlsbad, NM: U.S. Department of Energy.
U.S. Department of Energy (DOE). 2004c. Waste Isolation Pilot Plant 2003 Site Environmental Report. DOE/WIPP 04-2225. Carlsbad, NM: Carlsbad Field Office.
U.S. Department of Energy (DOE). 2005. Waste Isolation Pilot Plant 2004 Site Environmental Report. DOE/WIPP 05-2225. Carlsbad, NM: Carlsbad Field Office.
U.S. Department of Energy (DOE). 2006. Waste Isolation Pilot Plant Annual Site Environmental Report for 2005 (September). DOE/WIPP 06-2225. Carlsbad, NM: Carlsbad Field Office.
U.S. Department of Energy (DOE). 2007. Waste Isolation Pilot Plant Annual Site Environmental Report for 2006 (September). DOE/WIPP 07-2225. Carlsbad, NM: Carlsbad Field Office.
U.S. Department of Energy. 2008. Waste Isolation Pilot Plant Annual Site Environmental Report for 2007. DOE/WIPP 08-2225. Carlsbad, NM: U.S. Department of Energy.
U.S. Environmental Protection Agency (EPA). 1996. “40 CFR Part 194: Criteria for the Certification and Recertification of the Waste Isolation Pilot Plant’s Compliance with the 40 CFR Part 191 Disposal Regulations; Final Rule.” Federal Register, vol. 61 (February 9, 1996): 5223–45.
U.S. Environmental Protection Agency (EPA). 2006. “40 CFR Part 194: Criteria for the Certification and Recertification of the Waste Isolation Pilot Plant’s Compliance with the Disposal Regulations: Recertification Decision” (Final Notice). Federal Register, vol. 71 (April 10, 2006): 18010–021.
Vine, J.D. 1963. Surface Geology of the Nash Draw Quadrangle, Eddy County, New Mexico. Bulletin 1141-B. Washington, DC: U.S. Geological Survey. ERMS 239558.
Westinghouse TRU Solutions LLC. 2002. Waste Isolation Pilot Plant 2001 Site Environmental Report. DOE/WIPP 02-2225. Carlsbad, NM: U.S. Department of Energy.