This appendix presents supplementary information regarding the assumptions, simplifications, and approximations used in models that underlay the 2014 Compliance Recertification Application (CRA-2014) performance assessment (PA) of the Waste Isolation Pilot Plant (WIPP). The PA executed in support of the third WIPP recertification is denoted as the CRA-2014 PA. Within this appendix, relevant issues in the formulation or development of the various types of models (for example, conceptual, mathematical, numerical, or computer code) used for the topic under consideration in each section are discussed, and references to relevant historical information are included where appropriate. This appendix references the Compliance Certification Application (CCA) (U.S. DOE 1996), the 2004 Compliance Recertification Application (CRA-2004) (U.S. DOE 2004), and the 2009 Compliance Recertification Application (CRA-2009) (U.S. DOE 2009) when the information discussed has not changed from past demonstrations of compliance with the U.S. Environmental Protection Agency's (EPA's) disposal standards. Historical development of the WIPP conceptual models that led to the PA used in the CCA is documented in the CCA, Appendix MASS, Section MASS-2.0.
Historical development of the modeling assumptions for the CRA-2004 PA is documented in Appendix PA-2004, Attachment MASS. Finally, historical development of modeling assumptions used in the CRA-2009 PA is documented in Appendix MASS-2009.
The technical baseline for the first WIPP recertification included modifications required by the EPA during its review of the CRA-2004 PA (Cotsworth 2005). These modifications resulted in a PA called the Performance Assessment Baseline Calculation (PABC), which was denoted as the CRA-2004 PABC. The PA executed in support of the second recertification, the CRA-2009 PA, included a number of technical changes and corrections, as well as updates to parameters and improvements to the PA computer codes (Clayton et al. 2008). To incorporate additional information received after the CRA-2009 PA was completed but before the submittal of the CRA-2009, the EPA requested an additional PA be undertaken, referred to as the CRA-2009 PABC (Clayton et al. 2010), which included updated information (Cotsworth 2009).
Several changes are incorporated in the CRA-2014 PA relative to the CRA-2009. The modifications included in the CRA-2014 PA include repository planned changes, parameter updates, and refinements to PA implementation. Section MASS-2.0 contains a summary of changes in PA since the CRA-2009. Section MASS-3.0 includes a discussion of general modeling assumptions applicable to the disposal system as a whole, including a table of assumptions made in PA models, with cross-references. The remainder of this appendix discusses assumptions specific to the conceptual models used in the CRA-2014 PA.
Since the CCA, there have been changes to a number of the conceptual models and processes important in assessing the performance of the WIPP. Changes for the second recertification were primarily discussed in Appendix PA-2009 and Appendix MASS-2009. Other recertification-related, EPA-mandated changes were documented in the CRA-2009 PABC (Clayton et al. 2010). The CRA-2009 PABC is the current technical baseline used to demonstrate compliance with regulatory disposal standards. Since the CRA-2009 PABC, ongoing confirmatory experiments, monitoring results, and operational practices have generated information relevant to the features, events, and processes (FEPs), modeling assumptions, and conceptual models for PA, and provided additional support to the conceptual basis of PA. Appendix MASS-2014 includes the PA implications of these ongoing investigations and results, which are incorporated in the CRA-2014 PA. Changes in this PA include the following:
1. Reassessment of FEPs
2. Results of compliance monitoring
3. Results of experimental activities
4. Assessment of model and systems changes and updates
5. Incorporation of changes included in the CRA-2009 PABC, such as
Changes to matrix partition coefficient parameters
Updated Culebra transmissivity fields (T fields)
6. Incorporation of CRA-2014 changes, including
A. Replacement of the "Option D" WIPP panel closure system (PCS) with a newly designed Run-of-Mine Panel Closure System (ROMPCS)
B. Inclusion of additional mined volume in the repository north end
C. An update to the probability that a drilling intrusion into a repository excavated region will result in a pressurized brine encounter
D. Refinement to the inundated corrosion rate of steel in the absence of carbon dioxide (CO2)
E. Refinement to the effective shear strength of WIPP waste
F. Inventory updates
G. Updated drilling rate
H. Implementation of a more detailed repository water balance that includes magnesium oxide (MgO) hydration
I. Calculation of radionuclide concentration in brine as a function of the brine volume present in the waste panel
J. Updates to radionuclide solubilities and their associated uncertainties
K. Updated colloid enhancement parameters
7. Operational considerations
A summary of each change is presented in this section. References to appropriate sections of this appendix are provided for those changes that impact modeling assumptions. In addition, references are provided to other sections of the CRA-2014 where implementation of the changes is discussed.
In the WIPP PA methodology (see Appendix PA-2014, Section PA-2.3
), FEPs are elements used to develop the conceptual models and modeling assumptions represented in PA. The process used to develop and screen FEPs is outlined in Appendix SCR-2014, Section SCR-2.0.
For the CRA-2014, a reassessment of the CRA-2009 baseline FEPs was conducted to determine whether changes in WIPP activities and conditions affected the current FEP descriptions, bases, or screening decisions. This assessment also determined whether additional or new FEPs should be included in the CRA baseline. The reassessment results are documented in Appendix SCR-2014, Section SCR-3.0
and Section 32 (Scope of Performance Assessment) of this application. Changes to the baseline FEPs include updating screening arguments with new information that has become available since the CRA-2009. No changes to PA implementation or modeling assumptions were made as a result of the FEPs reassessment. No FEPs that were previously screened out of PA calculations have been screened in for the CRA-2014 PA, and no FEPs that were previously screened in have been screened out.
Monitoring activities have continued since the certification of the WIPP. These activities are used to validate assumptions and PA parameters, and to detect substantial and detrimental deviation from expected repository performance. Monitoring, as discussed here, applies to the assurance requirement of 40 CFR § 191.14(b) (U.S. EPA 1993) and the monitoring criteria at 40 CFR § 194.42 (U.S. EPA 1996). Appendix MON-2014 details the monitoring program that meets these requirements. The monitoring program was assessed to determine if the results indicate that changes should be made to the monitoring program. The results did not indicate that changes were required in the context of WIPP PA (Wagner 2011). The monitoring program did, however, lead to a change in one monitored parameter used in PA: because of increased drilling in the Delaware Basin, the drilling rate parameter value used in the CRA-2014 PA has increased to comply with the requirements of 40 CFR § 194.33 (U.S. EPA 1996), as described in Section 33 of this application. No changes to modeling assumptions are necessary to account for this parameter change.
The EPA requires the recertification documentation to include an update of "additional analyses and results of laboratory experiments conducted by the Department or its contractors as part of the WIPP program" (40 CFR § 194.15(a)(3); see also 40 CFR § 194.15, U.S. EPA 1996). The following sections discuss analyses and experiments conducted to support compliance determinations. Only analyses with conclusions relevant to this recertification are discussed here.
A series of steel and lead corrosion experiments has been conducted under Test Plan TP 06-02, Iron and Lead Corrosion in WIPP-Relevant Conditions (Wall and Enos 2006). The object of these experiments has been to determine steel and lead corrosion rates under WIPP-relevant conditions. A description of the experiments and the use of their results to determine a CRA-2014 PA update to the inundated corrosion rate of steel in the absence of CO2 are presented in Roselle (Roselle 2013a).
WIPP PA includes scenarios in which human intrusion results in a borehole intersecting the repository. During the intrusion, drilling mud flowing up the borehole will apply a hydrodynamic shear stress on the borehole wall. Erosion of the wall material can occur if this stress is high enough, resulting in a release of radionuclides being carried up the borehole with the drilling mud. Experiments have been conducted to determine the erosive impact on surrogate waste materials that were developed to represent WIPP waste that is 50%, 75%, and 100% degraded by weight. A description of the experimental apparatus, the experiments conducted in it, and conclusions to be drawn from those experiments are discussed in Herrick et al. (Herrick et al. 2012). The use of the experimental results to determine an updated waste shear strength parameter in the CRA-2014 PA is discussed in Herrick (Herrick 2013).
Experiments have been performed to support the implementation of MgO as an engineered barrier. These experiments have characterized MgO and investigated the hydration and carbonation of MgO to confirm its ability to sequester CO2, buffer brine pH (the measure of the acidity or alkalinity of a solution), and subsequently help establish low actinide solubilities in the repository. These activities are described in detail in Appendix MgO-2014. The CRA-2014 PA includes a more detailed repository water balance implementation that includes MgO hydration (Appendix PA-2014, Section PA-4.2.5
).
The U.S. Department of Energy (DOE) has continued to investigate actinide (An) speciation and solubilities since the certification of the WIPP. Since the CRA-2009, experiments to establish the microbial ecology, evaluate biodegradation of chelating agents, establish the solubility of thorium in WIPP brine, determine the effect of carbonate on uranium solubility, and assess the intrinsic, mineral, and microbial colloid enhancement parameters were completed. The current actinide experimental activities are described in Appendix SOTERM-2014, Section SOTERM-3.0.
The CRA-2014 PA uses the same actinide assumptions as the CRA-2009 PABC.
The DOE has maintained the computational platforms used to execute the WIPP PA modeling codes. A small number of modeling tasks that feed into compliance calculations are performed on desktop personal computer (PC) workstations running the Microsoft Windows 7® operating system (OS), as well as PC-based workstations and clusters running the Red Hat Linux® OS. The WIPP PA parameter database is hosted on a Sun Microsystems Solaris® server running MySQL®. The vast majority of the WIPP PA modeling codes used directly in compliance calculations are run on the WIPP PA Alpha Cluster composed of Hewlett-Packard (formerly Compaq) AlphaServer™ systems. AlphaServers™ are built around the Alpha processor and run the OpenVMS™ OS. The current hardware and software versions used in the CRA-2014 PA calculations are shown in Table MASS-1 and Table MASS-2.
Changes have been made to the systems used to perform WIPP PA in the CRA-2014. The PA parameter database has been updated since the CRA-2009 PABC. This change was necessary to reduce dependence on aging hardware and to increase PA capabilities. Several of the codes used in WIPP PA have been updated in order to add new capabilities. Codes PREBRAG Version 8.00 and BRAGFLO Version 6.02 have been developed to incorporate the updated repository water balance implementation in the CRA-2014 PA that includes MgO hydration. Codes PRECCDFGF Version 2.0 and CCDFGF Version 6.0 have been developed to utilize radionuclide solubilities calculated over a range of brine volumes.
All changes to systems used in WIPP PA are performed under the Carlsbad Field Office Quality Assurance (QA) Program implemented through the Quality Assurance Program Document (U.S. DOE 2010), and include testing, validation, and verification to ensure that there is no impact on PA implementation.
Outputs from previous certification PAs are again used in the CRA-2014 PA for those codes with unchanged input parameters. These outputs are identified in Long (Long 2013) and include the outputs of DRSPALL, MODFLOW, and SECOTP2D.
Table MASS-
1. CRA-2014 PA Codes
|
Code
|
Version
|
Executable
|
Build Date
|
|
ALGEBRACDB
|
2.35
|
ALGEBRACDB_PA96.EXE
|
31-01-96
|
|
BRAGFLO
|
6.0
|
BRAGFLO_QB0600.EXE
|
12-02-07
|
|
BRAGFLO
|
6.02
|
BRAGFLO_QB0602.EXE
|
11-29-12
|
|
CCDFGF
|
6.0
|
CCDFGF_QC0600.EXE
|
02-23-10
|
|
CUTTINGS_S
|
6.02
|
CUTTINGS_S_QA0602.EXE
|
09-06-05
|
|
EPAUNI
|
1.15A
|
EPAUNI_QA0115A.EXE
|
07-03-03
|
|
GENMESH
|
6.08
|
GM_PA96.EXE
|
31-01-96
|
|
ICSET
|
2.22
|
ICSET_PA96.EXE
|
01-02-96
|
|
LHS
|
2.42
|
LHS_QA0242.EXE
|
18-01-05
|
|
MATSET
|
9.20
|
MATSET_QA0920.EXE
|
04-01-12
|
|
NUTS
|
2.05C
|
NUTS_QA0205C.EXE
|
05-24-06
|
|
PANEL
|
4.03
|
PANEL_QA0403.EXE
|
04-25-05
|
|
PCCSRC
|
2.21
|
PCCSRC_PA96.EXE
|
05-23-96
|
|
POSTBRAG
|
4.00A
|
POSTBRAG_QA0400A.EXE
|
28-03-07
|
|
POSTLHS
|
4.07A
|
POSTLHS_QA0407A.EXE
|
25-04-05
|
|
PREBRAG
|
8.00
|
PREBRAG_QA0800.EXE
|
08-03-07
|
|
PREBRAG
|
8.02
|
PREBRAG_QA0802.EXE
|
11-29-12
|
|
PRECCDFGF
|
2.0
|
PRECCDFGF_QA0200.EXE
|
04-06-10
|
|
PRELHS
|
2.40
|
PRELHS_QA0240.EXE
|
04-01-12
|
|
RELATE
|
1.43
|
RELATE_PA96.EXE
|
06-03-96
|
|
STEPWISE
|
2.21
|
STEPWISE_PA96_2.EXE
|
02-12-96
|
|
SUMMARIZE
|
3.01
|
SUMMARIZE_QB0301.EXE
|
21-12-05
|
Table MASS-
2. CRA
-2014 PA Hardware
|
Node
|
Hardware Type
|
CPU
|
Operating System
|
|
CCR
|
HP AlphaServer™ ES45
|
Alpha EV68
|
Open VMS 8.2
|
|
TDN
|
HP AlphaServer™ ES45
|
Alpha EV68
|
Open VMS 8.2
|
|
BTO
|
HP AlphaServer™ ES45
|
Alpha EV68
|
Open VMS 8.2
|
|
CSN
|
HP AlphaServer™ ES45
|
Alpha EV68
|
Open VMS 8.2
|
|
GNR
|
HP AlphaServer™ ES47
|
Alpha EV7
|
Open VMS 8.2
|
|
MC5
|
HP AlphaServer™ ES47
|
Alpha EV7
|
Open VMS 8.2
|
|
TRS
|
HP AlphaServer™ ES47
|
Alpha EV7
|
Open VMS 8.2
|
|
TBB
|
HP AlphaServer™ ES47
|
Alpha EV7
|
Open VMS 8.2
|
As part of its review of the CRA-2009, the EPA requested changes to the CRA-2009 PA (Cotsworth 2009). These changes included updates to the repository waste inventory, actinide solubilities, Culebra transmissivity fields, drilling parameters, and matrix partition coefficients. These changes were incorporated into the CRA-2009 PABC (Clayton et al. 2010). Repository performance with these requested changes was subsequently assessed by the EPA, and the WIPP was recertified in 2010 (U.S. EPA 2010a). The 2010 EPA recertification decision established the CRA-2009 PABC as the certified WIPP technical baseline. Changes included in the CRA-2009 PABC are shown in Table MASS-3.
Table MASS-
3. Changes Incorporated in the CRA-2009 PABC
|
Changes Included in the 2009 Performance Assessment Baseline Calculation
|
|
EPA-Mandated Change
|
Description of Change
|
Reference
|
|
Inventory
|
Updated inventory parameters
|
CRA-2009 PABC Summary (Clayton et al. 2010, Section 2.1
)
CRA-2009 PABC Inventory Screening Analysis
(Fox, Clayton, and Kirchner 2009)
|
|
Solubility Parameters
|
Updated baseline solubility limits for inventory actinides
|
CRA-2009 PABC Summary (Clayton et al. 2010, Section 2.2
)
|
|
Solubility Uncertainty Ranges
|
Updated uncertainty ranges for actinide solubility limits
|
CRA-2009 PABC Summary (Clayton et al. 2010, Section 2.2
)
|
|
Culebra Transmissivity Fields
|
Updated to include additional Culebra transmissivity data sets
|
CRA-2009 PABC Summary (Clayton et al. 2010, Section 2.3
)
Appendix HYDRO-2014, Attachment TFIELD
|
|
Drilling Parameters
|
Updated to include additional Delaware Basin drilling data
|
CRA-2009 PABC Analysis Plan
(Clayton 2009a, Section 2.1.4
)
|
|
Matrix Partition Coefficients
|
Updated to account for higher organic ligand concentrations in the CRA-2009 PABC inventory
|
Justification of Updated Kd values
(Clayton 2009b)
|
A subset of the CRA-2009 PABC changes summarized in Table MASS-3 is also included in the CRA-2014 PA. The CRA-2014 PA uses the same Culebra transmissivity fields and matrix partition coefficients as were used in the CRA-2009 PABC. A number of additional changes are implemented in the CRA-2014 PA relative to the CRA-2009 PABC. These changes are discussed below and summarized in Table MASS-4.
The CRA-2014 PA uses the same conceptual models as were used in the CRA-2009 PABC. No changes were made to the conceptual models used in the CRA-2009 PABC.
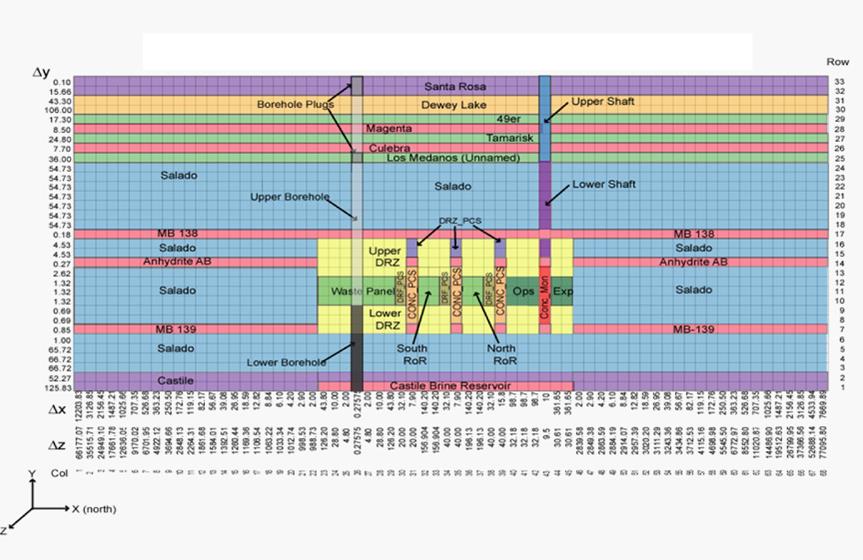
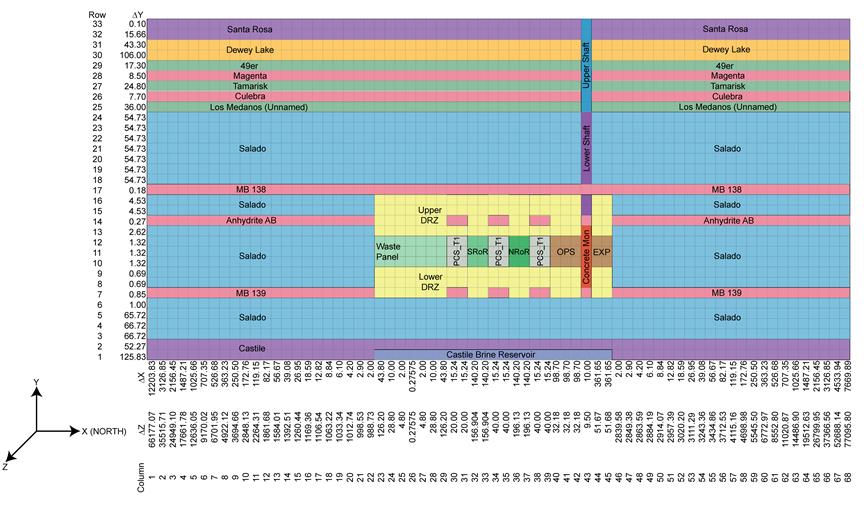
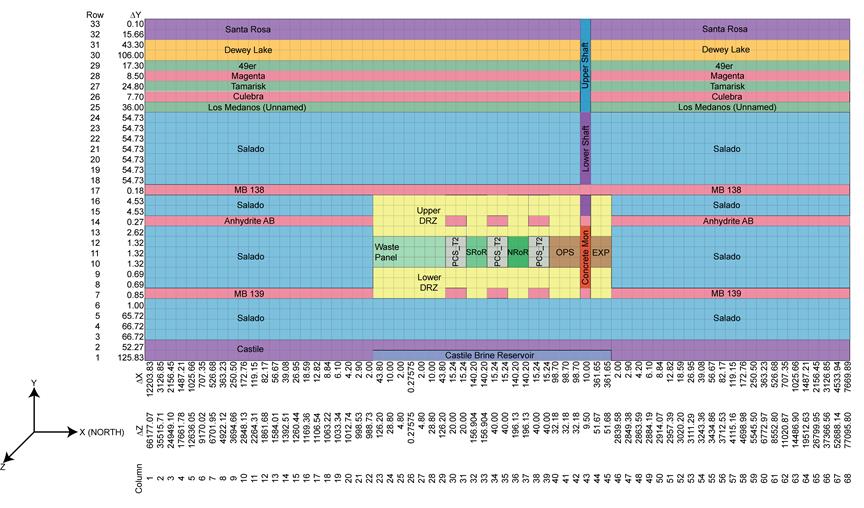
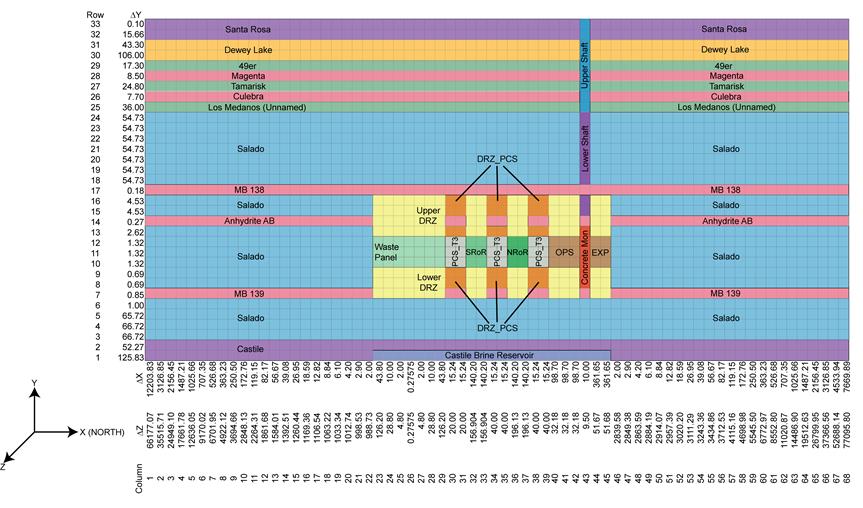
The WIPP waste panel closures comprise a feature of the repository that has been represented in WIPP PA regulatory compliance demonstration since the CCA (U.S. DOE 1996). The 1998 rulemaking that certified the WIPP to receive transuranic (TRU) waste required the DOE to implement the Option D PCS at the WIPP. The DOE has submitted a planned change request to the EPA requesting that the EPA modify Condition 1 of the Final Certification Rulemaking for 40 CFR Part 194 (U.S. EPA 1998a) for the WIPP, and that a revised panel closure design be approved for use in all panels (U.S. DOE 2011a). The revised panel closure design, denoted as the ROMPCS, is comprised of 100 feet (ft) of run-of-mine (ROM) salt with barriers at each end. A PA was executed to quantify WIPP repository performance impacts associated with the replacement of the approved Option D PCS design with the ROMPCS (Camphouse et al. 2012). It was found that long-term WIPP performance with the ROMPCS design is similar to that seen with Option D. The ROMPCS design is implemented in the CRA-2014 PA.
Following the recertification of the WIPP in November of 2010, the DOE submitted a planned change notice to the EPA that justified additional excavation to the WIPP experimental area (U.S. DOE 2011b). A performance assessment was undertaken to determine the impact of the additional excavation on the long-term performance of the facility (Camphouse et al. 2011). After reviewing the DOE proposal and written responses to questions related to the effects of increasing the mining area, the EPA found that the mining activities will not adversely impact WIPP waste handling activities, air monitoring, disposal operations, or long-term repository performance (U.S. EPA 2011). Additional excavation in the WIPP experimental area is included in the CRA-2014 PA.
Penetration into a region of pressurized brine during a hypothetical WIPP drilling intrusion can have significant consequences with respect to releases. The WIPP PA parameter GLOBAL:PBRINE (hereafter called PBRINE) is used to specify the probability that a drilling intrusion into the excavated region of the repository encounters a region of pressurized brine below the repository. A framework that provides a quantitative argument for refinement of parameter PBRINE has been developed since the CRA-2009 PABC (Kirchner, Zeitler, and Kirkes 2012). The distribution for PBRINE that results from this framework is used in the CRA-2014 PA.
The interaction of steel in the WIPP with repository brines results in the formation of hydrogen (H2) gas due to anoxic corrosion of the metal. The rate of H2 gas generation depends on the corrosion rate and the type of corrosion products formed. Experiments have been undertaken with the aim of determining steel and lead corrosion rates under WIPP-relevant conditions (see MASS-2.3.1). A description of the new experiments and the use of their results to determine an updated anoxic corrosion rate for brine-inundated steel in the absence of CO2 are presented in Roselle (Roselle 2013a). This updated rate is used in the CRA-2014 PA.
WIPP PA includes scenarios in which a hypothetical human intrusion results in a borehole intersecting the repository. New experiments have been conducted to determine the erosive impact on surrogate waste materials that were developed to represent WIPP waste that is 50%, 75%, and 100% degraded by weight (see MASS-2.3.2). A description of the experimental configuration and conclusions made from the experimental results are given in Herrick et al. (Herrick et al. 2012). Based on the experimental results and analysis of existing data, Herrick (Herrick 2013) recommends a refinement to the waste shear strength parameter used in WIPP PA. The recommended refinement to this parameter is used in the CRA-2014 PA.
The waste information used in the CRA-2014 PA is updated from that used in the CRA-2009 PABC calculations. The Performance Assessment Inventory Report (PAIR) - 2012 (Van Soest 2012) was released on November 29, 2012. The PAIR - 2012 contains updated estimates to the radionuclide content and waste material parameters, scaled to a full repository, based on inventory information collected through December 31, 2011. The WIPP PA inventory parameters are updated in the CRA-2014 PA to account for this new information. Waste information in the CRA-2014 PA is discussed further in Kicker and Zeitler (Kicker and Zeitler 2013).
The WIPP regulations require that current drilling practices be assumed when modeling hypothetical future drilling intrusions in WIPP PA. The DOE continues to survey drilling activity in the Delaware Basin in accordance with the criteria established in 40 CFR 194.33. Results for the year 2012 are documented in the 2012 Delaware Basin Monitoring Annual Report (U.S. DOE 2012). Drilling parameters are updated in the CRA-2014 PA to include information assembled through 2012 (see MASS-2.2).
The saturation and pressure history of the repository are used throughout PA. Along with flow in and out of the repository, the saturation and pressure are influenced by the reaction of materials placed in the repository with the surrounding environment. As part of the review of the CRA-2009, the EPA noted several issues for possible additional investigation, including the potential implementation of a more detailed repository water balance (U.S. EPA 2010b). The repository water balance implementation is refined in the CRA-2014 PA in order to include the major gas and brine producing and consuming reactions in the existing conceptual model and is discussed in Appendix PA-2014, Section PA-4.2.5.
To date, the minimum brine volume necessary for a direct brine release (DBR) has been used as an input to the radionuclide solubility calculation. The entire organic ligand inventory was assumed to be dissolved in the minimum necessary DBR brine volume, and the resulting organic ligand concentrations were then used in the calculation of baseline radionuclide solubilities. The trend toward increasing organic ligand content in the WIPP waste inventory has resulted in mass-balance issues when determining radionuclide solubilities from only the minimum brine volume necessary for a DBR. As a result, the calculation of baseline radionuclide solubilities is extended in the CRA-2014 so that they are dependent on the concentration of organic ligands which vary with the actual volume of brine present in the repository. Brine volumes of 1x, 2x, 3x, 4x, and 5x the minimum necessary DBR volume are used in the calculation of baseline radionuclide solubilities in the CRA-2014. The organic ligand waste inventory is assumed to be dissolved in each of these multiples of the minimum necessary brine volume. The resulting organic ligand concentrations, now dependent on a range of brine volumes, are then used to calculate baseline radionuclide solubilities corresponding to each brine volume. This approach keeps radionuclide mass constant over realized brine volumes, rather than keeping radionuclide concentration constant over realized brine volumes. Further discussion of this approach is given in Camphouse (Camphouse 2013).
The solubilities of actinide elements are influenced by the chemical components of the waste. With the release of the PAIR - 2012 (Van Soest 2012), updated information on the amount of various chemical components in the waste is available. To incorporate this updated information, parameters used to represent actinide solubilities are updated in the CRA-2014 PA. Solubilities are calculated in the CRA-2014 PA using multiples of the minimum brine volume necessary for a DBR to occur. Additional experimental results have been published in the literature since the CRA-2009 PABC, and this new information is used in the CRA-2014 PA to enhance the uncertainty ranges and probability distributions for actinide solubilities. More discussion of radionuclide solubilities and their associated uncertainties is given in Brush and Domski (Brush and Domski 2013a and Brush and Domski 2013b) and Appendix SOTERM 2014, Section SOTERM-5.0.
Colloid parameters are updated in the CRA-2014 PA to incorporate recently available data given in Reed et al. (Reed et al. 2013). Actinide colloid enhancement parameters were re-assessed and updated, as appropriate, to reflect recent literature and more extensive WIPP-specific data. The CRA-2014 PA contains no changes to the WIPP colloid model developed for the CCA.
The CRA-2014 PA is updated based on new information since the CRA-2009 PABC. Information on the implementation of these changes is contained in Camphouse (Camphouse 2013), Section 2.1, and is summarized in Table MASS-4.
Table MASS-
4. Changes Incorporated in the CRA-2014
|
WIPP Project Change
|
Summary of Change and Cross-Reference
|
|
Panel Closure Design
|
The Option D PCS design is replaced with the ROMPCS design (Camphouse et al. 2012; Camphouse 2013).
|
|
Added Volume in the Repository Experimental Region
|
A volume of 60,335 cubic meters (m3) is added to the volume of the WIPP experimental region (Camphouse et al. 2011).
|
|
Probability of Encountering Pressurized Brine during a Drilling Intrusion
|
A revised distribution is used for WIPP PA parameter GLOBAL:PBRINE (Kirchner, Zeitler, and Kirkes 2012).
|
|
Refinement to Steel Corrosion Rate
|
A revised distribution is used for WIPP PA parameter STEEL:CORRMCO2 (Roselle 2013a).
|
|
Updated Waste Shear Strength
|
A revised distribution is used for WIPP PA parameter BOREHOLE:TAUFAIL (Herrick 2013).
|
|
Updated Waste Inventory Information
|
Inventory parameters in the CRA-2014 PA are updated to reflect information collected through December 31, 2011 (Van Soest 2012; Kicker and Zeitler 2013).
|
|
Drilling Rate
|
The drilling rate increased from 59.8 to 67.3 boreholes per square kilometer (km2) over 10,000 years (Camphouse 2013).
|
|
Refined Water Balance Implementation
|
The repository water balance implementation is refined to include the major gas and brine producing and consuming reactions in the existing conceptual model (Camphouse 2013; Clayton 2013).
|
|
Variable Brine Volume
|
Radionuclide concentrations in brine are dependent on the volume of brine in the repository, rather than only the minimum brine volume of 17,400 m3 necessary for a DBR (see MASS-2.6.10).
|
|
Radionuclide Solubilities and their Uncertainty
|
Radionuclide baseline solubilities are updated to reflect the organic ligand content in the CRA-2014 PA waste inventory, and are calculated using brine volumes that are multiples of 17,400 m3. Solubility uncertainties are updated based on recently available results in published literature (Brush and Domski 2013a and Brush and Domski 2013b) and WIPP-specific data is included (SOTERM-2014, Sections SOTERM-3.0 and SOTERM-5.0).
|
|
Updated Colloid Parameters
|
Colloid parameters in the CRA-2014 are updated to reflect data presented in Reed et al. (Reed et al. 2013).
|
No operational changes that would impact modeling assumptions have been made at the WIPP since the second recertification decision. Operational changes for the emplacement of MgO in 3,000-pound (lb) or 4,200-lb supersacks on every other stack of waste were made since the CRA-2009. However, this change does not impact PA as enough MgO is always present to meet the required excess factor of 1.2. As a result, no changes were made to modeling assumptions for the CRA-2014 PA because of operational considerations.
A number of assumptions are applied generally to the disposal system through the conceptual and mathematical models implemented in the CRA-2014 PA.
Table MASS-5, which lists modeling assumptions used in the PA, is a guide to general modeling assumptions. Because many of the assumptions in that table have not changed since the CRA-2004, material submitted with the first recertification application is listed for reference. References to documents included in the CRA-2014 are also included where appropriate. Table MASS-5 provides guidance for integrating the assumptions with (1) the chapters, sections, or appendices in which they are discussed, and (2) the codes that implement them.
The FEPs discussed in Appendix SCR-2014 that are relevant to these assumptions are also indicated. The final column in the table indicates whether the DOE considers each assumption to be reasonable or conservative. The DOE has not attempted to bias the overall results of PA toward a conservative outcome. However, the DOE has chosen to use conservative assumptions where data or models are impractical to obtain, or where effects on performance are not expected to be significant enough to justify development of a more complicated model. In all other cases, best unbiased conceptual models and parameter values have been selected. The designator R (reasonable) in the final column indicates that the DOE considers the assumption to be reasonable based on WIPP-specific data or information, data or information considered analogous to the WIPP disposal system, expert judgment, or other reasoning. The designator C (conservative) indicates that the DOE considers the assumption may overestimate a process or effect that may contribute to releases to the accessible environment. The regulatory designator (Reg) indicates that the assumption is based on regulations in 40 CFR Part 191, criteria in 40 CFR Part 194, or other regulatory guidance.
Table MASS-
5. General Modeling Assumptions
|
Chapter or Section
|
Assumption Number
|
Code
|
Modeling Assumption
|
Related FEP in
Appendix SCR-2014
|
Assumption Considereda
|
|
CRA-2014: MASS-3.0
General Assumptions in PA Models
CRA-2014: MASS-3.1
Darcy's Law Applied for Fluid Flow calculated by BRAGFLO, MODFLOW-2000, and DRSPALL
|
1
|
BRAGFLO
MODFLOW-2000
|
Flow is governed by mass conservation and Darcy's Law in porous media. Flow is laminar and fluids are Newtonian.
|
Saturated Groundwater Flow (N23)
Unsaturated Groundwater Flow (N24)
Brine Inflow (W40)
|
R
|
|
2
|
BRAGFLO
|
Two-phase flow in the porous media is by simultaneous immiscible displacement.
|
Fluid Flow Due to Gas Production
(W42)
|
R
|
|
3
|
BRAGFLO
|
The Brooks-Corey or Van Genuchten/Parker equations represent interactions between brine and gas.
|
Fluid Flow Due to Gas Production (W42)
|
R
|
|
4
|
BRAGFLO
|
The Klinkenberg effect is included for flow of gases at low pressures.
|
Fluid Flow Due to Gas Production (W42)
|
R
|
|
5
|
BRAGFLO
|
Threshold displacement pressure for flow of gas into brine is constant.
|
Fluid Flow Due to Gas Production (W42)
|
R
|
|
6
|
BRAGFLO
MODFLOW-2000
SECOTP2D
|
Fluid composition and compressibility are constant.
|
Saturated Groundwater Flow (N23)
Fluid Flow Due to Gas Production (W42)
|
R
|
|
CRA-2014: MASS-3.2 Hydrogen Gas as Surrogate for Waste-Generated Gas Physical Properties in BRAGFLO and DRSPALL
|
7
|
BRAGFLO
DRSPALL
|
The gas phase is assigned the density and viscosity properties of hydrogen.
|
Fluid Flow Due to Gas Production (W42)
|
R
|
|
CRA-2014: MASS-3.3
Salado Brine as Surrogate for Liquid Phase Physical Properties in BRAGFLO
|
8
|
BRAGFLO
|
All liquid physical properties are assigned the properties of Salado brine.
|
Saturated Groundwater Flow (N23)
|
R
|
|
a R = Reasonable
C = Conservative
Reg. - Based on regulatory guidance
See above - Refers to assumptions 1 through 8 listed at the beginning of this table.
|
|
|
Table MASS-5. General Modeling Assumptions (Continued)
|
|
|
|
Chapter or Section
|
Code
|
Modeling Assumption
|
Related FEP in
Appendix SCR-2014
|
Assumption Considereda
|
|
|
CRA-2004: 6.4.2
Model Geometries
CRA-2004: 6.4.2.1
Disposal System Geometry
CRA-2014: MASS-4.0
Model Geometries
CRA-2014: MASS-4.1
Disposal System Geometry as Modeled in BRAGFLO
|
BRAGFLO
|
The disposal system is represented by a two-dimensional, north-south, vertical cross section.
|
Stratigraphy (N1)
Physiography (N39)
|
R
|
|
|
BRAGFLO
|
Flow in the disposal system is radially convergent or divergent centered on the repository, shaft, and borehole for disturbed performance.
|
Saturated Groundwater Flow (N23)
Unsaturated Groundwater Flow (N24)
|
R
|
|
|
BRAGFLO
|
Variable dip in the Salado is approximated by a 1 degree dip to the south.
|
Stratigraphy (N1)
|
R
|
|
|
BRAGFLO
|
Stratigraphic layers are parallel.
|
Stratigraphy (N1)
|
R
|
|
|
BRAGFLO
|
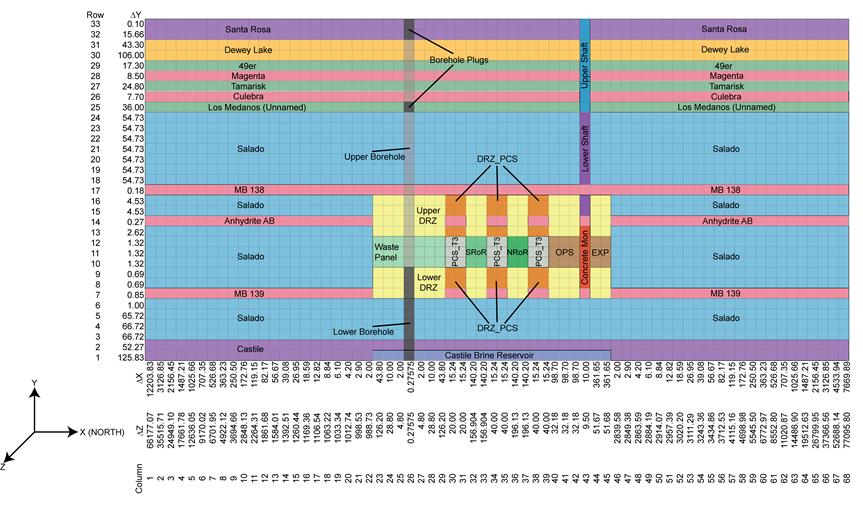
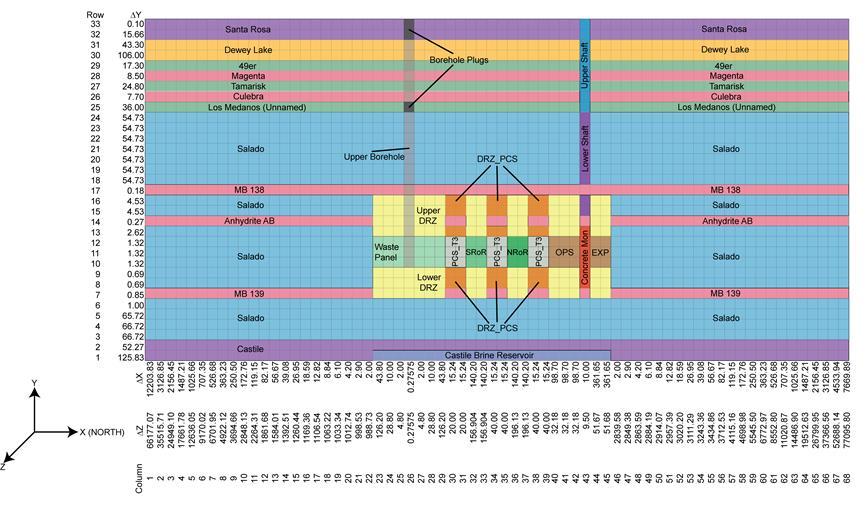
The stratigraphy consists of units above the Dewey Lake, the Forty-niner, the Magenta, the Tamarisk, the Culebra, the Los Medaños, and the Salado Formations (comprising impure halite, MB 138, anhydrites A and B [lumped together], and MB 139). The dimensions of these units are constant. A Castile brine reservoir is included in the BRAGFLO grid in all scenarios.
|
Stratigraphy (N1)
|
R
|
|
|
CRA-2004: 6.4.2.2
Culebra Geometry
|
MODFLOW- 2000
SECOTP2D
|
The Culebra is represented by a two-dimensional, horizontal geometry for groundwater flow and radionuclide transport simulation.
|
Stratigraphy (N1)
|
R
|
|
|
MODFLOW 2000
PEST
|
Transmissivity varies spatially. There is no vertical flow to or from the Culebra.
|
Groundwater Recharge (N54)
Groundwater Discharge (N53)
|
R
|
|
|
SECOTP2D
|
The regional flow field provides boundary conditions for local transport calculations (see CRA-2004, Chapter 6.0,
Section 6.4.10.2).
|
Advection (W90)
|
R
|
|
a R = Reasonable
C = Conservative
Reg. - Based on regulatory guidance
See above - Refers to assumptions 1 through 8 listed at the beginning of this table.
|
|
|
|
|
|
|
|
|
|
Table MASS-5. General Modeling Assumptions (Continued)
|
|
|
Chapter or Section
|
Code
|
Modeling Assumption
|
Related FEP in
Appendix SCR-2014
|
Assumption Considereda
|
|
|
|
CRA-2004: 6.4.3
The Repository
CRA-2014: MASS-4.1
BRAGFLO Geometry of the Repository
|
BRAGFLO
|
The repository comprises five regions separated by panel closures: the waste panel, a north rest of repository (NRoR), a south RoR (SRoR) and the access drifts (separated by panel closures), the operations region, and the experimental region. A single shaft region is also modeled, and a borehole region is included for a borehole that intersects the separate waste panel. The dimensions of these regions are constant.
|
Disposal Geometry (W1)
|
R-C
|
|
|
|
BRAGFLO
|
Long-term flow up plugged and abandoned boreholes modeled as if all intrusions occur into a downdip (southern) panel.
|
Disposal Geometry
(W1)
|
C
|
|
|
|
BRAGFLO
|
For each repository region, the model geometry preserves design volume.
|
Disposal Geometry (W1)
|
R
|
|
|
|
BRAGFLO
|
Pillars, individual drifts, and rooms are not modeled for long-term performance, and containers provide no barrier to fluid flow.
|
Disposal Geometry (W1)
|
C
|
|
|
|
BRAGFLO
|
Long-term flow is radial to and from the borehole that intersects the waste disposal panel during disturbed performance.
|
Waste-Induced Borehole Flow (H32)
|
R
|
|
|
|
BRAGFLO
|
Disturbed rock zone (DRZ) provides a pathway to MBs.
|
-
|
R
|
|
|
|
BRAGFLO
|
Grid and material properties are consistent with the ROMPCS panel closure design.
|
-
|
R
|
|
|
a R = Reasonable
C = Conservative
Reg. - Based on regulatory guidance
See above - Refers to assumptions 1 through 8 listed at the beginning of this table.
|
|
|
|
|
|
|
|
|
|
|
|
Table MASS-5. General Modeling Assumptions (Continued)
|
|
|
|
Chapter or Section
|
Code
|
Modeling Assumption
|
Related FEP in
Appendix SCR-2014
|
Assumption Considereda
|
|
|
CRA-2004: 6.4.3.1
Creep Closure
CRA-2014: MASS-5.0
Creep Closure
CRA-2014: PORSURF
|
SANTOS
|
Creep closure is modeled using a two-dimensional model of a single room. Room interactions are insignificant.
|
Salt Creep (W20)
Changes in the Stress Field (W21)
Excavation-Induced Changes in Stress (W19)
|
R
|
|
|
SANTOS
|
The amount of creep closure is a function of time, gas pressure, and waste-matrix strength.
|
Salt Creep (W20)
Changes in the Stress Field (W21)
Consolidation of Waste (W32)
Pressurization (W26)
|
R
|
|
|
BRAGFLO
|
Porosity of operations and experimental areas is fixed at a value representative of consolidated material.
|
Salt Creep (W20)
|
R
|
|
|
CRA-2004: 6.4.3.2
Repository Fluid Flow
CRA-2014: MASS-6.0
Repository Fluid Flow
|
BRAGFLO
|
General assumptions 1 to 8.
|
-
|
See above
|
|
|
BRAGFLO
|
The waste disposal region is assigned a constant permeability representative of average consolidated waste without backfill.
|
Saturated Groundwater Flow (N23)
Unsaturated Groundwater Flow (N24)
|
R
|
|
|
CRA-2014: MASS-6.1
Flow Interactions with the Creep Closure Model
|
BRAGFLO
|
The experimental and operations regions are assigned a constant permeability representative of unconsolidated material and a constant porosity representative of consolidated material.
|
Saturated Groundwater Flow (N23)
Unsaturated Groundwater Flow (N24)
Salt Creep (N20)
|
C
|
|
|
CRA-2014: MASS-6.2
Flow Interactions with the Gas Generation Model
|
BRAGFLO
|
For gas generation calculations, the effects of wicking are accounted for by assuming that brine in the repository contacts waste to an extent greater than that calculated by the Darcy Flow model used.
|
Wicking (W41)
|
R
|
|
a R = Reasonable
C = Conservative
Reg. - Based on regulatory guidance
See above - Refers to assumptions 1 through 8 listed at the beginning of this table.
|
|
|
|
|
|
|
|
|
|
|
Table MASS-5. General Modeling Assumptions (Continued)
|
|
Chapter or Section
|
Code
|
Modeling Assumption
|
Related FEP in
Appendix SCR-2014
|
Assumption Considereda
|
|
CRA-2004: 6.4.3.3
Gas Generation
Appendix TRU WASTE-2004
CRA-2014: MASS-7.0
Gas Generation
|
BRAGFLO
|
Gas generation occurs by anoxic corrosion of steel containers and Fe and Fe-base alloys in the waste, giving H2, and by microbial consumption of cellulosics and, possibly, plastics and rubbers, giving mainly CO2 and hydrogen sulfide (H2S). Radiolysis, oxic reactions, and other gas generation mechanisms are insignificant. Gas generation is calculated using the average-stoichiometry model, and is dependent on brine availability.
|
Container Material Inventory (W5)
Waste Inventory (W2)
Degradation
of Organic Material (W44)
Gases from Metal Corrosion (W49)
|
R
|
|
BRAGFLO
|
The anoxic corrosion rate is dependent on liquid saturation. Anoxic corrosion of steel continues until all the steel is consumed. Steel corrosion will not be passivated by microbially generated gases (CO2 or H2S). The water in brine is consumed by the corrosion reaction.
|
Brine Inflow (W40)
Gases from Metal Corrosion (W49)
Degradation of Organic Material (W44)
|
R
|
|
BRAGFLO
|
Laboratory-scale experimental measurements of gas generation rates at expected room temperatures are used to account for the effects of biofilms and chemical reactions.
|
Effects of Biofilms on Microbial Gas Generation (W48)
Effects of Temperature on Microbial Gas Generation (W45)
Chemical Effects of Corrosion (W51)
|
R
|
|
a R = Reasonable
C = Conservative
Reg. - Based on regulatory guidance
See above - Refers to assumptions 1 through 8 listed at the beginning of this table.
|
|
|
Table MASS-5. General Modeling Assumptions (Continued)
|
|
|
|
Chapter or Section
|
Code
|
Modeling Assumption
|
Related FEP in
Appendix SCR-2014
|
Assumption Considereda
|
|
|
|
|
BRAGFLO
|
The rate of microbial gas production is dependent on the amount of liquid present. Significant microbial activity occurs in all the simulations. In 75% of the simulations, microbes may consume all of the cellulosics but none of the plastics and rubbers. In the remaining 25% of the simulations, microbes may consume all of the cellulosics and all of the plastics and rubbers. Microbial production will continue until all biodegradable cellulosic, plastic, and rubber (CPR) materials are consumed if brine is present. The MgO backfill will react with all of the CO2 and remove it from the gaseous phase.
|
Brine Inflow (W40)
Degradation of Organic Material (W44)
Waste Inventory (W2)
|
R
|
|
|
|
BRAGFLO
|
Gas dissolution in brine is of negligible consequence.
|
Fluid Flow Due to Gas Production (W42)
|
R
|
|
|
|
BRAGFLO
|
The gaseous phase is assigned the properties of hydrogen (General Assumption 7).
|
Fluid Flow Due to Gas Production (W42)
|
See above
|
|
|
|
CRA-2004: 6.4.3.4
Chemical Conditions in the Repository
CRA-2014: SOTERM-2.0
Conceptual Framework of Chemical Conditions
|
NUTS
PANEL
|
Chemical conditions in the repository will be constant. Chemical equilibrium is assumed for all reactions that occur between brine in the repository, waste, and abundant minerals, with the exceptions of gas generation and actinide redox reactions.
|
Speciation (W56)
Reduction-Oxidation Kinetics (W66)
|
R
|
|
|
|
NUTS
PANEL
|
Brine and waste in the repository will contain a uniform mixture of dissolved and colloidal species. All actinides have instant access to all repository brine.
|
Heterogeneity of Waste Forms (W3)
Speciation (W56)
|
C
|
|
|
a R = Reasonable
C = Conservative
Reg. - Based on regulatory guidance
See above - Refers to assumptions 1 through 8 listed at the beginning of this table.
|
|
|
|
|
|
|
|
|
|
Table MASS-5. General Modeling Assumptions (Continued)
|
|
|
|
Chapter or Section
|
Code
|
Modeling Assumption
|
Related FEP in
Appendix SCR-2014
|
Assumption Considereda
|
|
|
|
NUTS
PANEL
|
No microenvironments that influence the overall chemical environment will persist.
|
Speciation (W56)
|
R
|
|
|
NUTS
PANEL
|
For the undisturbed performance and E2 scenarios, brine in the waste panels has the composition of Salado brine. For E1 and E1E2 (Appendix PA-2014, Section PA-2.3.2.2
) scenarios, all brine in the waste panel intersected by the borehole has the composition of Castile brine.
|
Speciation (W56)
|
R
|
|
|
NUTS
PANEL
|
Chemical conditions in the waste panels will be reducing. However, a condition of redox disequilibrium will exist between the possible oxidation states of the An elements.
|
Reduction-Oxidation Kinetics (W66)
Speciation (W56)
Effects of Metal Corrosion (W64)
|
R
|
|
|
NUTS
PANEL
|
The pH and CO2 fugacity in the waste panels will be controlled by the equilibrium between Mg(OH)2 and Mg5(CO3)4(OH)2
×4H2O. (A result of this assumption is low CO2 fugacity and mildly basic conditions.)
|
Speciation (W56)
Backfill Chemical Composition (W10)
|
R
|
|
|
CRA-2004: 6.4.3.5
Dissolved Actinide Source Term
CRA-2014: SOTERM-3.3
The Fracture Matrix Transport Computer Code
|
NUTS
PANEL
|
Radionuclide dissolution to solubility limits is instantaneous.
|
Dissolution of Waste (W58)
|
C
|
|
|
NUTS
PANEL
|
Six actinides (thorium (Th), uranium (U), neptunium (Np), plutonium (Pu), americium (Am), and curium (Cm)) are used in PANEL for calculations of radionuclide transport of brine (up a borehole). Four actinides (Th, U, Pu, and Am) are explicitly considered in NUTS for calculations of radionuclide transport in brine (porous materials) (Kicker and Zeitler 2013).
|
Waste Inventory
(W2)
|
R
|
|
a R = Reasonable
C = Conservative
Reg. - Based on regulatory guidance
See above - Refers to assumptions 1 through 8 listed at the beginning of this table.
|
|
|
|
|
|
|
|
|
|
|
|
Table MASS-5. General Modeling Assumptions (Continued)
|
|
|
Chapter or Section
|
Code
|
Modeling Assumption
|
Related FEP in
Appendix SCR-2014
|
Assumption Considereda
|
|
|
|
|
NUTS
PANEL
|
The reducing conditions in the repository will eliminate significant concentrations of Np(VI), Pu(V), Pu(VI), and Am(V) species. Am and Cm will exist predominantly in the III oxidation state; while Th will exist in the IV oxidation state. It is assumed that the solubilities and Kd values of U, Np, and Pu will be dominated by one of the remaining oxidation states: U(IV) or U(VI), Np(IV) or Np(V), and Pu(III) or Pu(IV) (See Appendix SOTERM-2014, Table SOTERM-15
).
|
Speciation (W56)
Reduction-Oxidation Kinetics (W66)
|
R
|
|
|
|
NUTS
PANEL
|
For a given oxidation state, the different actinides have similar solubilities.
|
Speciation (W56)
|
R
|
|
|
|
NUTS
PANEL
|
For undisturbed performance and for all aspects of disturbed performance, except for cuttings and cavings releases, radionuclides in the waste are distributed evenly throughout the disposal panel.
|
Waste Inventory (W2)
Heterogeneity of Waste Forms (W3)
|
R
|
|
|
|
NUTS
PANEL
|
Mobilization of actinides in the gas phase is negligible.
|
Dissolution of Waste (W58)
|
R
|
|
|
|
NUTS
PANEL
|
An concentrations in the repository will be inventory limited when the mass of an An becomes depleted such that the predicted concentrations cannot be achieved.
|
Dissolution of Waste (W58)
|
R
|
|
|
|
CRA-2004: 6.4.3.6
Source Term for Colloidal Actinides
|
NUTS
PANEL
|
Four types of colloids constitute the source term for colloidal actinides: intrinsic, mineral fragment, microbial, and humic.
|
Colloid Formation and Stability (W79)
Humic and Fulvic Acids (W70)
|
R
|
|
|
|
NUTS
PANEL
|
Intrinsic colloids for all actinides are experimentally defined.
|
Colloid Formation and Stability (W79)
|
R
|
|
|
a R = Reasonable
C = Conservative
Reg. - Based on regulatory guidance
See above - Refers to assumptions 1 through 8 listed at the beginning of this table.
|
|
|
|
|
|
|
|
|
|
|
Table MASS-5. General Modeling Assumptions (Continued)
|
|
Chapter or Section
|
Code
|
Modeling Assumption
|
Related FEP in
Appendix SCR-2014
|
Assumption Considereda
|
|
|
NUTS
PANEL
|
Concentrations of intrinsic colloids and mineral-fragment colloids are modeled as constants based on experimental observations. Humic and microbial colloidal An concentrations are modeled as proportional to dissolved An concentrations.
|
Colloid Formation and Stability (W79)
|
R
|
|
NUTS
PANEL
|
The maximum concentration of each An associated with each colloid type is constant.
|
Actinide Sorption (W61)
|
R
|
|
CRA-2004: 6.4.4
Shafts and Shaft Seals
CRA-2014: MASS-11.0
Shafts and Shaft Seals
|
BRAGFLO
|
General Assumptions 1 to 8.
|
-
|
See above
|
|
BRAGFLO
|
The four shafts connecting the repository to the surface are represented by a single shaft with a cross-section and volume equal to the total volume of the four real shafts and separated from the waste by less than the distance of the nearest real shaft.
|
Disposal Geometry (W1)
|
R
|
|
BRAGFLO
|
The shaft seal system is represented by an upper and lower shaft region representing a composite of the actual materials in those regions.
|
Shaft Seal Geometry (W6)
Shaft Seal Physical Properties (W7)
|
R
|
|
BRAGFLO
|
The shaft is surrounded by a DRZ which heals with time. The DRZ is represented through the composite permeabilities of the shaft system itself, rather than as a discrete zone. The effective permeabilities of shaft materials are adjusted at 200 years after closure to reflect consolidation and possible degradation. Permeabilities are constant for the shaft seal materials through the Rustler formation.
|
Salt Creep (W20)
Consolidation of Shaft Seals (W36)
DRZ (W18)
Microbial Growth on Concrete (W76)
Chemical Degradation of Shaft Seals (W74)
Mechanical Degradation of Shaft Seals (W37)
|
R
|
|
a R = Reasonable
C = Conservative
Reg. - Based on regulatory guidance
See above - Refers to assumptions 1 through 8 listed at the beginning of this table.
|
|
Table MASS-5. General Modeling Assumptions (Continued)
|
|
|
Chapter or Section
|
Code
|
Modeling Assumption
|
Related FEP in
Appendix SCR-2014
|
Assumption Considereda
|
|
|
NUTS
|
Radionuclides are not retarded by the seals.
|
Actinide Sorption (W61)
Speciation (W56)
|
C
|
|
CRA-2004: 6.4.5
The Salado
CRA-2014: MASS-12.0
Salado
|
BRAGFLO
|
General Assumptions 1 to 8.
|
-
|
See above
|
|
CRA-2004: 6.4.5.1
Impure Halite
CRA-2014: MASS-12.1
High Threshold Pressure for Halite-Rich Salado Rock Units
|
BRAGFLO
|
Intact rock and hydrologic properties are constant.
|
Stratigraphy (N1)
|
R
|
|
CRA-2004: 6.4.5.2
Salado Interbeds
CRA-2014: MASS-12.3
The Fracture Model
|
BRAGFLO
|
Interbeds have a fracture-initiation pressure above which local fracturing and changes in porosity and permeability occur in response to changes in pore pressure. A power function relates the permeability increase to the porosity increase. A pressure is specified above which porosity and permeability do not change.
|
Disruption Due to Gas Effects (W25)
|
R
|
|
BRAGFLO
|
Interbeds have identical physical properties; they differ only in position, thickness, and some fracture parameters.
|
Saturated Groundwater Flow (N23)
|
R
|
|
CRA-2004: 6.4.5.3
Disturbed Rock Zone
CRA-2014: MASS-12.4
Flow in the DRZ
|
BRAGFLO
|
The permeability of the DRZ is sampled with the low value similar to intact halite and the high value representing a fractured material. The DRZ porosity is equal to the porosity of Salado halite to plus 0.29%.
|
Disturbed Rock Zone (DRZ) (W18)
Roof Falls (W22)
Gas Explosions (W27)
Seismic Activity (N12)
Underground Boreholes (W39)
|
C-R
|
|
CRA-2004: 6.4.5.4
Actinide Transport in the Salado
CRA-2014: MASS-12.5
Actinide Transport in the Salado
|
NUTS
|
Dissolved actinides and colloidal actinides are transported by advection in the Salado. Diffusion and dispersion are assumed negligible.
|
Advection (W90)
Diffusion (W91)
Matrix Diffusion (W92)
|
R
|
|
a R = Reasonable
C = Conservative
Reg. - Based on regulatory guidance
See above - Refers to assumptions 1 through 8 listed at the beginning of this table.
|
|
|
Table MASS-5. General Modeling Assumptions (Continued)
|
|
|
Chapter or Section
|
Code
|
Modeling Assumption
|
Related FEP in
Appendix SCR-2014
|
Assumption Considereda
|
|
|
|
|
NUTS
|
Sorption of actinides in the anhydrite interbeds, colloid retardation, colloid transport at higher than average velocities, coprecipitation of minerals containing actinides, channeled flow, and viscous fingering are not modeled.
|
Actinide Sorption (W61)
Colloid Transport (W78)
Colloid Filtration (W80)
Colloid Sorption (W81)
Fluid Flow Due to Gas Production (W42)
Fracture Flow (N25)
|
R
|
|
|
|
NUTS
|
Radionuclides having similar decay and transport properties have been grouped together for transport calculations as discussed in Kicker and Zeitler (Kicker and Zeitler 2013). See also assumptions for dissolved actinide source term.
|
Radionuclide Decay and Ingrowth (W12)
|
R
|
|
|
|
NUTS
|
Sorption of actinides in the borehole is not modeled.
|
Actinide Sorption (W61)
|
C
|
|
|
|
CRA-2004: 6.4.6
Units Above the Salado
CRA-2014: MASS-13.0
Geologic Units above the Salado
|
SECOTP2D
|
Above the Salado, lateral An transport to the accessible environment can occur only through the Culebra.
|
Saturated Groundwater Flow (N23)
Unsaturated Groundwater Flow (N24)
Solute Transport (W77)
|
R
|
|
|
|
CRA-2004: 6.4.6.1
Los Medaños
|
MODFLOW-2000
BRAGFLO
|
The Los Medaños member of the Rustler Formation, Tamarisk, and Forty-niner are assumed to be impermeable.
|
Saturated Groundwater Flow (N23)
|
C
|
|
|
|
CRA-2004: 6.4.6.2
The Culebra
CRA-2014: MASS-14.0
Flow through the Culebra
CRA-2014: TFIELD
|
MODFLOW-2000
SECOTP2D
|
General Assumptions 1, 6, and 8.
|
-
|
See above
|
|
|
|
MODFLOW-2000
|
For fluid flow, the Culebra is modeled as a uniform (single-porosity) porous medium.
|
Saturated Groundwater flow (N23)
|
R
|
|
|
a R = Reasonable
C = Conservative
Reg. - Based on regulatory guidance
See above - Refers to assumptions 1 through 8 listed at the beginning of this table.
|
|
|
|
|
|
|
|
|
|
|
|
|
|
|
Table MASS-5. General Modeling Assumptions (Continued)
|
|
|
Chapter or Section
|
Code
|
Modeling Assumption
|
Related FEP in
Appendix SCR-2014
|
Assumption Considereda
|
|
|
|
|
MODFLOW-2000
|
The Culebra flow field is determined from the observed hydraulic conditions and estimates of the effects of climate change and potash mining outside the controlled area, and does not change with time unless mining is predicted to occur in the disposal system in the future.
|
Saturated Groundwater Flow (N23)
Climate Change (N61)
Precipitation (e.g.,, Rainfall) (N59)
Temperature (N60)
Changes in Groundwater Flow Due to Mining (H37)
|
R
|
|
|
|
BRAGFLO
|
The Culebra is assigned a single permeability to calculate brine flow into the unit from an intrusion borehole.
|
Natural Borehole Fluid Flow (H31)
Waste-Induced Borehole Flow (H32)
|
R
|
|
|
|
MODFLOW-2000
|
Gas flow in the Culebra is not modeled. Gas from the repository does not affect fluid flow in the Culebra.
|
Saturated Groundwater Flow (N23)
Fluid Flow Due to Gas Production (W42)
|
R
|
|
|
|
BRAGFLO
MODFLOW-2000
SECOTP2D
|
Different thicknesses of the Culebra are assumed for BRAGFLO, MODFLOW-2000, and SECOTP2D calculations, although the transmissivities are consistent.
|
Effects of Preferential Pathways (N27)
|
R
|
|
|
|
PEST
|
Uncertainty in the spatial variability of the Culebra transmissivity is accounted for by statistically generating 100 transmissivity fields for PA.
|
Saturated Groundwater Flow (N23)
Fracture Flow (N25)
Shallow Dissolution (N16)
|
R
|
|
|
|
MODFLOW-2000
BRAGFLO
|
Potentiometric heads are set on the edges of the regional grid to represent flow in a portion of a much larger hydrologic system.
|
Groundwater Recharge (N54)
Groundwater Discharge (N53)
Changes in Groundwater Recharge and Discharge (N56)
Infiltration (N55)
|
R
|
|
|
a R = Reasonable
C = Conservative
Reg. - Based on regulatory guidance
See above - Refers to assumptions 1 through 8 listed at the beginning of this table.
|
|
|
|
|
|
|
|
|
|
|
Table MASS-5. General Modeling Assumptions (Continued)
|
|
|
Chapter or Section
|
Code
|
Modeling Assumption
|
Related FEP in
Appendix SCR-2014
|
Assumption Considereda
|
|
CRA-2004: 6.4.6.2.1
Transport of Dissolved Actinides in the Culebra
CRA-2014: MASS-14.2
Dissolved Actinide Transport and Retardation in the Culebra
|
SECOTP2D
|
Dissolved actinides are transported by advection in high-permeability features and by diffusion in low-permeability features.
|
Solute Transport (W77)
Advection (W90)
Diffusion (W91)
Matrix Diffusion (W92)
|
R
|
|
SECOTP2D
|
Sorption occurs on dolomite in the matrix. Sorption on clays present in the Culebra is not modeled.
|
Actinide Sorption (W61)
Changes in Sorptive Surfaces (W63)
|
C
|
|
SECOTP2D
|
Sorption is represented using a linear isotherm model.
|
Actinide Sorption (W61)
Kinetics of Sorption (W62)
|
R
|
|
SECOTP2D
|
The possible effects on sorption of the injection of brines from the Castile and Salado into the Culebra are accounted for in the distribution of An Kd values.
|
Actinide Sorption (W61)
Groundwater Geochemistry (N33) Changes in Groundwater Eh (N36) Changes in Groundwater pH (N37)
Natural Borehole Fluid Flow (H31)
|
R
|
|
SECOTP2D
|
Hydraulically significant fractures are assumed to be present everywhere in the Culebra.
|
Advection (W90)
|
C
|
|
CRA-2004: 6.4.6.2.2
Transport of Colloidal Actinides in the Culebra
CRA-2014: MASS-14.3
Colloidal Actinide Transport and Retardation in the Culebra
|
SECOTP2D
|
An humic colloids are chemically retarded identically to dissolved actinides and are treated as dissolved actinides.
|
Advection (W90)
Diffusion (W91)
Colloid Transport (W78)
Microbial Transport (W87)
|
R
|
|
SECOTP2D
|
The concentration of intrinsic colloids is sufficiently low to justify elimination from PA transport calculations in the Culebra.
|
-
|
R
|
|
a R = Reasonable
C = Conservative
Reg. - Based on regulatory guidance
See above - Refers to assumptions 1 through 8 listed at the beginning of this table.
|
|
|
|
|
|
|
|
Table MASS-5. General Modeling Assumptions (Continued)
|
|
|
Chapter or Section
|
Code
|
Modeling Assumption
|
Related FEP in
Appendix SCR-2014
|
Assumption Considereda
|
|
|
SECOTP2D
|
Microbial colloids and mineral fragments are too large to undergo matrix diffusion. Filtration of these colloids, which is modeled using an exponential decay approach, occurs in high-permeability features. Attenuation is so effective that associated actinides are assumed to be retained within the disposal system and are not transported in SECOTP2D.
|
Microbial Transport (W87)
Colloid Sorption (W81)
|
R
|
|
CRA-2004: 6.4.6.2.3
Subsidence Due to Potash Mining
CRA-2014: MASS-14.4
Subsidence Caused by Potash Mining in the Culebra
|
MODFLOW-2000
|
The effect of potash mining is to increase the hydraulic conductivity in the Culebra by a factor between 1 and 1,000.
|
Conventional Underground Potash Mining (H13)
Changes in Groundwater Flow Due to Mining (H37)
|
Reg.
|
|
CRA-2004: 6.4.6.3
The Tamarisk
|
MODFLOW-2000
BRAGFLO
|
The Tamarisk is assumed to be impermeable.
|
Saturated Groundwater Flow (N23)
|
R
|
|
CRA-2004: 6.4.6.4
The Magenta
|
BRAGFLO
|
General Assumptions 1 to 8.
|
-
|
See above
|
|
BRAGFLO
|
The Magenta permeability is set to the lowest value measured near the center of the WIPP site. This increases the flow into the Culebra.
|
Saturated Groundwater Flow (N23)
|
R
|
|
NUTS
|
No radionuclides entering the Magenta will reach the accessible environment. However, the volumes of brine and actinides entering and stored in the Magenta are modeled.
|
Solute Transport (W77)
|
R
|
|
CRA-2004: 6.4.6.5
The Forty-niner
|
BRAGFLO
|
The Forty-niner is assumed to be impermeable.
|
Saturated Groundwater Flow (N23)
|
R
|
|
a R = Reasonable
C = Conservative
Reg. - Based on regulatory guidance
See above - Refers to assumptions 1 through 8 listed at the beginning of this table.
|
|
|
|
|
|
|
|
Table MASS-5. General Modeling Assumptions (Continued)
|
|
|
Chapter or Section
|
Code
|
Modeling Assumption
|
Related FEP in
Appendix SCR-2014
|
Assumption Considereda
|
|
CRA-2004: 6.4.6.6
Dewey Lake
|
BRAGFLO
|
General Assumptions 1 to 8.
|
-
|
See above
|
|
NUTS
|
The sorptive capacity of the Dewey Lake is sufficiently large to prevent any release over 10,000 years.
|
Saturated Groundwater Flow (N23)
Actinide Sorption (W61)
|
R
|
|
CRA-2004: 6.4.6.7
Supra-Dewey Lake Units
|
BRAGFLO
|
General Assumptions 1 to 8.
|
-
|
See above
|
|
BRAGFLO
|
The units above the Dewey Lake are a single hydrostratigraphic unit.
|
Stratigraphy (N1)
|
R
|
|
BRAGFLO
|
The units are thin and predominantly unsaturated.
|
Unsaturated Groundwater Flow (N24)
Saturated Groundwater Flow (N23)
|
R
|
|
CRA-2004: 6.4.7
The Intrusion Borehole
CRA-2004: 6.4.7.1
Releases during Drilling
CRA-2014: MASS-15.0
Intrusion Borehole
|
CUTTINGS_S
BRAGFLO DRSPALL
|
Any actinides that enter the borehole during drilling are assumed to reach the surface.
|
-
|
C
|
|
CRA-2014: MASS-15.1
Cuttings, Cavings, and Spall Releases during Drilling
|
BRAGFLO
PANEL
CUTTINGS_S
DRSPALL
|
Future drilling practices will be the same as they are at present.
|
Oil and Gas Exploration (H1)
Potash Exploration (H2)
Oil and Gas Exploitation (H4)
Other Resources (H8)
Enhanced Oil and Gas Recovery (H9)
|
Reg.
|
|
CUTTINGS_S
DRSPALL
|
Releases of particulate waste material are modeled (cuttings, cavings, and spallings). Releases are corrected for radioactive decay until the time of intrusion.
|
Drilling Fluid Flow (H21)
Suspension of Particles (W82)
Cuttings (W84)
Cavings (W85)
Spallings (W86)
|
R
|
|
CUTTINGS_S
|
Degraded waste properties are based on marine clays and surrogate materials.
|
Cavings (W85)
|
C
|
|
a R = Reasonable
C = Conservative
Reg. - Based on regulatory guidance
See above - Refers to assumptions 1 through 8 listed at the beginning of this table.
|
|
|
|
|
|
|
|
|
Table MASS-5. General Modeling Assumptions (Continued)
|
|
|
Chapter or Section
|
Code
|
Modeling Assumption
|
Related FEP in
Appendix SCR-2014
|
Assumption Considereda
|
|
|
|
|
DRSPALL
|
A hemispherical geometry with one-dimensional spherical symmetry defines the flow field and cavity in the waste.
|
Spallings (W86)
|
C
|
|
|
|
DRSPALL
|
Tensile strength, based on completely degraded waste surrogates, is felt to represent extreme, low-end tensile strengths because it does not account for several strengthening mechanisms.
|
Spallings (W86)
|
C
|
|
|
|
DRSPALL
|
Shape factor is 0.1, corresponding to particles that are easier to fluidize and entrain in the flow.
|
Spallings (W86)
|
C
|
|
|
|
CRA-2004: 6.4.7.1.1
Direct Brine Release During Drilling
CRA-2014: MASS-15.2
Direct Brine Releases during Drilling
|
BRAGFLO
PANEL
|
Brine containing actinides may flow to the surface during drilling. DBR will have negligible effect on the long-term pressure and saturation in the waste panel.
|
Blowouts (H23)
|
R
|
|
|
|
BRAGFLO
|
A two-dimensional grid (one degree dip) on the scale of the waste disposal region is used for DBR calculations.
|
Blowouts (H23)
|
R
|
|
|
|
BRAGFLO
CCDFGF
|
Calculation of DBR from several different locations provides reference results for the variation in release associated with location.
|
Blowouts (H23)
|
R
|
|
|
|
CRA-2004: 6.4.7.2
Long-Term Releases Following Drilling
CRA-2014: MASS-15.3
Long-Term Properties of the Abandoned Intrusion Borehole
|
BRAGFLO
CCDFGF
|
Plugging and abandonment of future boreholes are assumed to be consistent with practices in the Delaware Basin.
|
Natural Borehole Fluid Flow (H31)
Waste-Induced Borehole Flow (H32)
|
Reg.
|
|
|
|
CRA-2004: 6.4.7.2.1
Continuous Concrete Plug through the Salado and Castile
(Plug type VI in U.S. DOE 2012)
|
BRAGFLO
CCDFGF
|
A continuous concrete plug is assumed to exist throughout the Salado and Castile. Long-term releases through a continuous plug are analogous to releases through a sealed shaft.
|
Natural Borehole Fluid Flow (H31)
Waste-Induced Borehole Flow (H32)
|
Reg.-R
|
|
|
a R = Reasonable
C = Conservative
Reg. - Based on regulatory guidance
See above - Refers to assumptions 1 through 8 listed at the beginning of this table.
|
|
|
|
|
|
|
|
|
|
|
Table MASS-5. General Modeling Assumptions (Continued)
|
|
|
Chapter or Section
|
Code
|
Modeling Assumption
|
Related FEP in
Appendix SCR-2014
|
Assumption Considereda
|
|
|
|
CRA-2004: 6.4.7.2.2
The Two-Plug Configuration
(Plug types I, III, and V in U.S. DOE 2012)
|
BRAGFLO
|
A lower plug is located between the Castile brine reservoir and underlying formations. A second plug is located immediately above the Salado. The brine reservoir and waste panel are in direct communication though an open cased hole.
|
Natural Borehole Fluid Flow (H31)
Waste-Induced Borehole Flow (H32)
|
Reg.-R
|
|
|
|
BRAGFLO
|
The casing and upper concrete plug are assumed to fail after 200 years, and the borehole is assumed to be filled with silty-sand-like material. At 1,200 years after abandonment, the permeability of the borehole below the waste panel is decreased by one order of magnitude as a result of salt creep.
|
Natural Borehole Fluid Flow (H31)
Waste-Induced Borehole Flow (H32)
|
R
|
|
|
|
CRA-2004: 6.4.7.2.3
The Three-Plug Configuration
(Plug types II and IV in U.S. DOE 2012)
|
BRAGFLO
|
In addition to the two-plug configuration, a third plug is placed within the Castile above the brine reservoir. The third plug is assumed not to fail over the regulatory time period.
|
Natural Borehole Fluid Flow (H31)
Waste-Induced Borehole Flow (H32)
|
Reg.-R
|
|
|
|
CRA-2004: 6.4.8
Castile Brine Reservoir
CRA-2014: MASS-17.0
Castile Brine Reservoir
|
BRAGFLO
|
The Castile region is assigned a low permeability, which inhibits fluid flow. Brine occurrences in the Castile are bounded systems. Brine reservoirs under the waste panels are assumed to have limited extent and interconnectivity, with effective radii on the order of several hundred meters (m).
|
Brine Reservoirs (N2)
|
R
|
|
|
|
CRA-2004: 6.4.9
Climate Change
CRA-2014: MASS-16.0
Climate Change
|
SECOTP2D
|
Climate-related factors are treated through recharge. A parameter called the Climate Index is used to scale the Culebra flux field.
|
Climate Change (N61) Temperature (N60)
Precipitation (e.g., Rainfall) (N59)
|
R
|
|
|
a R = Reasonable
C = Conservative
Reg. - Based on regulatory guidance
See above - Refers to assumptions 1 through 8 listed at the beginning of this table.
|
|
|
|
|
|
|
|
|
|
Table MASS-5. General Modeling Assumptions (Continued)
|
|
|
Chapter or Section
|
Code
|
Modeling Assumption
|
Related FEP in
Appendix SCR-2014
|
Assumption Considereda
|
|
CRA-2004: 6.4.10
Initial and Boundary Conditions for Disposal System Modeling
CRA-2004: 6.4.10.1
Disposal System Flow and Transport Modeling (BRAGFLO and NUTS)
|
BRAGFLO
|
There are no gradients for flow in the far-field of the Salado, and pressures are above hydrostatic but below lithostatic. Excavation and waste emplacement result in partial drainage of the DRZ.
|
Saturated Groundwater Flow (N23)
Brine Inflow (W40)
|
R
|
|
BRAGFLO
|
An initial water-table surface is set in the Dewey Lake at an elevation of 980 m (3,215 ft) above mean sea level. The initial pressures in the Salado are extrapolated from a sampled pressure in MB139 at the shaft and are in hydrostatic equilibrium. The excavated region is assigned an initial pressure of one atmosphere. The liquid saturation of the waste-disposal region is consistent with the liquid saturation of emplaced waste. Other excavated regions are assigned zero liquid saturation, except the shaft, which is fully saturated.
|
Saturated Groundwater Flow (N23)
|
R
|
|
NUTS
|
Molecular transport boundary conditions are no diffusion or dispersion in the normal direction across far-field boundaries. Initial An concentrations are zero everywhere, except in the waste.
|
Radionuclide Decay and Ingrowth (W12)
Solute Transport (W77)
|
R
|
|
CRA-2004: 6.4.10.2
Culebra Flow and Transport Modeling (MODFLOW-2000, SECOTP2D)
|
MODFLOW-2000
|
Constant head and no-flow boundary conditions are set on the far-field boundaries of the flow model.
|
Saturated Groundwater Flow (N23)
|
R
|
|
MODFLOW-2000
|
Initial An concentrations in the Culebra are zero.
|
Solute Transport (W77)
|
R
|
|
a R = Reasonable
C = Conservative
Reg. - Based on regulatory guidance
See above - Refers to assumptions 1 through 8 listed at the beginning of this table.
|
|
|
|
|
|
|
|
Table MASS-5. General Modeling Assumptions (Continued)
|
|
|
Chapter or Section
|
Code
|
Modeling Assumption
|
Related FEP in
Appendix SCR-2014
|
Assumption Considereda
|
|
CRA-2004: 6.4.10.3
Initial and Boundary Conditions for Other Computational Models
|
NUTS
PANEL
BRAGFLO
(DBR)
CUTTINGS_S
|
Initial and boundary conditions are interpolated from previously executed BRAGFLO calculations.
|
-
|
R
|
|
CRA-2004: 6.4.12
Sequences of Future Events
|
CCDFGF
|
Each 10,000-year future (random sequence of future events) is generated by randomly and repeatedly sampling (1) the time between drilling events, (2) the location of drilling events, (3) the activity level of the waste penetrated by each drilling intrusion, (4) the plug configuration of the borehole, and (5) the penetration of a Castile brine reservoir, and by randomly sampling the occurrence of mining in the disposal system.
|
Oil and Gas Exploration (H1)
Potash Exploration (H2)
Oil and Gas Exploitation (H4)
Other Resources (H8)
Enhanced Oil and Gas Recovery (H9)
Natural Borehole Fluid Flow (N31)
Waste-Induced Borehole Flow (H32)
|
Reg.-R
|
|
CRA-2004: 6.4.12.1
Active and Passive Institutional Controls in Performance Assessment
|
CCDFGF
|
Active institutional controls are effective for 100 years and completely eliminate the possibility of disruptive human activities (e.g., drilling and mining). No credit is taken for passive institutional controls.
|
-
|
Reg.-R
|
|
CRA-2004: 6.4.12.2
Number and Time of Drilling Intrusions
|
CCDFGF
|
Drilling may occur after 100 years according to a Poisson process.
|
Loss of Records (H57)
Oil and Gas Exploration (H1)
Potash Exploration (H2)
Oil and Gas Exploitation (H4)
Other Resources (H8)
|
Reg.-R
|
|
CRA-2004: 6.4.12.3
Location of Intrusion Boreholes
|
CCDFGF
|
The waste disposal region is discretized into 144 regions, each with an equal probability of being intersected. A borehole can penetrate only one region.
|
Disposal Geometry (W1)
|
R
|
|
a R = Reasonable
C = Conservative
Reg. - Based on regulatory guidance
See above - Refers to assumptions 1 through 8 listed at the beginning of this table.
|
|
|
|
|
|
|
|
|
Table MASS-5. General Modeling Assumptions (Continued)
|
|
|
Chapter or Section
|
Code
|
Modeling Assumption
|
Related FEP in
Appendix SCR-2014
|
Assumption Considereda
|
|
|
|
CRA-2004: 6.4.12.4
Activity of the Intersected Waste
Appendix TRU WASTE-2004
|
CCDFGF
|
Four-hundred fifty one waste streams are identified as contact-handled transuranic (CH-TRU). All 77 remote-handled transuranic (RH-TRU) waste streams were grouped (binned) together into one equivalent or average (WIPP-scale) RH-TRU waste stream.
|
Heterogeneity of Waste Forms (W3)
|
R
|
|
|
|
CRA-2004: 6.4.12.5
Diameter of the Intrusion Borehole
|
CUTTINGS_S
|
The diameter of the intrusion borehole is constant at 12.25 inches (in.) (31.12 centimeters [cm]).
|
-
|
Reg.-R
|
|
|
|
CRA-2004: 6.4.12.6
Probability of Intersecting a Brine Reservoir
|
CCDFGF
|
The probability that a deep borehole intersects the single brine reservoir below the waste panels is sampled from a normal distribution with a mean of 0.127 and a standard deviation equal to 0.0272 (see Kirchner, Zeitler, and Kirkes 2012).
|
Brine Reservoirs (N2)
|
R
|
|
|
|
CRA-2004: 6.4.12.7
Plug Configuration in the Abandoned Intrusion Borehole
|
CCDFGF
|
The two-plug configuration has a probability of 0.594. The three-plug configuration has a probability of 0.366. The continuous concrete plug has a probability of 0.04 (see Camphouse 2013).
|
-
|
Reg.-R
|
|
|
|
CRA-2004: 6.4.12.8
Probability of Mining Occurring in the Land Withdrawal Area
|
CCDFGF
|
Mining in the disposal system occurs a maximum of once in 10,000 years (a 10-4 probability per year).
|
-
|
Reg.-R
|
|
|
|
CRA-2004: 6.4.13
Construction of a Single Complementary Cumulative Distribution Function (CCDF)
|
CCDFGF
|
Deterministic calculations from BRAGFLO, NUTS, MODFLOW-2000, SECOTP2D, CUTTINGS_S, and PANEL are used to generate reference conditions that are used to estimate the consequences associated with random sequences of future events. These are, in turn, used to develop CCDFs.
|
-
|
R
|
|
|
a R = Reasonable
C = Conservative
Reg. - Based on regulatory guidance
See above - Refers to assumptions 1 through 8 listed at the beginning of this table.
|
|
|
Table MASS-5. General Modeling Assumptions (Continued)
|
|
|
Chapter or Section
|
Code
|
Modeling Assumption
|
Related FEP in
Appendix SCR-2014
|
Assumption Considereda
|
|
|
CCDFGF
|
Ten thousand random sequences of future events are generated for each CCDF plotted.
|
-
|
R
|
|
CRA-2004: 6.4.13.1 Constructing Consequences of the Undisturbed Performance Scenario
|
CCDFGF
|
A BRAGFLO and NUTS calculation with undisturbed conditions is sufficient for estimating the consequences of the undisturbed performance scenario.
|
-
|
R
|
|
CRA-2004: 6.4.13.2
Scaling Methodology for Disturbed Performance Scenarios
|
CCDFGF
|
Consequences for random sequences of future events are constructed by scaling the consequences associated with deterministic calculations (reference conditions) to other times, generally by interpolation, but sometimes by assuming either similarity or no consequence.
|
-
|
R
|
|
CRA-2004: 6.4.13.3
Estimating Long-Term Releases from the E1 Scenario
|
CCDFGF
NUTS
|
Reference conditions are calculated or estimated for intrusions at 100, 350, 1,000, 3,000, 5,000, 7,000, and 9,000 years.
|
Waste-Induced Borehole Flow (H32)
|
R
|
|
CRA-2004: 6.4.13.4
Estimating Long-Term Releases from the E2 Scenario
|
CCDFGF
NUTS
SECOTP2D
|
The methodology is similar to the methodology for the E1 scenario. For multiple E1 intrusions into the same panel, the additional source term to the Culebra for the second and subsequent intrusions is assumed to be negligible.
|
Waste-Induced Borehole Flow (H32)
Waste Inventory (W2)
|
R
|
|
CRA-2004: 6.4.13.5
Estimating Long-Term Releases from the E1E2 Scenario
|
CCDFGF
PANEL
|
The concentration of actinides in liquid moving up the borehole assumes homogeneous mixing within the panel.
|
Waste-Induced Borehole Flow (H32)
|
C
|
|
PANEL
|
Any actinides that enter the borehole for long-term flow calculations reach the Culebra.
|
Waste-Induced Borehole Flow (H32)
|
C
|
|
a R = Reasonable
C = Conservative
Reg. - Based on regulatory guidance
See above - Refers to assumptions 1 through 8 listed at the beginning of this table.
|
|
|
|
|
|
|
|
|
|
|
|
|
Table MASS-5. General Modeling Assumptions (Continued)
|
|
|
Chapter or Section
|
Code
|
Modeling Assumption
|
Related FEP in
Appendix SCR-2014
|
Assumption Considereda
|
|
|
CCDFGF
PANEL
|
Reference conditions are calculated or estimated for intrusion at 100, 300, 1,000, 2,000, 4,000, 6,000 and 9,000 years.
|
Oil and Gas Exploration (H1)
|
-
|
|
CRA-2004: 6.4.13.6
Multiple Scenario Occurrences
|
CCDFGF
PANEL
|
The panels are assumed not to be interconnected for long-term brine flow.
|
Saturated Groundwater Flow (N23)
Unsaturated Groundwater Flow (N24)
|
R
|
|
CRA-2004: 6.4.13.7
Estimating Releases During Drilling for All Scenarios
|
CCDFGF
PANEL
NUTS
|
Repository conditions will be dominated by Castile brine if any borehole connects to a brine reservoir.
|
Brine Reservoirs (N2)
Natural Borehole Fluid Flow (H31)
|
R
|
|
CUTTINGS_S
PANEL
CCDFGF
|
Depletion of actinides in parts of the repository penetrated by boreholes is not accounted for in calculating the releases from subsequent intrusions at such locations.
|
Waste-Induced Borehole Flow (H32)
Waste Inventory (W2)
|
C
|
|
CRA-2004: 6.4.13.8
Estimating Releases in the Culebra and the Impact of the Mining Scenario
|
CCDFGF
|
Releases from intrusions at random times in the future are scaled from releases calculated at 100 years with a unit source of radionuclides in the Culebra.
|
-
|
R
|
|
CCDFGF
|
Actinides in transit in the Culebra when mining occurs are transported in the flow field used for the undisturbed case. Actinides introduced subsequent to mining are transported in the flow field used for the disturbed case (i.e., the mined case).
|
-
|
R
|
|
a R = Reasonable
C = Conservative
Reg. - Based on regulatory guidance
See above - Refers to assumptions 1 through 8 listed at the beginning of this table.
|
|
|
|
|
|
|
|
A mathematical relationship expressing fluid flux as a function of hydraulic head gradients in a porous medium, commonly known as Darcy's Law, is applied to geologic media for all fluid-flow calculations. For details about the specific formulation of Darcy's Law used in these calculations, refer to Appendix PA-2014, Section PA-4.2
for the disposal system and Section PA-4.8 for the Culebra. Darcy's Law is not applied for flow up a borehole being drilled (see Section MASS-15.2; the CRA-2004, Chapter 6.0, Section 6.4.7.1.1; and Appendix PA-2014, Section PA-4.7
for more discussion of this topic).
Darcy's Law generally applies to flow models for which certain conditions are satisfied: (1) the flow occurs in a porous medium with interconnected porosity, (2) flow velocities are low enough that viscous forces dominate inertial forces, and (3) a threshold hydraulic gradient is exceeded. In the CCA, Appendix MASS, these conditions were shown to be valid for the WIPP PA.
Darcy's Law assumes laminar flow; that is, there is no motion of the fluid at the fluid/solid interface and velocity increases with distance from the fluid/solid interface. For liquids, it is reasonable to assume laminar flow under most conditions, including those found in and surrounding the WIPP repository. For gases at low pressure, however, gas molecules near the solid interface may not have intimate contact with the solid and may have finite velocity, not necessarily zero. This effect, which results in additional flux of gas above that predicted by application of Darcy's Law, is known as the slip phenomenon, or Klinkenberg effect (Bear 1972, p. 128). A correction to Darcy's Law for the Klinkenberg effect is incorporated into the BRAGFLO model (see Appendix PA-2014, Section PA-4.2
).
Darcy flow for one and two phases implies that values for principal fluid and rock parameters must be specified. Fluid properties in the Darcy flow model used for the WIPP PA are density, viscosity, and compressibility, while rock properties are porosity, permeability, and compressibility (pore or bulk). In BRAGFLO, other parameters are required to describe the interactions or interference between the gas and brine phases present in the model because those phases can occupy the same pore space. In the WIPP application of Darcy flow models, compressibility of both the liquid and rock are related to porosity through a dependence on pressure. Fluid density, viscosity, and compressibility are functions of fluid composition, pressure, and temperature. It is assumed in BRAGFLO that fluid (both brine and gas) density and compressibility are pressure dependent, but fluid (both brine and gas) viscosity is constant. Fluid composition for the purposes of modeling flow and transport is assumed to be constant.
Hydrogen gas is produced as a result of the corrosion of steel in the repository by water or brine. As in the CCA, the gas phase in the BRAGFLO model is assigned the properties of hydrogen because hydrogen will, under most conditions reasonable for the WIPP, be the dominant component of the gas phase. The model for spallings, DRSPALL, also assigns the physical properties of hydrogen to the gas phase. As discussed in the following text, the effect of assuming flow of pure H2 instead of a mixture of gases (including H2,CO2, H2S, and methane (CH4), can be shown to be minor relative to the permeability variations in the surrounding formations.
Other gases may be produced by processes occurring in the repository. If microbial degradation occurs, a significant amount of CO2 and possibly CH4 will be generated by microbial degradation of cellulosics and, possibly, plastics and rubbers in the waste. The CO2 produced, however, will react with the magnesium-oxide (MgO) engineered barrier and cementitious materials to form brucite (Mg(OH)2), hydromagnesite (Mg5(CO3)4(OH)2
×4H2O), and calcite (CaCO3), thus resulting in very low CO2 fugacity in the repository. Although other gases exist in the disposal system, BRAGFLO calculations assume these gases are insignificant and they are not included in the model.
With the average stoichiometry gas generation model, the total number of moles of gas generated will be the same whether the gas is considered to be pure H2 or a mixture of several gases, because the generation of other gases is accounted for by specifying the stoichiometric factor for microbial degradation of cellulose (see Appendix PA-2014, Section PA-4.2.5
). Therefore, considering only the moles of gas generated, the pressure buildup in the repository will be approximately the same because the expected gases behave similarly to an ideal gas, even up to lithostatic pressures.
The effect of assuming pure H2 instead of a mixture of gases (including H2, CO2, H2S and CH4) on flow behavior, and its resulting impact on the WIPP repository pressure, is as follows:
Radial flow in a fully saturated rock with nonideal gas is described by Darcy's Law, which, for the given problem, has a solution of the form (Amyx, Bass, and Whiting 1960, p. 78, Equation 2-33
)
 (MASS.1)
which can be rewritten as
 (MASS.2)
where
q = gas flow rate (cubic ft per day at base (reference) conditions)
T = temperature (K)
P = pressure (pounds per square inch absolute)
k = permeability (millidarcys)
h = height (ft)
μ = viscosity (centipoises)
Z = gas compressibility factor (defined as the ratio of the actual molar volume of a gas to the corresponding ideal gas volume RT/P at the same temperature and pressure)
r = radius (consistent units)
R = ideal gas constant
e = denotes external boundary (repository)
w = denotes internal boundary (wellbore)
b = denotes base or reference conditions for gas (temperature, pressure, compressibility factor)
avg = denotes average properties between external and internal boundaries because u and z are functions of pressure, which change with time
This expression is useful for examining the effects of gas properties, specifically the viscosity (μ) and the compressibility (Z) and rock properties (namely k), on the flow rate (q) and the pressure (P).
To evaluate the effect of gas composition on q and P, SUPERTRAPP, a computer program developed by the National Institute of Standards and Technology (NIST), was used (National Institute of Standards and Technology 1992). SUPERTRAPP calculates gas properties for 116 pure fluids and mixtures of up to 20 components for temperatures to 1,000 K (726 °C, 1340 °F) and pressures to 300 megapascals (MPa). Because such small quantities of H2S are anticipated at the WIPP, its impact is negligible.
Figure MASS-1 shows the relationship between gas viscosity and composition of H2-CO2 mixtures for various mole fractions of H2 at pressures of 7 MPa and 15 MPa, as determined from SUPERTRAPP. The viscosity at 50% mole fraction H2 is about 2.3 times greater than for 100% mole fraction H2. As shown in Equation (MASS.1), viscosity has an inverse relationship to flow rate and, as shown in Equation (MASS.2), a direct relationship to the square of the repository
pressure. Hence, viscosity differences that would result if gas properties other than those of hydrogen were incorporated would result in a decrease in flow rate and potentially higher pressures.
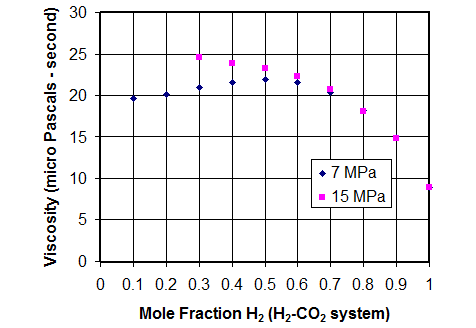
Figure MASS-
1. Gas Viscosity as a Function of Mole Fraction H2 at 7 MPa and
15 MPa Pressure
As shown in Figure MASS-2, the gas compressibility at 50% mole fraction H2 is about 0.9 times that of pure H2. Like viscosity, the gas compressibility (actual volume/ideal volume) is inversely related to flow rate and directly related to the square of the repository pressure. Therefore, the impact of variation in gas compressibility caused by composition would be minor and it is not considered.
The viscosity and compressibility calculations described above for H2-CO2 mixtures were repeated for H2-CH4 mixtures for various mole fractions of H2 at pressures of 7 MPa and 15 MPa (Kanney 2003). The variability of viscosity with the composition for the H2-CH4 mixtures is smaller than that observed for the H2-CO2 mixtures. For example, at 15 Mpa, the gas viscosity of H2-CH4 at 50% mole fraction is only 1.6 times greater than the viscosity at 100% mole fraction. The H2-CH4 mixtures are only slightly less compressible than the H2-CO2 mixtures. For example, at 15 MPa, the gas compressibility of the H2-CH4 at 50% mole fraction is approximately 0.94 times the compressibility at 100% mole fraction. Changing composition from 100% to 50% H2 would result in a slight increase in flow rate and a decrease in pressure.
The permeability of each component of the formation plays a significant role in determining both flow rate and pressure. Because marker bed (MB) permeabilities and Salado impure halite permeabilities vary over three to four orders of magnitude (see Kicker and Herrick 2013), the permeabilities of these flow pathways will have a greater influence on pressure and flow rate determinations than either uncertainty in viscosity or gas compressibility effects.
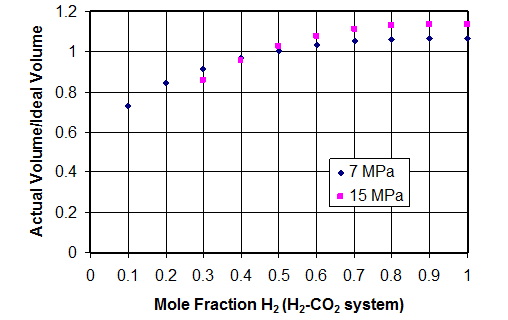
Figure MASS-
2. Gas Compressibility as a Function of Mole Fraction H2
Note that the BRAGFLO code includes a pressure-induced fracture model that will limit pressure increases in the repository (Schreiber 1997). For example, at high repository pressures, the factor of 1.5 pressure increase calculated here using the simplified Darcy's Law model is unlikely to be seen in the BRAGFLO results, since fracturing will lead to increased permeability, effectively limiting pressure increases.
BRAGFLO uses Salado Formation brine properties as the physical properties for all liquids. However, liquid in the modeled region may consist of (1) brine originally in the Salado, (2) liquid introduced in the excavation during construction, maintenance, and ventilation during the operational phase, (3) a very small amount of liquid introduced as a component of the waste, (4) liquid from overlying units, and (5) liquid from the Castile brine reservoir. However, for BRAGFLO modeling, it is assumed that the properties of all of these liquids are similar enough to Salado brine properties that the effect of any variation in properties resulting from liquids mixing is negligible. The variations in chemical properties of brine are accounted for as discussed in Appendix SOTERM-2014, Section SOTERM-2.0
, Section SOTERM-2.3, and Section SOTERM-5.0.
This section presents supplementary information on the disposal system geometry, and includes the representation of panel closures in that discussion. The principal process considered in defining the repository geometry is fluid flow.
The geometry used to represent long-term fluid flow processes in the Salado, flow between a borehole and overlying units, and flow within the repository (where processes coupled to fluid flow such as creep closure and gas generation occur), is a vertical cross section through the repository on a north-south axis (see also Appendix PA-2014, Section PA-4.2.1
). The dimension of this geometry in the direction perpendicular to the plane of the cross section varies so that spatial effects of repository processes can be represented. Using a two-dimensional geometry to represent the three-dimensional Salado flow is based on the assumption that brine and gas flow will converge upon and diverge from the repository horizon. Above and below the repository, it is assumed that any flow between the borehole or shaft (see CRA-2004, Chapter 6.0, Section 6.4.3) and surrounding materials will converge or diverge. Grid flaring is used in the BRAGFLO disposal system geometry, and flows are represented as divergent and convergent from the flaring center (see Section MASS-4.1.1.4). The impact of this implementation in a two-dimensional grid has been compared to a model that does not make the assumption of convergent and divergent flow (see Appendix PA-2004, Attachment MASS, Attachment 4-1 for additional information). The BRAGFLO representation of the Salado also includes the slight and variable dip of beds in the vicinity of the repository. Below the repository, the possible presence of a brine reservoir is considered to be important, so a hydrostratigraphic layer representing the Castile and a possible brine reservoir in it is included (see the CCA, Appendix MASS, Section MASS-4.2
for the disposal system geometry historical context prior to the CCA).
For modeling brine flow from the intruded panel to the borehole during drilling, the geometry represented in BRAGFLO is a two-dimensional, horizontal representation of the repository waste area as described in Section MASS-15.2.
Changes have been made to the disposal system geometry representation in BRAGFLO since that implemented in the CCA. The evolution of these changes is discussed in the following sections for the sake of completeness.
The baseline BRAGFLO grid used in the CCA PA and the CCA Performance Assessment Verification Test (PAVT) had 33 cells in the x direction and 31 cells in the y direction, and is shown in Figure MASS-3. Notably absent from the repository geometry are pillars, individual drifts, and rooms. These were, and still are, excluded for simplicity, as well as the assumption that they have either negligible impact on fluid-flow processes or, alternatively, that including them would be beneficial to long-term repository performance.
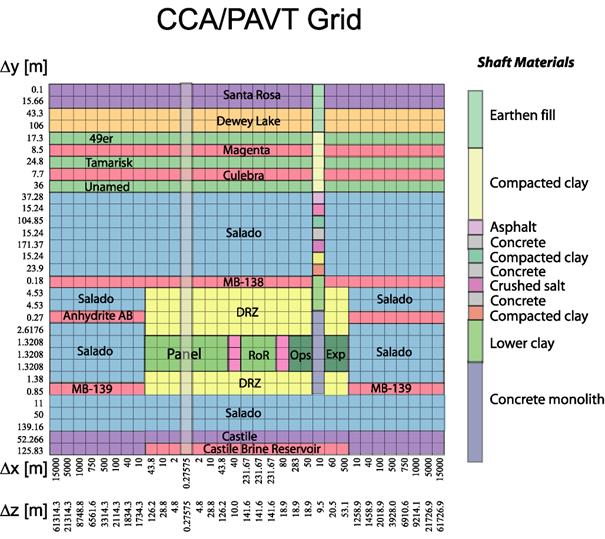
Figure MASS-
3. Logical Grid Used for the CCA PA BRAGFLO Calculations
Several changes were made to the CCA numerical grid as part of the CRA-2004. These changes consisted of the following:
1. A simplified shaft seal model
2. Implementation of Option D-type panel closures
3. Increased segmentation of repository waste regions
4. Refinement to the grid-flaring method
5. Refinement to the x-spacing of the grid beyond the repository to the north and south
6. Refinements to the y-spacing of the grid as allowed by the revised shaft seal model
These changes were substantial enough so as to be designated as modifications to existing conceptual models used in the CCA and the CCA PAVT. All conceptual model changes were approved by the Salado Flow Peer Review Panel in February 2003 (Caporuscio, Gibbons, and Oswald 2003). These changes were made and approved by the EPA in the 2004 recertification decision (U.S. EPA 2006).
A shaft seal model was included in the CRA-2004 grid, and was implemented in a simpler fashion than that used for the CCA PA and the CCA PAVT. A comparison of the shaft seal representations used in the CCA and the CRA-2004 is shown in Figure MASS-4. A detailed description of the parameters used to define the simplified model is discussed in AP-094 (James and Stein 2002) and the resulting analysis report (James and Stein 2003). The simplified shaft model was tested in the AP-106 calculations (Stein and Zelinski 2003a and Stein and Zelinski 2003b). The results of this analysis demonstrated that brine flow through the simplified shaft model was comparable to brine flows through the detailed shaft model in the CCA PAVT calculations (see the CRA-2004, Chapter 9.0, Section 9.1.3.4), and that shaft seals are very effective barriers to flow throughout the 10,000-year regulatory period.
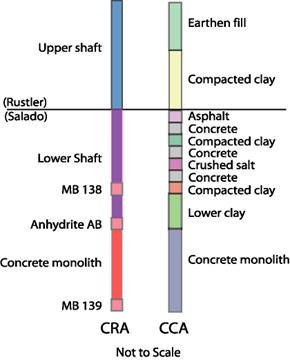
Figure MASS-
4. Comparison of the Simplified Shaft (CRA-2004) and the Detailed Shaft (CCA) Models
The shaft seal model used in the CRA-2004 PA is described by Stein and Zelinski (Stein and Zelinski 2003a and Stein and Zelinski 2003b), and was approved by the Salado Flow Peer Review Panel (Caporuscio, Gibbons, and Oswald 2003).
The CRA-2004 PA shaft representation was used in the CRA-2009 PA, and is also used in the CRA-2014 PA.
The PA calculations that supported the CCA and the subsequent CCA PAVT calculations included generic panel closures in the BRAGFLO grid. The generic panel closures included in the CCA PA and the CCA PAVT calculations were relatively permeable and allowed gas to flow freely between panels. In the CCA PA and the CCA PAVT calculations, a drilling intrusion into a single panel generally caused pressures in the entire repository to decrease.
The DOE presented four panel closure design options (Options A through D) as part of the CCA. Upon reviewing the CCA, the EPA mandated the implementation of the Option D design. The Option D design consists of two components: a large monolith constructed of Salado Mass Concrete (SMC) that is keyed into the surrounding DRZ, and an explosion isolation wall constructed of concrete blocks, which is not keyed into the DRZ. For the CRA-2004, the true cross-sectional area of the Option D panel closure was represented in the flow model, and this implementation is described fully in Appendix PA-2004, Attachment MASS, Section MASS-4.2.4.
Option D panel closures in the CRA-2004 were represented by the following four materials:
1. CONC_PCS: This material represents the concrete monolith, which has properties of SMC.
2. DRZ_PCS: This material represents the DRZ immediately above the concrete monolith that is expected to heal after the emplacement of the monolith.
3. DRF_PCS: This material represents the empty drift and explosion isolation wall portion of the panel closure. This material has the same properties as WAS_AREA (including creep closure).
4. MB materials S_ANH_AB and S_MB 139: These materials are the same as those used to represent the anhydrite MBs in other parts of the grid. MB materials were used because they have permeability ranges very close to the material CONC_PCS and in the case when pressures near the panel closures exceed the fracture initiation pressure of the MBs, fractures could extend around the concrete monolith out of the 2-D plane represented by the numerical grid. By using MB materials to represent the parts of the panel closures that intersect MBs, both the permeability of the closure and the potential fracture behavior of MB material near the closures are represented.
The logical grid representation of the Option D PCS implementation used in the CRA-2004 is shown in Figure MASS-5. The Option D PCS representation shown in that figure was also used in the CRA-2009 PA and CRA-2009 PABC. The Option D PCS is replaced by the ROMPCS in the CRA-2014 PA (see Section MASS-4.1.3).
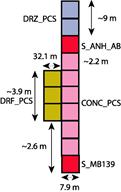
Figure MASS-
5. Logical Grid Representation of the Option D Panel Closures for the CRA-2004
The CCA PA and the CCA PAVT grid divided the waste region into a single panel in the southern end of the repository referred to as the Waste Panel, and a larger region containing the other nine panels referred to as the rest of repository (RoR). The Waste Panel was intersected by an intrusion borehole and was used to represent conditions in any panel intersected by a borehole. Preliminary tests of the Option D panel closure representation (Hansen et al. 2002) concluded that Option D panel closures were effective at impeding fluid flow between panels on the order of thousands of years, but that, given enough time, pressures slowly equilibrated. These results suggested that the effect of a single intrusion event on pressures in other panels depends on the number of panel closures that lie between the intruded panel and the other panels. Therefore, in the CRA-2004, the DOE divided the RoR region used in the CCA and PAVT into northern and southern blocks separated by a set of panel closures. The south RoR block represented conditions in a panel directly adjacent to an intruded panel. The north RoR block represented conditions in a nonadjacent panel far from the intruded panel (i.e., at least two panel closures are between it and the intruded panel). The panel closure between the north and south RoR represented a set of four panel closures located between the northern and southern internal extended panels. This representation assumed that the effects of drilling intrusions are damped in non-intruded panels, and the degree of damping depends on the proximity of the drilling intrusion and the number of panel closures separating the intruded panel from other regions of the repository. The CRA-2009 PA and CRA-2009 PABC used the same segmentation of the waste regions as in the CRA-2004 PA (see Appendix PA-2004, Attachment MASS, Section MASS-4.2.4
for a description of waste-region segmentation). The CRA-2014 PA also uses the waste region segmentation developed during the CRA-2004.
Grid flaring is a method to represent three-dimensional volumes in a two-dimensional grid. Flaring is used when flows can be represented as divergent and convergent from the center of flaring. The CCA PA and CCA PAVT grids used flaring at two different scales: locally around the borehole and shaft, and regionally to the north and south of the excavated regions (around a point in the northern end of the RoR). For the CRA-2004 PA, the local flaring around the borehole was the same as in the CCA PA/CCA PAVT grid. The local flaring around the shaft was eliminated as it had been demonstrated to not be a release pathway. Likewise, the calculation of regional flaring was simplified. The CRA-2009 PA used the same grid flaring as in the CRA-2004 PA (see Appendix PA-2004, Attachment MASS, Section MASS-4.2.5
for a description of grid flaring). The same grid flaring method is used in the CRA-2014.
The grid blocks to the north and south of the excavated region were refined in the x-direction during the CRA-2004. The x-dimension of grid cells immediately to the north and south of the repository were set to 2 m. Cell x-lengths were then increased by a factor of 1.45 toward the north and south.
Exceptions to this algorithm were made to ensure that the location of the Land Withdrawal Boundary and the total extent of the grid matched that of the CCA PA and CCA PAVT grids. This CRA-2004 PA refinement to the X-spacing of grid cells outside of the repository was chosen to reduce numerical dispersion caused by rapid increases in cell dimensions (Anderson and Woessner 1992; Wang and Anderson 1982). The CRA-2009 PA used this refinement, as does the CRA-2014 PA.
During the CRA-2004 PA, grid spacing in the y direction for layers representing the Salado were changed from the CCA PA/CCA PAVT grid spacing. The Salado grid spacing used in the CCA PA was dictated by the thickness of different shaft seal materials. The simplification of the shaft seal representation used in the CRA-2004 allowed for uniform y-spacing in the Salado region of the grid. In addition, two layers were added immediately above and below MB 139 to refine the grid spacing and reduce numerical dispersion. These changes resulted in a total of 33 y divisions for the grid, and increased the numerical accuracy of flow and transport calculations.
The x- and y-direction refinements used in the CRA-2004 PA grid were included in the CRA-2009 PA, and are also included in the CRA-2014 PA.
The combined changes to the BRAGFLO disposal system geometry developed during the CRA-2004 resulted in the BRAGFLO material map and numerical grid shown in Figure MASS-6.
The grid shown in that figure has 68 grid cells in the x direction and 33 cells in the y direction.
The creep closure model used in the CRA-2014 is the same as that used in the CRA-2009 and the CRA-2009 PABC. The model used for creep closure of the repository is discussed in Appendix PORSURF-2014. Historical information on creep closure modeling is also contained in Appendix PORSURF-2014.
Most repository fluid flow assumptions have not changed from those used in the CRA-2009 PABC. Those that did not change are discussed in Section MASS-6.1 and Section MASS-6.2, while those that did change are discussed in Section MASS-6.3. The Repository Fluid Flow conceptual model represents the long-term flow behavior of liquid and gas in the repository and its interaction with other regions in which fluid flow may occur, such as the Salado, shafts, or an intrusion borehole. This model is not used to represent the interaction of fluids in the repository with a borehole during drilling. Historical information on alternative conceptual models for brine inflow to the repository is contained in the CCA, Appendix MASS, Section MASS-7.0.
The first principle in the conceptual model for fluid flow in the repository is that gas and brine can both be present and mobile (two-phase flow), governed by conservation of energy and mass and by Darcy's Law for their fluxes (see Appendix PA-2014, Section PA-4.2
). Consistent with typical concepts of two-phase flow, the phases can affect each other by impeding flow caused by partial saturation (relative permeability effects) and by affecting pressure caused by capillary forces (capillary pressure effects).
The flow of brine and gas in the repository is assumed to behave as two-phase, immiscible, Darcy flow (see Appendix PA-2014, Section PA-4.2
). BRAGFLO is used to simulate brine and gas flow in the repository and to incorporate the effects of disposal-room closure and gas generation. Fluid flow in the repository is affected by the following factors:
·
The geometric association of pillars, rooms, and drifts; waste panel consolidation due to salt creep; and possible borehole locations
·
The varied properties of the waste areas resulting from creep closure and heterogeneous contents
·
Flow interactions with other parts of the disposal system
·
Reactions that generate gas
The geometry of the panel around the intrusion borehole is consistent with the assumption that the fluid flow there will occur directly toward or directly away from the borehole. The geometry represents a semicircular volume north of the borehole and a semicircular volume south of the borehole (representing radial flow in a subregion of a two-dimensional representation of the repository).
Approximating convergent and divergent flow around the intrusion borehole creates a narrow neck in the otherwise fairly uniform numerical grid in the region representing the repository. In the undisturbed performance scenario, and under certain conditions in other scenarios, flow in the repository may pass laterally through this neck. In reality, this neck does not exist. Its presence in the model is expected to have a negligible or conservative impact on model predictions compared to predictions that would result from a more realistic model geometry. The time scale involved and the permeability contrast between the repository and surrounding rock are sufficient so that the lateral flow that may occur in the repository is restricted by the rate at which liquid gets into or out of the repository, rather than by the rate at which it flows through the repository.
Gas generation is affected by the quantity of liquid in contact with metal and CPR waste materials. However, the distribution of fluid in the repository can only be approximated. For example, capillary action can create wicking that would increase the overall region in which gas generation occurs, but modeling this at the necessary resolution to simulate these processes would greatly increase the time required to carry out the modeling (Appendix PA-2014, Section PA-4.2.6
, and CRA-2004, Section 6.4.3.3
). Therefore, as a bounding measure for gas generation purposes, brine in the repository is distributed to an extent greater than estimated by the Darcy flow models or by the values of parameters chosen.
Modeling of flow within the repository is based on homogenizing the room contents into relatively large computational volumes. The approach ignores heterogeneities in disposal room contents that may influence gas and brine behavior by causing fluid flow among channels or creating preferential paths in the waste, bypassing entire regions. Isolated regions could exist for several reasons:
·
They may be isolated by low-permeability regions of waste that serve as barriers.
·
Connectivity with the interbeds may occur only at particular locations within the repository.
·
The repository dip may promote preferential gas flow in the upper regions of the waste.
For the CCA, the adequacy of the repository homogeneity assumption was examined in screening analyses DR-1 (Webb 1995) and DR-6 (Vaughn, Lord, and MacKinnon 1995a). These analyses used an additional parameter in BRAGFLO to specify the minimum active (mobile) brine flow saturation (pseudoresidual brine saturation). Above this saturation, the normal descriptions of two-phase flow apply (i.e., either the Brooks and Corey or van Genuchten and Parker relative permeability models). Below this minimum, brine is immobile, although it is available for reaction and may still be consumed during gas-generation reactions. The assumption of a minimum saturation limit was justified based on the presumed heterogeneity of the waste and the slight dip in the repository. The minimum active brine saturation was treated as an uncertain parameter and sampled uniformly between the values 0.1 and 0.8 during the analysis. This saturation limit was applied uniformly throughout the disposal room to bound the impact of heterogeneities on flow (Webb 1995; Vaughn, Lord, and MacKinnon 1995a). Results of this analysis showed that releases to the accessible environment in the baseline case (homogenization) are consistently higher.
The experimental and operations regions were represented in the CCA PA by a fixed porosity of 18.0% and a permeability of 10-11 m2. The combination of low porosity and high permeability conservatively overestimated fluid flow through these regions and limited the capacity of these regions to store fluids, potentially overestimating releases to the environment. This conclusion was based on a screening analysis (Vaughn, Lord, and MacKinnon 1995b) that examined the importance of permeability varying with porosity in closure regions (waste disposal region, experimental region, and operations region). To perform this analysis, a model for estimating the change in permeability with porosity in the closure regions was implemented in BRAGFLO. A series of BRAGFLO simulations was performed to determine whether permeability varying with porosity in the closure regions could enhance contaminant migration to the accessible environment. Two basic scenarios were considered in the screening analysis: undisturbed performance and disturbed performance. To assess the sensitivity of system performance on dynamic permeability in the closure regions, CCDFs of normalized contaminated brine releases were constructed and compared with the corresponding baseline conditional CCDFs. The baseline model treated permeabilities in the closure regions as fixed values. Results of this analysis showed that the inclusion of dynamic closure of the waste disposal region, experimental region, and operations region in BRAGFLO resulted in computed releases to the accessible environment that are essentially equivalent to the baseline case.
A separate analysis (Park and Hansen 2003) examined the possible effects of heterogeneity in waste container and waste material strength on room closure. The analysis of room closure found that the room porosity may vary widely depending on the type of waste container and the emplacement of waste in the repository. However, analysis of a separate PA (Hansen et al. 2003) found that PA results are relatively insensitive to the uncertainty in room closure and room porosity. The conclusions of the separate PA are summarized in Section MASS-19.0 of this appendix.
The dynamic effect of halite creep and room consolidation on room porosity is modeled only in the waste disposal region. Other parts of the repository, such as the experimental region and the operations region, are modeled assuming fixed (invariant with time) properties. In these regions, the permeability is held at a fixed high value representative of unconsolidated material, while the porosity is maintained at relatively low values associated with highly consolidated material. This combination of low porosity and high permeability is assumed to conservatively overestimate flow through these regions and minimize the capacity of this material to store fluids, thus maximizing the release to the environment. To examine the acceptability of this assumption, a screening analysis (Vaughn, Lord, and MacKinnon 1995c) evaluated the effect of including closure of the experimental region and operations region. In this analysis, consolidation of the experimental region and operations region was implemented in BRAGFLO by relating pressure and time to porosity using a porosity-surface method. The porosity surface for the experimental region and operations region differs from the surface used for consolidation of the disposal room and is based on an empty excavation (see Appendix PORSURF-2014). The screening analysis showed that disregarding dynamic closure of the experimental region is acceptable because it is conservative: lower releases occur when closure of the experimental region and operations region is computed compared to simulations with time-invariant high permeability and low porosity.
Gas generation affects repository pressure, which in turn is an important parameter in other processes such as two-phase flow, creep closure, and fracturing of the interbeds and DRZ. Gas-generation processes considered in PA calculations include anoxic corrosion and microbial degradation. Radiolysis is excluded from PA calculations on the basis of laboratory experiments and a screening analysis (Vaughn et al. 1995) that concluded that radiolysis does not significantly affect repository performance.
In modeling gas generation, the effective liquid in a computational cell is the computed liquid in that cell plus an adjustment for the uncertainty associated with wicking by the waste (see Appendix PA-2014, Section PA-4.2.6
). Capillary action (wicking) is the ability of a material to carry a fluid by capillary forces above the level it would normally seek in response to gravity. Because the current gas-generation model computes substantially different gas-generation rates depending on whether the waste is wet or merely surrounded by water vapor, the physical extent of wetting could be important. A screening analysis (Vaughn, Lord, and MacKinnon 1995d) examined wicking and concluded that it should be included in PA calculations.
The baseline gas-generation model in BRAGFLO accounts for corrosion of iron and microbial degradation of cellulose and possibly plastics and rubber. The net reaction rate of these processes depends directly on brine saturation: an increase in brine saturation will increase the net reaction rate by weighting the inundated portion more heavily and the slower humid portion less heavily. To simulate the effect of wicking on the net reaction rate, an effective brine saturation, which includes a wicking saturation contribution, is used to calculate reaction rates rather than the actual brine saturation (see Appendix PA-2014, Section PA-4.2.6
).
The CRA-2014 includes a refinement to the repository water balance implementation as compared to that used in the CRA-2009 PABC. The main objective of refining the repository water balance is to include the major gas and brine producing and consuming reactions in the existing conceptual model. As described in the Chemical Conditions Conceptual Model, the major reactions in the repository include the reactions of CPR, iron, and MgO with brine (U.S. DOE 2004, sections PEER-2004
1.1.3, PEER-2004 1.1.4 and PEER-2004 1.1.5). In the CRA-2014, the same biodegradation pathways are included as were implemented in the CRA-2009 PABC, but the generation of water in these pathways is also considered. The reaction of iron hydroxide with hydrogen sulfide, which consumes gas and produces water, is also included. It is assumed that the hydrogen sulfide preferentially reacts with the iron hydroxide versus metallic iron. MgO reactions are expanded in the CRA-2014 to include MgO hydration, which consumes water and produces brucite, and the carbonation of brucite, which is assumed to form hydromagnesite. It is assumed that the carbon dioxide preferentially reacts with the brucite versus the dry MgO. Since hydromagnesite is not thermodynamically stable under repository conditions, it is assumed to dehydrate to form magnesite. As a result, the reaction of hydromagnesite to form magnesite, which produces water, is also included in the CRA-2014. All chemical reactions and species are tracked on a cell-by-cell basis. There is a finite amount of each chemical species in each cell. Once any of them are used up, that particular reaction ceases. The WIPP PA codes PREBRAG v8.02 and BRAGFLO v6.02 have been developed and qualified for this refinement to the repository water balance, and are used in the CRA-2014 PA. The reactions that comprise the refinement to the repository water balance implementation are more fully discussed in Appendix PA-2014, Section PA-4.2.5.
The gas generation model represents the possible generation of gas in the repository by corrosion of steel and microbial degradation of CPR materials. The CRA-2009 used the CRA-2004 PABC gas generation modeling assumptions, as does the CRA-2014. Additional discussion of this topic may be found in Appendix PA-2014, Section PA-4.2.5
and Appendix SCR-2014 (FEPs W44 through W48, W53, and N71) and the CRA-2004, Chapter 6.0, Section 6.4.3.3.
See the CCA, Appendix MASS, Section MASS-8.1
for historical information on the development of the CCA gas-generation conceptual model.
The modeling assumptions of chemical conditions used in the CRA-2014 are unchanged from those used in the CRA-2009 PABC. The implementation now includes the refined water budget discussed in MASS-6.3 and the variable brine volume discussed in MASS-2.6.10. The models used for chemical conditions in the repository are discussed in Appendix MgO-2014, Appendix SOTERM-2014, and Appendix PA-2014.
The dissolved actinide source term modeling assumptions used in the CRA-2009 were unchanged from those used in the CRA-2004 PABC, and remain unchanged in the CRA-2014. The models used for the dissolved actinide source term in the repository are discussed in Appendix SOTERM-2014, Section SOTERM-4.0
and Section SOTERM-5.0.
The colloidal actinide source term modeling assumptions used in the CRA-2009 were unchanged for the CRA-2014, but the model parameters are updated for the CRA-2014. The models used for the colloidal actinide source, and actinide source term updates included in the CRA-2014, are discussed in Appendix SOTERM-2014, Section SOTERM-5.0.
The shafts and shaft seals modeling assumptions used in the CRA-2009 were unchanged from those used in the CRA-2004 PABC, and remain unchanged in the CRA-2014. The models used for shafts and shaft seals are discussed in Appendix PA-2004, Attachment MASS, Section MASS-12.0.
The far-field Salado modeling assumptions used in the CRA-2009 were unchanged from those used in the CRA-2004 PABC, and remain unchanged in the CRA-2014. The purpose of this model is to reasonably represent the effects of fluid flow in the Salado on long-term performance of the disposal system. The conceptual model is also discussed in the CRA-2004, Chapter 6.0, Section 6.4.5.
Fluid flow in the Salado is considered in the conceptual model of long-term disposal system performance for several reasons. First, some liquid could move from the Salado to the repository because of the considerable gradients that can form for liquid flow inward to the repository. This possibility is important because such fluid can affect creep closure, gas generation, actinide solubility, and other processes occurring in the repository. Second, gas generated in the repository is thought to be capable of fracturing the Salado interbeds under certain conditions, creating increased permeability channels that could be pathways for lateral transport. The lateral transport pathway in intact Salado is also modeled, but it is considered unlikely to result in any significant radionuclide transport to the accessible environment boundary.
The fundamental principle in the conceptual model for fluid flow in the Salado is that it is a porous medium within which gas and brine can both be present and mobile (two-phase flow), governed by conservation of energy and mass and by Darcy's Law for their fluxes (see Appendix PA-2014, Sections PA-4.2
). Consistent with typical concepts of two-phase flow, each phase can affect the other by impeding flow because of partial saturation (relative permeability effects) and by affecting pressure by capillary forces (capillary pressure effects). It was originally assumed that no waste-generated gas is present before repository closure. However, during the EPA completeness review of the CRA-2004, the representation of the gas-generation rate was changed for the CRA-2004 PABC (Cotsworth 2005). The repository was precharged after closure to represent the short-term, but initially faster, microbial gas-generation rate (see Leigh et al. 2005, Section 2.3
). Future states are modeled as producing gas by corrosion and microbial activities. Should high pressure develop over the regulatory period, it is allowed to access MBs in the Salado.
Some variability in composition exists between different horizons of the Salado. The largest differences occur between the anhydrite-rich layers called interbeds and those dominated by halite. Within horizons dominated by halite, composition varies from nearly pure halite to halite plus several percent other minerals, in some instances including clay (see the CCA, Chapter 2.0, Section 2.1.3.4). The Salado is modeled as impure halite except for those interbeds that intersect the DRZ near the repository. This conceptual model and an alternative model that explicitly represented all stratigraphically distinct layers of the Salado near the repository (Christian-Frear and Webb 1996) produced similar results.
From other modeling and theoretical considerations, flow between the Salado and the repository is expected to occur primarily through interbeds that intersect the DRZ. Because of the large surface areas between the interbeds and surrounding halite, the interbeds serve as conduits for the flow of brine in two directions: from halite to interbeds to the repository or, for brine flowing out of the repository, from the repository into interbeds and then into halite. Because the repository is modeled as a relatively porous and permeable region, brine is considered most likely (but not constrained) to leave the repository through MB 139 below the repository because of the effect of gravity. If repository pressures become sufficiently high, gas is modeled to exit the repository via the MBs.
The effect of gravity may also be important in the Salado because of the slight and variable natural stratigraphic dip. For long-term performance modeling, the dip in the Salado within the domain is taken to be constant and 1 degree from north to south.
Fluid flow in the Salado is conceptualized as occurring either convergently into the repository or divergently from it, as discussed in detail in the CRA-2004, Chapter 6.0, Section 6.4.2.1. Because the repository is not conceptualized as homogeneous, implementing a geometry for the conceptual model of convergent or divergent flow in the Salado is somewhat complicated and is discussed in the CRA-2004, Chapter 6.0, Section 6.4.2.1.
The conceptual model for Salado fluid flow has primary interactions with three other conceptual models. The interbed fracture conceptual model allows porosity and permeability of the interbeds to increase as a function of pressure. The repository fluid flow model is directly coupled to the Salado fluid flow model by the governing equations of flow in BRAGFLO (in the governing equations of the mathematical model, they cannot be distinguished), and it differs only in the region modeled and the parameters assigned to materials. The Salado model for actinide transport is directly coupled to the conceptual model for flow in the Salado through the process of advection. Additional information on the treatment of the Salado in PA is found in Appendix PA-2014, Section PA-4.2.
An important parameter used to describe the effects of two-phase flow is threshold pressure, which helps to determine the ease with which gas can enter a liquid-saturated rock unit. For a brine-saturated rock, the threshold pressure is defined as "equal to the capillary pressure at which the relative permeability to the gas phase begins to rise from its zero value, corresponding to the incipient development of interconnected gas flow paths through the pore network" (Davies 1991, p. 9).
The threshold pressure, as well as other parameters used to describe two-phase characteristics, has not been measured for halite-rich rocks of the Salado. The Salado, however, is thought to be similar in pore structure to rocks for which threshold pressures have been measured (Davies 1991). Based on this observation, Davies (Davies 1991) postulated that the threshold pressure of the halite-rich rocks in the Salado could be estimated if an empirical correlation exists between rocks postulated to have similar pore structure.
Davies developed a correlation between threshold pressure and intrinsic permeability applicable to the Salado halites. A similar correlation was developed for Salado anhydrites; subsequent testing confirmed that the correlation predicted threshold pressures accurately. The correlation developed by Davies predicts threshold pressures in intact Salado halites on the order of 20 MPa or greater (Davies 1991). This threshold pressure predicted by correlation is much higher than that expected to persist in the repository, so that for all practical and predictive purposes, no gas will flow into intact Salado halites (see the CRA-2004, Chapter 6.0, Section 6.4.5.1).
Because threshold pressure helps control the flow of gas, and because the greatest volume of rock in the Salado is rich in halite, a high threshold pressure effectively limits the volume of gas that can be accommodated in the pore spaces of the intact host formation. Thus, high threshold pressure is considered conservative, because if gas could flow into the pore spaces of intact Salado halite, repository pressures could be reduced dramatically.
See the CCA, Appendix MASS, Section MASS-13.2
for the historical information relating to the CCA Salado conceptual model. The Salado conceptual model is unchanged for the CRA-2014 PA.
The fracture model assumptions used in the CRA-2009 were unchanged from those used in the CRA-2004 PABC, and remain unchanged in the CRA-2014. The purpose of this model is to alter the porosity and permeability of the anhydrite interbeds and the DRZ if their pressure approaches lithostatic, simulating some of the hydraulic effects of fractures with the intent that unrealistically high pressures (in excess of lithostatic) do not occur in the repository or disposal system. The conceptual model is also discussed in the CRA-2004, Chapter 6.0, Section 6.4.5.2.
In the 1992 preliminary PA, repository pressures were shown to greatly exceed lithostatic pressure if a large quantity of gas was generated. Pressures within the waste repository and surrounding regions were predicted to be roughly 20 to 25 MPa. It is expected that fracturing within the anhydrite MBs would occur at pressures slightly above lithostatic pressure, and this fracturing is implemented through a pressure-dependent compressibility.
Two parametric behaviors must be quantified in the conceptual model. First, the change of porosity with pressure in the anhydrite MBs must be specified. This is done with a relatively simple equation, described in Appendix PA-2014, Section PA-4.2.4
, that relates porosity change to pressure change using an assumption that the fracturing can be thought of as increasing the compressibility of interbeds. Parameters in the model are treated as fitting parameters and have little relation to physical behavior except that they affect the porosity change. The second parametric behavior is the change of permeability with pressure, which is incorporated by a functional dependence on the porosity change. It is assumed that a power function is appropriate for relating the magnitude of permeability increase to the magnitude of porosity increase. The parameter in this power function, an exponent, is also treated as a fitting parameter and can be set so that the behavior of permeability increase with porosity increase fits the desired behavior.
The 1-degree dip modeled in BRAGFLO may affect fracture propagation direction; however, within the accuracy of the finite difference grid, a fracture will develop radially outward. This would not account for fracture fingering or a preferential fracturing direction; however, no existing evidence supports heterogeneous anhydrite properties that would contribute to preferential fracture propagation. This evidence is discussed in the CCA, Appendix MASS, Attachment 13-2.
The maximum enhanced fracture porosity controls the storativity within the fracture. The extent of the migration of the gas front into the MB is sensitive to this storativity. The additional storativity caused by porosity enhancement will mitigate gas migration within the MB. The enhancement of permeability by MB fracturing will make the gas more mobile and will contribute to longer gas-migration distances. Thus the effects of porosity enhancement at least partially counteract the effects of permeability enhancement in affecting the gas-migration distances.
Because intact anhydrite is partially fractured, the pressure at which porosity or permeability changes are initiated is close to the initial pressure within the anhydrite. The fracture treatment within the MBs will not contribute to early brine drainage from the MB because the pressures at these times are below the fracture initiation pressure.
The input data to the interbed fracture model (see Kicker and Herrick 2013) were chosen deterministically to produce the appropriate pressure and porosity response as predicted by a linear elastic fracture mechanics model, as discussed in Mendenhall and Gerstle (Mendenhall and Gerstle 1993).
The CRA-2009 modeling assumptions for flow in the salt DRZ were unchanged from those used in the CRA-2004 PABC, and remain unchanged in the CRA-2014. The conceptual model for the DRZ around the waste disposal, operations, and experimental regions has been chosen to provide a reasonably conservative estimate of fluid flow between the repository and the intact halite and anhydrite MBs. The conceptual model is also discussed in the CRA-2004, Chapter 6.0, Section 6.4.5.3.
The conceptual model implemented in the CCA PA used values for the permeability and porosity of the salt DRZ that did not vary with time. A screening analysis examined an alternative conceptual model for the DRZ in which permeability and porosity changed dynamically in response to changes in pressure (Vaughn, Lord, and MacKinnon 1995e). This analysis implemented a fracturing model in BRAGFLO for the salt DRZ. This fracturing model is used in the existing anhydrite interbed model. In this model, formation permeability and porosity depend on brine pressure, as described by Freeze, Larsen, and Davies (Freeze, Larsen, and Davies 1995, pp. 2-16 through 2-19) and Appendix PA-2014, Section PA-4.2.4.
This model permits the representation of two important formation-alteration effects. First, pressure buildup caused by gas generation and creep closure within the waste will slightly increase porosity within the DRZ and offer additional fluid storage with lower pressures. Second, the accompanying increase in formation permeability will enhance fluid flow away from the DRZ. An increase in porosity tends to reduce outflow into the far field. As a result, parameter values for this analysis were selected so that the DRZ alteration model greatly increases permeability while only modestly increasing porosity.
Two basic scenarios were considered in the screening analysis by Vaughn, Lord, and MacKinnon (Vaughn, Lord, and MacKinnon 1995e): undisturbed repository performance and disturbed repository performance. Both scenarios included a 1-degree formation dip downward to the south. Intrusion event E1 is considered in the disturbed scenario and consists of a borehole that penetrates the repository and pressurized brine in the underlying Castile. Two variations of intrusion event E1 were examined: E1 updip and E1 downdip. In the E1 updip event, the intruded panel region was located on the north end of the waste disposal region, whereas in the E1 downdip event, the intruded panel region was located on the south end of the disposal region. These two different geometries permitted evaluation of the possibility of increased brine flow into the panel region and the potential for subsequent impacts on contaminant migration. To incorporate the effects of uncertainty in each case (E1 updip, E1 downdip, and undisturbed), a Latin hypercube sample (LHS) size of 20 was used, for a total of 60 simulations. To assess the sensitivity of system performance on formation alteration of the DRZ, conditional CCDFs of normalized contaminated brine releases were constructed and compared with the corresponding baseline model conditional CCDFs that were computed with constant DRZ permeability and porosity values. Based on comparisons between conditional CCDFs, computed releases to the accessible environment were determined to be essentially equivalent between the two treatments. Since the two configurations were determined to have essentially equivalent impacts on releases, the intrusion borehole was assumed to intrude in the down-dip or south side of the repository where it is assumed brine would more readily accumulate (see Figure MASS-3).
Preliminary PAs considered alternative conceptual models that allowed for some lateral extent of the DRZ into the halite surrounding the waste disposal region and for the development of a transition zone between anhydrites A and B and MB 138 (WIPP Performance Assessment 1993, Volume 4, Figure 4.1-2 and Figure 5.1-2; Davies, Webb, and Gorham 1992; Gorham et al. 1992). The transition zone was envisioned as a region that had experienced some hydraulic depressurization and perhaps some elastic stress relief because of the excavation, but probably no irreversible rock damage and no large permeability changes. Modeling results indicated that including the lateral extent of the DRZ had no significant effect on fluid flow. Communication vertically to MB 138 was thought to be a potentially important process, however, and the model adopted for PA assumes that the DRZ extends upward to MB 138 and permeability is sampled over the same range used in the CCA PAVT. This representation continues to be used in the CRA-2014 PA.
The actinide transport modeling assumptions used in the CRA-2009 were unchanged from those used in the CRA-2004 PABC, and remain unchanged in the CRA-2014. The purpose of this model, implemented in the code NUTS, is to represent the transport of actinides in the Salado. This model is also discussed in the CRA-2004, Chapter 6.0, Section 6.4.5.4, and Appendix PA-2014, Section PA-4.3.4.
Actinide transport in the Salado is conceptualized as occurring only by advection, or movement of material through the bulk flow of a fluid, through the porous medium described in the Salado hydrology conceptual model. Advection is a direct function of fluid flow, which is discussed in the conceptual model for Salado fluid flow. Other processes that might disperse actinides, such as diffusion, hydrodynamic dispersion, and channeling in discrete fractures, are not included in the conceptual model. Since these processes will reduce actinide transport, it is conservative to ignore these processes.
To model radionuclide transport in the Salado, NUTS takes as input BRAGFLO's velocity field, pressures, porosities, saturations, and other model parameters (including geometrical grid, residual saturation, material map, brine compressibility, and time step) averaged over a given number of time steps (20 for the CRA-2014 PA calculations). NUTS then models the transport of radionuclides within all the regions for which BRAGFLO computes brine and gas flow. The brine must pass through some part of the repository at some point during the 10,000-year regulatory period if it is to become contaminated. Radioactive constituents of the waste in the repository are assumed to dissolve into the brine while the brine is in the repository; the radionuclides are then transported by advection to other regions outside the repository. Consequently, the results of NUTS are subject to all the uncertainties associated with BRAGFLO's conceptual model and parameterization. Details of the source term, which specifies the types and amounts of radionuclides that are assumed to come into contact with the waste, are discussed in Appendix SOTERM-2014, Section SOTERM-3.0.
NUTS neglects molecular dispersion. For materials of interest in the WIPP repository system, molecular diffusion coefficients are, at most, on the order of 4 ´ 10-10 m2 per second. Thus, the simplest scaling argument using a time scale of 10,000 years leads to a molecular diffusion (that is, mixing) length scale of approximately 10 m (33 ft), which is negligible compared to the lateral advection length scale of roughly 2,400 m (7,874 ft) (the lateral distance from the repository to the accessible environment).
NUTS also neglects mechanical dispersion (see the CRA-2004, Chapter 6.0, Section 6.4.5.4.2). Dispersion is quantified by dispersivities, which are empirical tensor factors proportional to flow velocity (to within geometrical factors related to flow direction). They account for both the downstream and cross-stream spreading of local extreme values in concentration of dissolved constituents. Physically, the spreading is caused by the fact that both the particle paths and velocity histories of once-neighboring particles can be vastly different because of material heterogeneities characterized by permeability variations. These variations arise from the irregular cross-sectional areas and tortuous inhomogeneous, anisotropic connectivity between pores. Because of its velocity dependence, the transverse component of mechanical dispersivity tends to transport dissolved constituents from regions of relatively rapid flow (where mechanical dispersion has a larger effect) to regions of slower flow (where mechanical dispersion has a smaller effect). In the downstream direction, dispersivity merely spreads constituents in the flow direction. Conceptually, ignoring lateral spreading assures that dissolved constituents will remain in the rapid part of the flow field, which assures their transport toward the boundary. Similarly, ignoring longitudinal dispersivity ignores the elongation of a feature in the flow direction, which would delay the arrival of radionuclide constituents at the accessible environment. However, because the EPA release limits are time-integrated measures, the exact time of arrival is unimportant for constituents that arrive at the accessible environment, so long as arrival occurs within the assessment period (10,000 years).
NUTS conservatively disregards sorptive and other retarding effects throughout the entire flow region even though retardation must occur at some level within the repository, the MBs, and the anhydrite interbeds, and especially in zones with clay layers or clay as accessory minerals. Advection is, therefore, the only transport mechanism considered in NUTS. Because the Darcy flows are given by BRAGFLO to NUTS as input, the maximum solubility limits for combined dissolved and colloidal components are the most important NUTS parameters. These components are described in Appendix SOTERM-2014, Section SOTERM-5.0.
The modeling assumptions of the geologic units above the Salado used in the CRA-2009 were unchanged from those used in the CRA-2004 PABC, and remain unchanged in the CRA-2014. The model for geologic units above the Salado was developed to provide a reasonable and realistic basis for simulations of fluid flow within the disposal system and detailed simulations of groundwater flow and radionuclide transport in the Culebra. The conceptual model for these units is also discussed in the CRA-2004, Chapter 6.0, Section 6.4.6.
The conceptual model used in PA for the geologic units above the Salado is based on the overall concept of a groundwater basin, as introduced in the CRA-2004, Chapter 2.0, Section 2.2.1.1, and in the CCA, Appendix MASS, Section MASS-14.2.
The computer code SECOFL3D was originally used to evaluate the effect on regional-scale fluid flow by recharge and rock properties in the groundwater basin above the Salado (see the CCA, Appendix MASS, Attachment 17-2). However, simpler models for this region are implemented in codes used in PA. For example, in the BRAGFLO model, layer thicknesses, important material properties including porosity and permeability, and hydrologic properties such as pressure and initial fluid saturation are specified, but the model geometry and boundary conditions are not suited to groundwater basin modeling (nor is the BRAGFLO model used to make inferences about groundwater flow in the units above the Salado). In PA, the Culebra is the only subsurface pathway modeled for radionuclide transport above the Salado, although the groundwater basin conceptual model includes other flow interactions. The Culebra model implemented in PA includes spatial variability in hydraulic conductivity and uncertainty and variability in physical and chemical transport processes. Thus, the geometries and properties of units in the different models applied to the units above the Salado by the DOE are chosen to be consistent with the purpose of the model.
The MODFLOW-2000 and SECOTP2D codes are used directly in PA to model fluid flow and transport in the Culebra. The assumptions made in these codes are discussed in the CRA-2004, Chapter 6.0, Section 6.4.6.2, and Appendix PA-2004, Attachment MASS, Section MASS-15.0.
With respect to the units above the Salado, the BRAGFLO model is used only for determination of fluid fluxes between the shaft or intrusion borehole and hydrostratigraphic units. For this purpose, it does not need to resolve regional or local flow characteristics.
The basic stratigraphy and hydrology of the units above the Salado are described in the CRA-2004, Chapter 2.0, Section 2.1.3.5, Section 2.1.3.6, Section 2.1.3.7, Section 2.1.3.8, Section 2.1.3.9, Section 2.1.3.10 and Section 2.2.1.4. Additional supporting information is contained in the CCA, Appendices GCR, HYDRO, and SUM. Details of the conceptual model for each unit are described in the CRA-2004, Chapter 6.0, Section 6.4.6.1, Section 6.4.6.2, Section 6.4.6.3, Section 6.4.6.4, Section 6.4.6.5, Section 6.4.6.6, and Section 6.4.6.7, and additional information on units above the Salado is found in Appendix HYDRO-2014.
The representation of units above the Salado in the CRA-2009 was unchanged from that used in the CRA-2004 PABC, and remains unchanged in the CRA-2014 PA.
See the CCA, Appendix MASS, Section MASS-14.1
for historical information relating to the conceptual models for units above the Salado for the CCA. The conceptual models for the units above the Salado are unchanged for CRA-2014 PA.
The groundwater-basin conceptual model and associated modeling assumptions used in the CRA-2009 were unchanged from those used in the CRA-2004 PABC, and remain unchanged in the CRA-2014. For a discussion on the groundwater-basin conceptual model, see the CCA, Appendix MASS, Section MASS-14.2.
The Culebra flow modeling assumptions used in the CRA-2009 were unchanged from those used in the CRA-2004 PABC, and remain unchanged in the CRA-2014. The conceptual model for groundwater flow in the Culebra (1) provides a reasonable and realistic basis for simulating radionuclide transport in the Culebra, and (2) allows evaluation of the extent to which uncertainty about groundwater flow in the Culebra may contribute to uncertainty in the estimate of cumulative radionuclide releases from the disposal system. See the CRA-2004, Chapter 6.0, Section 6.4.6.2 for additional references to other relevant discussions on this conceptual model.
The conceptual model used in PA for groundwater flow in the Culebra treats the Culebra as a confined two-dimensional aquifer with constant thickness and spatially varying transmissivity (see the CCA, Appendix MASS, Attachment 15-7). Flow is modeled as single-phase (liquid) Darcy flow in a porous medium.
Basic stratigraphy and hydrology of the units above the Salado are described in the CRA-2004, Chapter 2.0, Section 2.1 and Section 2.2. Additional supporting information is contained in the CCA, Appendices GCR, HYDRO, and SUM.
The conceptual model for flow in the Culebra is discussed in the CRA-2004, Chapter 6.0, Section 6.4.6.2. Details of the calibration of the T fields, based on available field data, are given in Appendix TFIELD-2014. Initial and boundary conditions used in the model are given in the CRA-2004, Chapter 6.0, Section 6.4.10.2. A discussion of the adequacy of the two-dimensional assumption for PA calculations is included in the CCA, Appendix MASS, Attachment 15-7.
The principal parameter used in PA to characterize flow in the Culebra is an index parameter (the transmissivity index) used to select a single T field for each LHS element from a set of calibrated fields (see Kicker and Herrick 2013, Table 1), each of which is consistent with available data.
See Appendix PA-2004, Attachment MASS, Section MASS-15.1
for historical information relating to the Culebra conceptual model. The conceptual model for this unit is unchanged for the CRA-2014.
The purpose of this model is to represent the effects of advective transport and physical and chemical retardation on the movement of actinides in the Culebra. This conceptual model is also discussed in the CRA-2004, Chapter 6.0, Section 6.4.6.2.1. The same model is used in the CRA-2004 PABC and the CRA-2014 PA. For a historical presentation of this model, see Appendix PA-2004, Attachment MASS, Section MASS-15.2.
The purpose of this model is to represent the effects of colloidal actinide transport in the Culebra. This model is also discussed in the CRA-2004, Chapter 6.0, Section 6.4.6.2.2 and Appendix PA-2004, Attachment MASS, Attachments 15-2, 15-8, and 15-9. No changes have been made to this model since the CRA-2004. Additional information and historical information on colloidal actinide transport and retardation in the Culebra can be found in Appendix PA-2004, Attachment MASS, Section MASS-15.3.
The mining-related modeling assumptions used in the CRA-2009 were unchanged from those used in the CRA-2004 PABC, and remain unchanged in the CRA-2014. This model incorporates the effects of potash mining in the McNutt Potash Zone on disposal system performance (see Appendix SCR-2014, FEP H13, FEP H37, and FEP H38). Provisions in Part 194 provide a conceptual model and elements of a mathematical model for these effects. The DOE has implemented the EPA conceptual model (40 CFR § 194.32(b), U.S. EPA 1996) to be consistent with EPA criteria and guidance; this model is described in the CRA-2004, Chapter 6.0, Section 6.4.6.2.3. Additional information on the implementation of the mining subsidence model is available in Appendix TFIELD-2014; the CCA, Appendix MASS, Attachments 15-4 and 15-7; and Wallace (Wallace 1996).
The principal parameter in this model is the range assigned to a factor by which hydraulic conductivity in the Culebra is increased (see the CCA, Appendix MASS, Attachment 15-4). As allowed in supplementary information to Part 194, it is the only parameter changed to account for the effects of mining.
Mining has been included in scenario development for the WIPP since the earliest work on this topic (U.S. DOE 1980 [pp. 9-145 through 9-148]; Hunter 1989; Marietta et al. 1989; Guzowski 1990; Tierney 1991; WIPP Performance Assessment 1991). These early scenario developments considered both solution and room-and-pillar mining. The focus was generally on effects of mining outside the disposal system. In the CCA FEPs screening, solution mining was screened out during scenario development (see Appendix SCR-2014, FEP H58 and FEP H59). The two primary effects of mining considered were (1) changes in the hydraulic conductivity of the Culebra or other units, and (2) changes in recharge as a result of surface subsidence. These mining effects were not formally incorporated into quantitative assessment of repository performance in preliminary PAs.
The inclusion of mining in PA satisfies the requirements of section 194.32(b) to consider the effects of this activity on the disposal system.
The intrusion borehole modeling assumptions used in the CRA-2009 were unchanged from those used in the CRA-2004 PABC, and remain unchanged in the CRA-2014. The inclusion of intrusion boreholes in PA adds to the number of release pathways for radionuclides from the disposal system. Direct releases to the surface may occur during drilling as particulate material from cuttings, cavings, and spallings are carried to the surface. Also, dissolved actinides may be carried to the surface in brine during drilling. Once abandoned, the borehole presents a possible long-term pathway for fluid flow, such as might occur between a hypothetical Castile brine reservoir, the repository, and overlying units. This topic is also addressed in the CRA-2004, Chapter 6.0, Section 6.4.7, and Appendix SCR-2014 (FEP H1 and FEP H21).
The cuttings, cavings, and spallings models estimate the quantity of actinides released as solids directly to the surface during drilling through the repository. The releases are caused by three mechanisms: the drill bit boring through the waste (cuttings); the drilling fluid eroding the walls of the borehole (cavings); and high repository gas pressure causing solid material failure and entrainment into the drilling fluid in the wellbore (spallings). See the CRA-2004, Chapter 6.0, Section 6.4.7.1, and references to other appendices cited in that section for additional information. Stochastic uncertainty in parameters relevant to these release mechanisms is addressed in the CRA-2004, Chapter 6.0, Section 6.4.12. The conceptual model for cuttings, cavings, and spallings is discussed in three parts because of the different processes that produce the three types of releases.
Cuttings are materials removed to the surface through drilling mud by the direct mechanical action of the drill bit. The volume of waste removed to the surface is a function of the repository height and the drill bit area. The principal parameter in the cuttings model is the diameter of the drill bit (see Attachment PAR-2014).
Cavings are materials introduced into the drilling mud by the erosive action of circulating drilling fluid on the waste in the walls of the borehole annulus. Erosion is driven solely by the shearing action of the drilling fluid (or mud) as it moves up the borehole annulus. Shearing may be caused by either laminar or turbulent flow. The principal parameters in the cavings model are the properties of the drilling mud, drilling rates, the drill string angular velocity, and the shear resistance of the waste (see MASS-15.1.2). (See Kicker and Herrick 2013 for details on the sampled parameters used in the cavings model, the drill string angular velocity, and the effective shear resistance to erosion.)
Spallings are solids introduced into the wellbore by the fluid pressure difference between the repository and the bottom of the wellbore. If the repository pressure is sufficiently high (more than about 12 MPa) relative to the well bottom hole pressure (about 8 MPa), the stress state in the repository may cause repository solids to fail in the vicinity of the wellbore. In turn, these solids may become entrained in the gas flowing toward the well, ultimately to be carried up to the land surface and constituting a release. The principal parameters in the spallings model are the gas pressure in the repository when it is penetrated and properties of the waste such as permeability, tensile strength, and particle diameter. Because the release associated with spalling is sensitive to gas pressure in the repository, it is strongly coupled to the BRAGFLO-calculated conditions in the repository at the time of penetration.
Cuttings and cavings releases are straightforward. The analytical equations governing erosion (cavings) based on laminar and turbulent flow (Appendix PA-2014, Section PA-4.5
) have been implemented in the code CUTTINGS_S. Using selected input based on assumed physical properties of the waste and other drilling parameters, this code calculates the final caved diameter of the borehole that intersects the waste.
The various approaches used for spallings up to the CCA PA are documented in the CCA, Appendix MASS, Section MASS-16.1.1.
Since the CCA PA, the spallings model has been extensively revised and has changed fundamentally from an end-state erosional model to a mechanically based, coupled material failure and transport model (WIPP Performance Assessment 2003a). This model is implemented in the code DRSPALL. A discussion tracing the historical steps from the CCA erosional model to the current DRSPALL model can be found in Appendix PA-2004, Attachment MASS, Section MASS-16.1.1.
Waste mechanical properties used in the CRA-2014 are updated from those used in the CRA-2009. For intrusion events considered in WIPP PA, drilling mud flowing up the borehole will apply a hydrodynamic shear stress on the borehole wall. Erosion of the wall material can occur if this stress is high enough, resulting in a release of radionuclides being carried up the borehole with the drilling mud. In this intrusion event, the drill bit would penetrate repository waste, and the drilling mud would flow up the borehole in a predominately vertical direction. In order to experimentally simulate these conditions, a flume was designed and constructed. In the flume experimental apparatus, eroding fluid enters a vertical channel from the bottom and flows past a specimen of surrogate WIPP waste. Experiments were conducted to determine the erosive impact on surrogate waste materials that were developed to represent WIPP waste that is 50%, 75%, and 100% degraded by weight. A description of the vertical flume, the experiments conducted in it, and conclusions to be drawn from those experiments are discussed in Herrick et al. (Herrick et al. 2012).
The WIPP PA uses the parameter BOREHOLE:TAUFAIL to represent the hydrodynamic shear strength of the waste in the numerical code CUTTINGS_S (see Appendix PA-2014, Section PA-4.5
). It is officially called the "effective shear strength for erosion," but it is more commonly known as the "waste shear strength." Based on experimental results that realistically simulate the effect of a drilling intrusion on an accepted surrogate waste material, as well as analyses of existing data (see Herrick 2013), parameter BOREHOLE:TAUFAIL is updated in the CRA-2014 PA. Values specified for parameter BOREHOLE:TAUFAIL in the CRA-2014 PA are obtained by sampling a uniform distribution with a range of 2.22 Pa to 77 Pa.
The CRA-2014 PA uses the same spallings model that was used in the CRA-2009 PABC and the CRA-2004 PABC. No changes were made to the model or implementation of the results in PA.
In the CRA-2004 PA, a new approach to modeling the WIPP spallings process was developed to address peer review concerns during the original certification process (see the CCA, Chapter 9.0, Section 9.3.1.2 and Appendix PEER-2004, Section PEER-2004
3.0). Instead of focusing on the end state after penetration, as was done in the original CCA erosional model, the new model sought to capture the system behavior from just before penetration through to the end state. In doing so, many more phenomena were included in the model. Considered in this new conceptual model was unsteady, convergent gas flow from the repository toward the wellbore that caused mechanical stress and potential failure of solids near the face of the wellbore. Pressure in the cavity at the point of penetration was balanced by the mud column in the wellbore and the repository pressure.
The new spall model, DRSPALL (WIPP Performance Assessment 2003a), is based on a predecessor code called GASOUT (Hansen et al. 1997, Appendix C). DRSPALL builds upon GASOUT by:
1. Adding a wellbore flow model that transports mud, repository gas, and waste solids from repository level to the land surface
2. Adding a fluidized bed model that evaluates the potential for failed particulate waste to fluidize and become entrained in the wellbore flow
The wellbore flow model in DRSPALL utilizes one-dimensional geometry with a compressible, viscous, isothermal, homogeneous mixture of mud, gas, and solids. Standard mass and momentum balance, friction loss, and slurry viscosity equations are used. Wellbore flow model results were successfully verified against those from an independent commercial code for several test problems (WIPP Performance Assessment 2003b).
DRSPALL applies the fluidized bed theory to determine the mobilization of failed material to the flow stream in the wellbore. If the escaping gas velocity exceeds the minimum fluidization velocity, failed material is fluidized and entrained for transport at the land surface. If gas velocity is too low to fluidize the bedded material, the cavity size is allowed to stabilize. The spall volumes predicted by DRSPALL are based on the following conservative assumptions for material properties and for the flow geometry within the repository:
·
The particle size distribution for spallings is based on a detailed analysis (Wang 1997) of data from an expert elicitation (Carlsbad Area Office Technical Assistance Contractor [CTAC] 1997). This analysis considered several limiting cases in developing a conservative distribution for mean particle size ranging from 1 millimeter to 10 cm (Hansen, Pfeifle, and Lord 2003).
·
The shape factor for fluidization of particles has a potential range from 0 to 1.0. Smaller values of the shape factor denote particles that are less spherical, and therefore more easily fluidized and transported in the flow. The shape factor is conservatively set to a value of 0.1 (Lord 2003).
·
The tensile strength of the waste assigned for the spalling process is uncertain, ranging from 0.12 MPa to 0.17 MPa (Hansen, Pfeifle, and Lord 2003). Tensile strength data were measured in laboratory experiments on surrogate materials chosen to conservatively represent highly degraded residuals from typical wastes. The given range is felt to represent extreme, low-end tensile strengths because it does not account for several strengthening mechanisms, such as MgO hydration and halite precipitation/cementation (Hansen et al. 1997).
·
DRSPALL uses a hemispherical geometry (one-dimensional spherical symmetry) for the flow field and cavity in the waste. This conceptual model is appropriate when the drill bit first penetrates the repository. But, as the drill bit passes completely through the compacted waste, the flow field transitions toward a cylindrically symmetric geometry. This transition is important because the largest spall release volumes are predicted to occur at late times, well after the drill bit has penetrated through the waste, and because the spall volumes predicted for a cylindrical geometry are less than for the hemispherical geometry (Lord, Rudeen, and Hansen 2003).
In summary, the conservative assumptions for waste properties, the waste flow geometry, and the driller's actions provide very conservative spalling release volumes (see also Appendix PA-2014, Section PA-4.6
for a description of the spallings model, and Appendix PEER-2004, Section PEER-2004
3.0 for the results of the spallings model peer review). As stated previously, the DRSPALL calculations from the CRA-2004 PABC were also used in the CRA-2014 PA (see Appendix PA-2014, Section PA-6.7.4
and Section PA-8.5.2).
The modeling assumptions relating to the calculations of cuttings, cavings and spallings releases have not changed since the CRA-2004. As detailed in Appendix PA-2014, Section PA-6.7.5
, cuttings and cavings releases for intrusions into CH-TRU waste are computed by multiplying the volume released (calculated by the code CUTTINGS_S) by the radioactivity in three independently selected waste streams, consistent with the conceptual assumption that waste streams are randomly emplaced in waste stacks that are three drums high. The effect of this assumption on PA results was examined in a separate PA (Hansen et al. 2003) in which cuttings and cavings releases were computed by assuming that each intrusion encounters only a single waste stream. The differences in repository performance (determined by comparing the mean CCDFs for releases) were determined to be minor. For more details on the analysis, see Appendix PA-2004, Attachment MASS, Section MASS-21.0.
Because spallings may release a relatively large volume of material (exceeding 4 m3), spalling releases for intrusions into CH-TRU waste are computed by multiplying the volume of spalled material with the average concentration of radioactivity in the waste at the time of the intrusion. A separate PA (Hansen et al. 2003) compared spalling releases computed using the average concentration of radioactivity in the waste to spalling releases computed using the radioactivity of a single, randomly selected waste stream. The analysis determined that the assumption had only a minor effect on the mean CCDF for releases. For more details on the analysis, see Appendix PA-2004, Attachment MASS, Section MASS-21.0.
During their completeness review of the CRA-2004, the EPA requested additional DRSPALL vectors be used in the CRA-2004 PABC. Minor changes were made to the implementation of spallings results that did not change the overall modeling assumptions. These implementation changes are outlined in Leigh et al. (Leigh et al. 2005, Section 7.8
).
The DBR modeling assumptions used in the CRA-2009 were unchanged from those used in the CRA-2004 PABC, and remain unchanged in the CRA-2014. This model provides a series of calculations to estimate the quantity of brine released directly to the surface during drilling. DBRs may occur when a driller penetrates the WIPP and unknowingly brings contaminated brine to the surface during drilling (these releases are not accounted for in the cuttings, cavings, and spallings calculations, which model only the solids removed during drilling). Appendix PA-2014, Section PA-4.7
, describes the DBR model used for the CRA-2014 PA. The CCA, Appendix MASS, Attachment 16-2 describes the DBR model used for the CCA PA. The conceptual model for DBRs is discussed in Appendix PA-2014, Section PA-4.7
, and the CRA-2004, Chapter 6.0, Section 6.4.7.1.1.
Uncertainty in the BRAGFLO DBR calculations is captured in the 10,000-year BRAGFLO calculations from which the initial and boundary conditions are derived. The model parameters that have the most influence on DBRs are repository pressure and brine saturation at the time of intrusion. Brine saturation is influenced by many factors, including Salado and MB permeability and gas-generation rates (for undisturbed scenario calculations). For E1 and E2 intrusion scenarios, Castile brine-reservoir pressure and volume, and abandoned borehole permeabilities influence conditions for the second and subsequent intrusions. The dip in the repository (hence the location of intrusions), two-phase flow parameters (residual brine and gas saturation), time of intrusion, and duration of flow have lesser impacts on brine releases.
The implementation of the DBR model is slightly adjusted in the CRA-2014 PA to incorporate the ROMPCS. The Option D panel closure modeled in the CRA-2009 PABC is 40 m long whereas the ROMPCS modeled in the CRA-2014 PA is 30.48 m (100 ft) long. As a result, grid cell lengths corresponding to panel closures are reduced to 30.48 m in the CRA-2014 PA. In addition, the ROMPCS, which is modeled as run-of-mine salt in the CRA-2014 PA, has no concrete component that is "keyed in" to the surrounding DRZ. As a result, material elements corresponding to equivalent DRZ/concrete in the CRA-2009 PABC are replaced by DRZ in the CRA-2014 PA. Figure MASS-12 shows the DBR grid and material map used in the CRA-2014 PA.
(Note that the color scheme in
Figure MASS-12 is chosen to match the color scheme of the CRA-2014 BRAGFLO grid and material maps shown in Figure MASS-7 to Figure MASS-11.) Figure MASS-8 of Appendix MASS-2009 shows the DBR grid and material map used in the CRA-2009 PA and PABC.
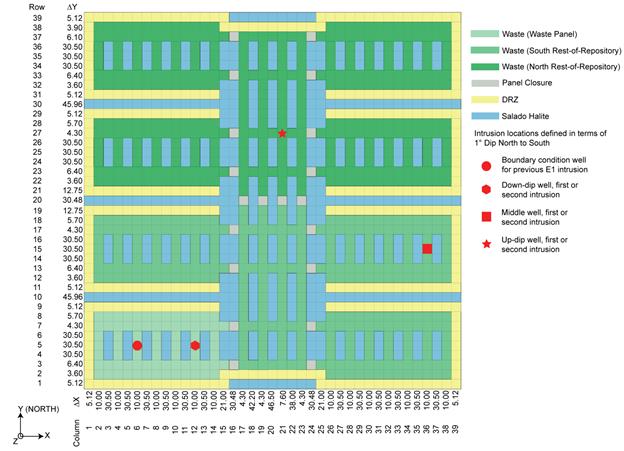
Figure MASS-
12. Repository-Scale Horizontal BRAGFLO Mesh Used for DBR Calculations
The CRA-2009 PA used a DBR maximum duration of 4.5 days, based on current drilling practices (see Kirkes 2007 and Appendix PA-2014, Section PA-4.7.8
). This value is also used in the CRA-2014 PA.
The long-term treatment and assumptions used to represent boreholes in the CRA-2009 PA were unchanged from those used in the CRA-2004 PABC, and remain unchanged in the CRA-2014. See Appendix PA-2004, Attachment MASS, Section MASS-16.3
, and CRA-2014, Section 33
, for the borehole modeling assumptions used in the CRA-2014 PA.
The purpose of this model is to allow quantitative consideration of the extent to which uncertainty about future climate may contribute to uncertainty in estimates of cumulative radionuclide releases from the disposal system. This model has not changed since the CCA and is used in the CRA-2014 PA. Consideration is limited to conditions that could result from reasonably possible natural climatic changes. The model is not intended to provide a quantitative prediction of future climate, nor is it intended to address uncertainty in system properties other than estimated cumulative radionuclide releases that may be affected by climate change. See Appendix PA-2004, Attachment MASS, Section MASS-17.0
, and Section MASS-17.1 for current and historical information on the climate change model. The implementation of this
model in PA is also discussed in the CRA-2004, Chapter 6.0, Section 6.4.9 and Appendix PA-2004, Section PA-2.1.4.6.
See also the CCA, Appendix CLI for information on expected climate variability over the 10,000-year regulatory time period.
The conceptual model for the hypothetical brine reservoir is included in PA to estimate the extent to which uncertainty about the existence of a brine reservoir under the waste disposal region may contribute to uncertainty in the estimate of cumulative radionuclide releases from the disposal system. The conceptual model is not intended to provide a realistic approximation of an actual brine reservoir under the waste disposal region. Data are insufficient to determine whether such a brine reservoir exists.
The representation of the Castile brine reservoir in BRAGFLO in the CRA-2014 PA has not changed from the CRA-2004 PA. However, this model is not the same as the one used in the original CCA PA. The following describes the changes to the model since the 1996 CCA PA.
The Castile Formation is treated as an impermeable unit in PA and plays no role in the analysis except to separate the Salado from the modeled brine reservoir in the BRAGFLO grid. In human-intrusion scenarios, the hypothetical brine reservoir can be penetrated by an intrusion borehole connecting it to the repository. The amount of brine that can enter the repository from the brine reservoir is important to PA because brine is required for gas-generation reactions and can transport radionuclides in solution, contributing to potential releases.
The properties of the hypothetical brine reservoir defined for PA include permeability, porosity, pore volume, initial pressure, and various two-phase flow parameters. Values assigned for these properties were chosen to either be consistent with the available data from and analyses of borehole penetrations of brine reservoirs in the region, or provide a reasonable response in the BRAGFLO model.
The treatment of the brine reservoir for the CRA-2004 PA was different than that used in the CCA PA. The major changes to the brine reservoir representation were made by the EPA in the CCA PAVT (U.S. EPA 1998b). For the CCA PAVT, the EPA defined new parameter ranges for bulk compressibility and total pore volume. The range of bulk compressibility was based on a reevaluation of field test data from the WIPP-12 borehole following the CCA (Beauheim 1997). Since the total volume of the grid cells used to represent the brine reservoir in BRAGFLO is fixed, the range of total pore volume was set by defining a range of "effective" porosity (pore volume = grid volume × effective porosity). This range of porosity values is not representative of the actual host rock. It was chosen to produce a reasonable response in the BRAGFLO model by providing a predefined range of total pore volumes based on the field tests at WIPP-12.
For the CRA-2004 PA, the DOE implemented this approach by assuming that the productivity ratio (PR) remains constant (2.0051 × 10⁻³ m3/Pa). The PR is defined as:
 ,
,
where V is the grid volume of the brine reservoir (18,462,514 m3),
C
r
is the bulk compressibility (2 × 10-11 to 1 × 10⁻¹⁰ Pa-1), and
f
is the effective porosity (0.1842 to 0.9208). To maintain a constant pore volume in the brine reservoir, the porosity range used in the CRA-2004 PA is slightly modified from that used in the CCA PAVT because the fixed-grid volume increased slightly in the CRA-2004 BRAGFLO grid from the volume assumed in the CCA BRAGFLO grid. In this approach, bulk compressibility and effective porosity are directly proportional (Stein 2003). See Appendix PA-2014, Section PA-4.2.10
for the details on the implementation in PA.
Basic geologic information about the Castile is given in the CRA-2004, Chapter 2.0, Section 2.1.3.3. The hydrology of the known brine reservoirs is discussed in the CRA-2004, Chapter 2.0, Section 2.2.1.2.2. The treatment of the hypothetical brine reservoir in PA is discussed in the CRA-2004, Chapter 6.0, Section 6.4.8.
See the CCA, Appendix MASS, Attachment 18.1 for historical information on the Castile brine reservoir model.
One of the changes to the repository design since the CCA is the raising of the repository horizon in the southern half of the waste panels. Specifically, Panels 3, 4, 5, and 6, have been excavated at an elevation approximately 2.4 m above the level of Panels 1, 2, 7, and the operations and experimental areas. This change in horizon has brought the roof of the raised rooms to the level of the Clay Seam G. The change has improved roof conditions and enhanced operations and mine safety. The DOE submitted a planned change request to the EPA describing the change and argued that it would have minimal impact on long-term repository performance (Triay 2000). The EPA responded to the change request in a letter (Marcinowski 2000) in which it agreed with the DOE that the effects on long-term performance would be minimal. The modeling assumptions used to represent this change are described in Appendix PA-2004, Attachment MASS, Section MASS-20.0.
No changes were made to these assumptions since the CRA-2004 PA. These assumptions have also been used in the CRA-2014 PA.
During the development of the CCA PA, the DOE chose to assume random placement of TRU waste in the WIPP, and developed conceptual and numerical models accordingly. The EPA reviewed these models and their results and determined that the DOE had adequately modeled random placement of waste in the disposal system. The CCA PA also assumed that all waste could be modeled as if the waste was emplaced in 55-gallon drums. In accordance with the requirements of 40 CFR § 194.24(d) (U.S. EPA 2004), all PAs have assumed that waste is emplaced in a random or homogeneous manner. The PAs executed in support of compliance applications have not specifically accounted for heterogeneity in waste materials or in waste containers.
Additional information about the waste and its emplacement has emerged since the CCA. Waste has been emplaced using several different types of waste containers, including standard waste boxes and pipe overpacks. Waste types, such as supercompacted waste, have been emplaced that were not considered in the CCA inventory (U.S. DOE 2002). At the Idaho National Laboratory, for instance, debris waste is volume-reduced by supercompaction, resulting in a very dense waste form containing a high concentration of CPR material. In addition, the plutonium residues from the Rocky Flats Environmental Technology Site were packaged in pipe overpacks, which are more rigid than the typical 55-gallon drum assumed in the CCA. Actual waste emplacement is determined by the availability of waste at generator sites and the shipping schedules. Pipe overpacks occupy about 43% of the containers emplaced in Panel 1, suggesting that actual emplacement will not be statistically random. As a result of this information, the DOE performed analyses (Hansen et al. 2003) to determine if the waste emplacement assumptions used in PA adequately represent the waste. The analysis, reported in Hansen et al. (Hansen et al. 2003), focused on potential effects of supercompacted waste and waste in pipe overpacks on repository performance. Both waste types are structurally stiffer than the generic waste model used in the CCA PA, and the supercompacted waste in particular has high concentrations of CPR materials. The analysis began with a systematic reevaluation of the baseline FEPs to identify specific components of PA that could be affected by supercompacted waste. The reassessment concluded that the FEPs "screened in" were adequate to represent the variety of waste types and containers, and that none of the "screened out" FEPs should be reconsidered for implementation. The FEP assessment concluded that the following could be affected by heterogeneities in the waste materials and waste containers:
·
creep closure of the repository
·
chemical conditions of the waste
·
gas generation models
·
waste mechanical properties
Analysis of creep closure of waste-filled rooms, accounting for several types of waste materials and packaging, indicated that a wider range of long-term porosities could occur than that established in the CCA, given the uncertainties about the structural integrity of waste packages and their spatial arrangement in the repository (Park and Hansen 2003). For this reason, the analysis in Hansen et al. (Hansen et al. 2003) treated creep closure as an uncertain variable. Sensitivity analysis showed that this additional uncertainty did not significantly affect the results of PA.
Chemical conditions were also reexamined under a range of possible waste arrangements. The assessment found that, regardless of actual waste emplacement, the MgO would still be sufficient to maintain desired chemical conditions if distributed appropriately with the current excess factor. Moreover, the constituents of supercompacted waste would not alter the reactions that determine chemical equilibrium and, consequently, no changes to actinide solubilities or to the gas-generation models were warranted to account for waste heterogeneity. This topic was also addressed during the first recertification in response to comment G-12, in which the EPA requested that the DOE address potential effects of heterogeneous waste loading based on the assumption of homogeneous chemical conditions. The DOE's response indicated that the chemical conditions assumptions adequately addressed nonrandom waste loading (Piper 2004). This was again addressed during the evaluation of the MgO excess factor change from 1.67 to 1.20 (Reyes 2008). No changes were made to the chemical conditions model as a result of these investigations.
Supercompacted waste contains elevated amounts of CPR materials relative to other waste streams, and these materials generate gas when they comingle with brine and undergo microbial degradation. The future arrangement of supercompacted waste in the WIPP repository is uncertain. Sensitivity analysis has demonstrated that uncertainty in the spatial distribution and quantity of CPR materials has little effect on PA results. This was shown in an analysis performed during the 2004 recertification while responding to an EPA request for additional information (Response to Comment G-12, Dunagan, Hansen, and Zelinski 2004).
DBRs as a consequence of a drilling intrusion are calculated with the assumption of random waste emplacement in the repository. In addition, releases by spallings, DBR, and long-term radionuclide transport assume that radionuclides are homogeneously distributed throughout the waste. A sensitivity analysis determined that PA results are not greatly affected by the assumption of random waste emplacement or by the assumption that radionuclides are homogeneously distributed (Hansen et al. 2003). The representation of the waste properties was also considered; however, it was determined that no changes to permeability, shear strength, or tensile strength were warranted.
Based on the analysis reported in Hansen et al. (Hansen et al. 2003), the DOE concluded that:
1. Explicit representation of the specific features of supercompacted waste and of waste in pipe overpacks, such as structural rigidity, was not warranted in modeling, since PA results were primarily insensitive to the effects of such features.
2. PA results were not affected significantly by the assumption of nonrandom waste emplacement and the representation of these waste types as a homogeneous material.
Homogeneity issues were also addressed in response to another EPA comment during the CRA-2004 completeness review. The EPA questioned in comment C-23-10 whether neglecting container-scale variability was a valid assumption for spallings calculations (Cotsworth 2004). In the CRA-2004 PA, spallings releases were calculated using the average radioactivity in all CH-TRU waste streams. An analysis in Vugrin (Vugrin 2004) compared spallings results using three randomly sampled waste streams against results using the average radioactivity over all CH-TRU waste streams. The analysis concluded that the calculation of spallings releases is not significantly affected by waste-scale variability.
The DOE continues to assume in PA that waste is randomly emplaced in the WIPP repository. The CRA-2014 PA continues to use the same waste-related modeling approaches as were used in the CRA-2009 and the CRA-2004 PABC.
(*Indicates a reference that has not been previously submitted.)
Amyx, J.W., D.M. Bass, Jr., and R.L. Whiting. 1960. Petroleum Reservoir Engineering, Physical Properties. New York: McGraw. [Author]
Anderson, M.P., and W.W. Woessner. 1992. Applied Groundwater Modeling: Simulation of Flow and Advective Transport. New York: Academic Press. [Author]
Bear, J. 1972. Dynamics of Fluid in Porous Media. New York: Elsevier. [Author]
Beauheim, R.L. 1997. Memorandum to Palmer Vaughn (Subject: Revisions to Castile Brine Reservoir Parameter Packages). 16 January 1997. ERMS 244699. Albuquerque, NM: Sandia National Laboratories. [PDF / Author]
Brush, L., and P. Domski. 2013a. Th(IV), Np(V), and Am(III) Baseline Solubilities and Th(IV) and Am(III) Solubility Uncertainties for the CRA-2014 PA. ERMS 559279. Carlsbad, NM: Sandia National Laboratories.* [PDF / Author]
Brush, L., and P. Domski. 2013b. Uncertainty Analysis of Actinide Solubilities for the WIPP CRA-2014 PA, Rev. 1. ERMS 559712. Carlsbad, NM: Sandia National Laboratories.* [PDF / Author]
Camphouse, R.C. 2012. User's Manual for BRAGFLO, Version 6.02. ERMS 558663. Carlsbad, NM: Sandia National Laboratories.* [PDF / Author]
Camphouse, R.C. 2013. Analysis Plan for the 2014 WIPP Compliance Recertification Application Performance Assessment. ERMS 559198. Carlsbad, NM: Sandia National Laboratories.* [PDF / Author]
Camphouse, R.C., D.C. Kicker, T.B. Kirchner, J.J. Long, and J.J. Pasch. 2011. Impact Assessment of SDI Excavation on Long-Term WIPP Performance. ERMS 555824. Carlsbad, NM: Sandia National Laboratories.* [PDF / Author]
Camphouse, R.C., D.C. Kicker, T.B. Kirchner, J.J. Long, B. Malama, and T.R. Zeitler. 2012. Summary Report and Run Control for the 2012 WIPP Panel Closure System Performance Assessment. ERMS 558365. Carlsbad, NM: Sandia National Laboratories.* [PDF / Author]
Caporuscio, F., J. Gibbons, C. Li, and E. Oswald. 2003. Salado Flow Conceptual Models Final Peer Review Report (March). ERMS 526879. Carlsbad, NM: Carlsbad Area Office. [PDF / Author]
Carlsbad Area Office Technical Assistance Contractor (CTAC). 1997. Expert Elicitation on WIPP Waste Particle Diameter Size Distribution(s) During the 10,000-Year Regulatory Post-Closure Period (Final Report, June 3). ERMS 541365. Carlsbad, NM: U.S. Department of Energy. [PDF / Author]
Christian-Frear, T.L., and S.W. Webb. 1996. The Effect of Explicit Representation of the Stratigraphy on Brine and Gas Flow at the Waste Isolation Pilot Plant. SAND94-3173. WPO 37240. Albuquerque, NM: Sandia National Laboratories. [PDF / Author]
Clayton, D.J. 2009a. Analysis Plan for the CRA-2009 Performance Assessment Baseline Calculation. ERMS 551603. Carlsbad, NM: Sandia National Laboratories.* [PDF / Author]
Clayton, D.J. 2009b. Update to Kd Values for the PABC-2009. ERMS 552395. Carlsbad, NM: Sandia National Laboratories.* [PDF / Author]
Clayton, D.J. 2013. Justification of Chemistry Parameters for Use in BRAGFLO for AP-164, Revision 1. ERMS 559466. Carlsbad, NM: Sandia National Laboratories.* [PDF / Author]
Clayton, D.J., S. Dunagan, J.W. Garner, A.E. Ismail, T.B. Kirchner, G.R. Kirkes, M.B. Nemer. 2008. ERMS 548862. Summary Report of the 2009 Compliance Recertification Application Performance Assessment. ERMS 548862. Carlsbad, NM: Sandia National Laboratories.* [PDF / Author]
Clayton, D.J., R.C. Camphouse, J.W. Garner, A.E. Ismail, T.B. Kirchner, K.L. Kuhlman, M.B. Nemer. 2010. Summary Report of the CRA-2009 Performance Assessment Baseline Calculation. ERMS 553039. Carlsbad, NM: Sandia National Laboratories.* [PDF / Author]
Cotsworth, E. 2004. Letter to R.P. Detwiler (1 Enclosure). 20 May 2004. ERMS 535554. Washington, DC: U.S. Environmental Protection Agency, Office of Air and Radiation. [PDF / Author]
Cotsworth, E. 2005. Letter to I. Triay (1 Enclosure). 4 March 2005. ERMS 538858. Washington, DC: U.S. Environmental Protection Agency, Office of Air and Radiation. [PDF / Author]
Cotsworth, E. 2009. Letter to D. Moody (Subject: EPA CRA-2009 First Set of Completeness Comments). 21 May 2009. ERMS 551444. Washington, DC: U.S. Environmental Protection Agency, Office of Air and Radiation.* [PDF / Author]
Davies, P.B. 1991. Evaluation of the Role of Threshold Pressure in Controlling Flow of Waste-Generated Gas into Bedded Salt at the Waste Isolation Pilot Plant. SAND90-3246. WPO 26169. Albuquerque, NM: Sandia National Laboratories. [PDF / Author]
Davies, P.B., S.W. Webb, and E.D. Gorham. 1992. Memorandum to B.M. Butcher, J. Schreiber, and P. Vaughn (Subject: Feedback on "PA Modeling Using BRAGFLO -- 1992" 7-8-92 memo by J. Schreiber; 4 Attachments). 14 July 1992. Albuquerque, NM: Sandia National Laboratories. [PDF / Author]
Dunagan, S., C. Hansen, and W. Zelinski. 2004. Effects of Increasing Cellulosics, Plastics and Rubbers on WIPP Performance Assessment. ERMS 535941. Carlsbad, NM: Sandia National Laboratories. [PDF / Author]
Fox, B., D.J. Clayton, T.B. Kirchner. 2009. Radionuclide Inventory Screening Analysis Report for the PABC-2009. ERMS 551679. Carlsbad, NM: Sandia National Laboratories.* [PDF / Author]
Fox, B. 2008. Parameter Summary Report for CRA-2009 (Revision 0). ERMS 549747. Carlsbad, NM: Sandia National Laboratories. [PDF / Author]
Freeze, G.A., K.W. Larson, and P.B. Davies. 1995. Coupled Multiphase Flow and Closure Analysis of Repository Response to Waste-Generated Gas at the Waste Isolation Pilot Plant (WIPP). SAND93-1986. ERMS 229557. Albuquerque, NM: Sandia National Laboratories. [PDF / Author]
Gorham, E., R. Beauheim, P. Davies, S. Howarth, and S. Webb. 1992. "Recommendations to PA on Salado Formation Intrinsic Permeability and Pore Pressure for 40 CFR 191 Subpart B Calculations, June 15, 1992." Preliminary Performance Assessment for the Waste Isolation Pilot Plant, December 1993 (pp. A-49 through A-65). Volume 3, Model Parameters. SAND92-0700/3. Albuquerque, NM: Sandia National Laboratories. [PDF / Author]
Guzowski, R.V. 1990. Preliminary Identification of Scenarios for the Waste Isolation Pilot Plant, Southeastern New Mexico. SAND90-7090. WPO 25771. Albuquerque, NM: Sandia National Laboratories. [PDF / Author]
Hansen, F.D., M.K. Knowles, T.W. Thompson, M. Gross, J.D. McLennan and J.F. Schatz. 1997. Description and Evaluation of a Mechanically Based Conceptual Model for Spall. SAND97-1369. Albuquerque, NM: Sandia National Laboratories. [PDF / Author]
Hansen, C.W., C. Leigh, D. Lord, and J. Stein. 2002. BRAGFLO Results for the Technical Baseline Migration. ERMS 523209. Carlsbad, NM: Sandia National Laboratories. [PDF / Author]
Hansen, C.W., L.H. Brush, M.B. Gross, F.D. Hansen, B. Park, J.S. Stein, and T.W. Thompson. 2003. Effects of Supercompacted Waste and Heterogeneous Waste Emplacement on Repository Performance (Revision 1). ERMS 532475. Carlsbad, NM: Sandia National Laboratories. [PDF / Author]
Hansen, F.D., T.W. Pfeifle, and D.L. Lord. 2003. Parameter Justification Report for DRSPALL (Revision 0). SAND2003-2930. Carlsbad, NM: Sandia National Laboratories. [PDF / Author]
Herrick, C.G., M.D. Schuhen, D.M. Chapin, and D.C. Kicker. 2012. Determining the Hydrodynamic Shear Strength of Surrogate Degraded TRU Waste Materials as an Estimate for the Lower Limit of the Performance Assessment Parameter TAUFAIL. ERMS 558479. Carlsbad, NM: Sandia National Laboratories.* [PDF / Author]
Herrick, C.G. 2013. Memorandum to C Camphouse (Subject: Follow-up to Questions Concerning TAUFAIL Flume Testing Raised during the November 14-15, 2012 Technical Exchange Between the DOE and EPA). 23 January 2013. ERMS 559081. Carlsbad, NM: Sandia National Laboratories.* [PDF / Author]
Hunter, R.L. 1989. Events and Processes for Constructing Scenarios for the Release of Transuranic Waste from the Waste Isolation Pilot Plant, Southeastern New Mexico. SAND89-2546. WPO 27731. Albuquerque, NM: Sandia National Laboratories. [PDF / Author]
James, S.J., and J. Stein. 2002. Analysis Plan for the Development of a Simplified Shaft Seal Model for the WIPP Performance Assessment. AP-094. ERMS 524958. Carlsbad, NM: Sandia National Laboratories. [PDF / Author]
James, S.J., and J. Stein. 2003. Analysis Report for Development of a Simplified Shaft Seal Model for the WIPP Performance Assessment (Rev. 1). ERMS 525203. Carlsbad, NM: Sandia National Laboratories. [PDF / Author]
Kanney, J.F. 2003. Hydrogen Gas as a Surrogate for Waste-Generated Gas Physical Properties in BRAGFLO. Technical Memorandum. ERMS 532900. Carlsbad, NM: Sandia National Laboratories. [PDF / Author]
Kicker, D.C., and T. Zeitler. 2013. Radionuclide Inventory Screening Analysis Report for the 2014 Compliance Recertification Application Performance Assessment. ERMS 559257. Carlsbad, NM: Sandia National Laboratories.* [PDF / Author]
Kicker, D.C., and C. Herrick. 2013. Parameter Summary Report for the 2014 Compliance Recertification Application. Carlsbad, NM: Sandia National Laboratories.* [PDF / Author]
Kirchner, T., T. Zeitler, and R. Kirkes. 2012. Memorandum to S. Dunagan (Subject: Evaluating the Data in Order to Derive a Value for GLOBAL:PBRINE). 11 December 2012. ERMS 558724. Carlsbad, NM: Sandia National Laboratories.* [PDF / Author]
Kirkes, R. 2007. Evaluation of the Duration of Direct Brine Release in WIPP Performance Assessment (Revision 0). ERMS 545988. Carlsbad, NM: Sandia National Laboratories. [PDF / Author]
Leigh, C., J. Kanney, L. Brush, J. Garner, G. Kirkes, T. Lowery, M. Nemer, J. Stein, E. Vugrin, S. Wagner, and T. Kirchner. 2005. 2004 Compliance Recertification Application Baseline Performance Assessment Calculation (Revision 0). ERMS 541521. Carlsbad, NM: Sandia National Laboratories. [PDF / Author]
Long, J.J. 2013. Execution of Performance Assessment Codes for the CRA-2014 Performance Assessment. Carlsbad, NM: Sandia National Laboratories.* [PDF / Author]
Lord, D.L. 2003. Justification for Particle Diameter and Shape Factor used in DRSPALL. ERMS 531477. Carlsbad, NM: Sandia National Laboratories. [PDF / Author]
Lord, D., D. Rudeen, and C. Hansen. 2003. Analysis Package for DRSPALL: Compliance Recertification Application. Part I-Calculation of Spall Volumes. ERMS 532766. Carlsbad, NM: Sandia National Laboratories. [PDF /
Author]
Marcinowski, F. 2000. Letter to Dr. I. Triay, Manager (Subject: Summary of EPA Review of Clay Seam & Mining Plan). 11 August 2000. Washington, DC: U.S. Environmental Protection Agency, Office of Air and Radiation. [PDF / Author]
Marietta, M.G., S.G. Bertram-Howery, D.R. Anderson, K.F. Brinster, R.V. Guzowski, H. Iuzzolino, and R.P. Rechard. 1989. Performance Assessment Methodology Demonstration: Methodology Development for Evaluating Compliance with EPA 40 CFR 191, Subpart B, for the Waste Isolation Pilot Plant. SAND89-2027. WPO 25952. Albuquerque, NM: Sandia National Laboratories. [PDF / Author]
Mendenhall, F.T., and W. Gerstle. 1993. Memorandum to Distribution (Subject: WIPP Anhydrite Fracture Modeling). 6 December 1993. SWCF-A: W.B.S. 1.1.7.1. WPO 39830. Albuquerque, NM: Sandia National Laboratories. [PDF / Author]
National Institute of Standards and Technology (NIST). 1992. NIST Thermophysical Properties of Hydrogen Mixtures Database (SUPERTRAPP) User's Guide (Version 1.0). Gaithersburg, MD: U.S. Department of Commerce, National Institute of Standards and Technology, Standard Reference Data Program. [Author]
Park, B., and F.D. Hansen. 2003. Analysis Report for Determination of the Porosity Surfaces of the Disposal Room Containing Various Waste Inventories for WIPP PA (Revision 0). ERMS 533216. Albuquerque, NM: Sandia National Laboratories. [PDF / Author]
Piper, L.L. 2004. Letter to U.S. Environmental Protection Agency (Subject: Partial Response to Environmental Protection Agency (EPA) September 2, 2004, Letter on Compliance Recertification Application, 6th Response Package, Comment G-12). 23 December 2004. Carlsbad, NM: Carlsbad Field Office. [PDF / Author]
Reed, D.J., J. Swanson, J.-F. Lucchini, and M. Richman. 2013. Intrinsic, Mineral and Microbial Colloid Enhancement Parameters for the WIPP Actinide Source Term. ERMS 559200. LCO-ACP-18. Carlsbad, NM: Los Alamos National Laboratory.* [PDF / Author]
Reyes, J. 2008. Letter to D.C. Moody (Subject: EPA 1.67 to 1.20 Excess Factor Change Approval Letter). 11 February 2008. Washington, DC: U.S. Environmental Protection Agency, Office of Air and Radiation. [PDF / Author]
Roselle, G.T. 2013a. Determination of Corrosion Rates from Iron/Lead Corrosion Experiments to be used for Gas Generation Calculations. ERMS 559077. Carlsbad, NM: Sandia National Laboratories.* [PDF / Author]
Roselle, G.T. 2013b. Summary of Colloid Parameters to be Implemented in the CRA-2014 PA. ERMS 559205. Carlsbad, NM: Sandia National Laboratories.* [PDF / Author]
Schreiber, J.D. 1997. WIPP PA User's Manual for BRAGFLO (Version 4.10, May). ERMS 245238. Carlsbad, NM: Sandia National Laboratories. [PDF / Author]
Stein, J.S. 2003. Memorandum to D. Kessel (Subject: Correlation Between Bulk Compressibility and Porosity in the Castile Brine Pocket as Modeled in BRAGFLO). April 2003. ERMS 527293. Carlsbad, NM: Sandia National Laboratories. [PDF / Author]
Stein, J.S., and W. Zelinski. 2003a. Analysis Plan for the Testing of a Proposed BRAGFLO Grid to be Used for the Compliance Recertification Application Performance Assessment Calculations. AP-106. ERMS 525236. Carlsbad, NM: Sandia National Laboratories. [PDF / Author]
Stein, J.S., and W. Zelinski. 2003b. Analysis Report for: Testing of a Proposed BRAGFLO Grid to be used for the Compliance Recertification Application Performance Assessment Calculations. ERMS 526868. Carlsbad, NM: Sandia National Laboratories. [PDF / Author]
Tierney, M.S. 1991. Combining Scenarios in a Calculation of the Overall Probability Distribution of Cumulative Releases of Radioactivity From the Waste Isolation Pilot Plant, Southeastern New Mexico. SAND90-0838. WPO 26030. Albuquerque, NM: Sandia National Laboratories. [PDF / Author]
Triay, I. 2000. Letter to Mr. F. Marcinowski, Director (Subject: Plans to Raise the Repository Horizon). June 26, 2000. Carlsbad, NM: U.S. Department of Energy, Carlsbad Field Office. [PDF / Author]
U.S. Department of Energy (DOE). 1980. Final Environmental Impact Statement, Waste Isolation Pilot Plant (October). 2 vols. DOE/EIS-0026. ERMS 238835 (vol. 1) and ERMS 238838 (vol. 2). Washington, DC: U.S. Department of Energy. [PDF / Author]
U.S. Department of Energy (DOE). 1996. Title 40 CFR Part 191 Compliance Certification Application for the Waste Isolation Pilot Plant (October). 21 vols. DOE/CAO 1996-2184. Carlsbad, NM: Carlsbad Area Office. [Author]
U.S. Department of Energy (DOE). 2002. Assessment Of Impacts On Long-Term Performance From Supercompacted Wastes Produced By The Advanced Mixed Waste Treatment Project (December 6). Carlsbad, NM: Carlsbad Area Office. [PDF / Author]
U.S. Department of Energy (DOE). 2004. Title 40 CFR Part 191 Compliance Recertification Application for the Waste Isolation Pilot Plant (March). 10 vols. DOE/WIPP 2004-3231. Carlsbad, NM: Carlsbad Field Office. [Author]
U.S. Department of Energy (DOE). 2009. Title 40 CFR Part 191 Compliance Recertification Application for the Waste Isolation Pilot Plant. DOE/WIPP 09-3424. Carlsbad, NM: Carlsbad Field Office.* [Author]
U.S. Department of Energy (DOE). 2010. Quality Assurance Program Document. DOE/CBFO-94-1012. Carlsbad, NM: Carlsbad Field Office.* [PDF / Author]
U.S. Department of Energy (DOE). 2011a. Panel Closure System Design, Planned Change Request to the EPA 40 CFR Part 194 Certification of the Waste Isolation Pilot Plant. DOE/CBFO-11-3479. Carlsbad, NM: Carlsbad Field Office.* [PDF / Author]
U.S. Department of Energy (DOE). 2011b. Letter to J. Edwards, Director (Subject: Notification of Intent to Begin the Salt Disposal Investigations). 11 August 2011. Carlsbad, NM: Carlsbad Field Office.* [PDF / Author]
U.S. Department of Energy (DOE). 2012. Delaware Basin Monitoring Annual Report (September 2012). DOE/WIPP-12-2308. Carlsbad, NM: Carlsbad Field Office.* [PDF / Author]
U.S. Environmental Protection Agency (EPA). 1993. "40 CFR Part 191: Environmental Radiation Protection Standards for the Management and Disposal of Spent Nuclear Fuel, High-Level and Transuranic Radioactive Wastes; Final Rule." Federal Register, vol. 58 (December 20, 1993): 66398-416. [PDF /
Author]
U.S. Environmental Protection Agency (EPA). 1996. "40 CFR Part 194: Criteria for the Certification and Recertification of the Waste Isolation Pilot Plant's Compliance with the 40 CFR Part 191 Disposal Regulations; Final Rule." Federal Register, vol. 61 (February 9, 1996): 5223-45. [PDF /
Author]
U.S. Environmental Protection Agency (EPA). 1998a. "40 CFR Part 194: Criteria for the Certification and Recertification of the Waste Isolation Pilot Plant's Compliance with the 40 CFR Part 191 Disposal Regulations: Certification Decision; Final Rule." Federal Register, vol. 63 (May 18, 1998): 27353-406. [PDF /
Author]
U.S. Environmental Protection Agency (EPA). 1998b. Technical Support Document for 194.23: Parameter Justification Report (May). Washington DC: Office of Radiation and Indoor Air. [PDF / Author]
U.S. Environmental Protection Agency (EPA). 2004. "40 CFR Part 194: Criteria for the Certification and Recertification of the Waste Isolation Pilot Plant's Compliance with the Disposal Regulations; Alternative Provisions" (Final Rule). Federal Register, vol. 69 (July 16, 2004): 42571-83. [PDF /
Author]
U.S. Environmental Protection Agency (EPA). 2006. "40 CFR Part 194: Criteria for the Certification and Recertification of the Waste Isolation Pilot Plant's Compliance with the Disposal Regulations: Recertification Decision" (Final Notice). Federal Register, vol. 71 (April 10, 2006): 18010-021. [PDF /
Author]
U.S. Environmental Protection Agency (EPA). 2010a. "40 CFR Part 194 Criteria for the Certification and Recertification of the Waste Isolation Pilot Plant's Compliance With the Disposal Regulations: Recertification Decision." Federal Register, No. 222, Vol. 75, pp. 70584-70595, November 18, 2010.* [PDF / Author]
U.S. Environmental Protection Agency (EPA). 2010b. Technical Support Document for Section 194.24, Evaluation of the Compliance Recertification Actinide Source Term, Backfill Efficacy and Culebra Dolomite Distribution Coefficient Values (Revision 1), November 2010.* [PDF / Author]
U.S. Environmental Protection Agency (EPA). 2011. Letter from Jonathan Edwards to Ed Ziemianski dated November 17, 2011.* [PDF / Author]
Van Soest, G.D. 2012. Performance Assessment Inventory Report - 2012. LA-UR-12-26643. Carlsbad, NM: Los Alamos National Laboratory.* [PDF /
Author]
Vaughn, P., M. Lord, and R. MacKinnon. 1995a. Memorandum to D.R. Anderson (Subject: DR-6: Brine Puddling in the Repository due to Heterogeneities). 21 December 1995. SWCF-A:1.1.6.3. WPO 30795. Albuquerque, NM: Sandia National Laboratories. [PDF / Author]
Vaughn, P., M. Lord, and R. MacKinnon. 1995b. Memorandum to D.R. Anderson (Subject: DR-7: Permeability Varying with Porosity in Closure Regions). 21 December 1995. SWCF-A:1.1.6.3. WPO 30796. Albuquerque, NM: Sandia National Laboratories. [PDF / Author]
Vaughn, P., M. Lord, and R. MacKinnon. 1995c. Memorandum to D. R. Anderson (Subject: DR3: Dynamic Closure of the North End and Hallways). 28 September 1995. SWCF-A:1.1.6.3. WPO 30798. Albuquerque, NM: Sandia National Laboratories. [PDF / Author]
Vaughn, P., M. Lord, and R. MacKinnon. 1995d. Memorandum to D.R. Anderson (Subject: DR-2: Capillary Action [Wicking] within the Waste Materials). 21 December 1995. SWCF-A:1.1.6.3. WPO 30793. Albuquerque, NM: Sandia National Laboratories. [PDF / Author]
Vaughn, P., M. Lord, and R. MacKinnon. 1995e. Memorandum to D.R. Anderson (Subject: S-6: Dynamic Alteration of the DRZ/Transition Zone). 28 September 1995. WPO 30798. Albuquerque, NM: Sandia National Laboratories. [PDF /
Author]
Vaughn, P., M. Lord, J. Garner, and R. MacKinnon. 1995. Memorandum to D.R. Anderson (Subject: FEP Screening Issue GG-1). 10 October 1995. ERMS 230791. Albuquerque, NM: Sandia National Laboratories. [PDF / Author]
Vugrin, E.D. 2004. Memorandum to David Kessel (Subject: Container-Scale Variability and DRSPALL in response to C-23-10, Rev 1). 15 November 2004. ERMS 537870. Carlsbad, NM: Sandia National Laboratories. [PDF / Author]
Wagner, S.W. 2008. Reassessment of MONPAR Analysis for Use in the 2009 Compliance Recertification Application. ERMS 548948. Carlsbad, NM: Sandia National Laboratories. [PDF / Author]
Wagner, S.W. 2011. Compliance Monitoring Parameter Assessment, and Recommendations. ERMS 554957. Carlsbad, NM: Sandia National Laboratories.* [PDF / Author]
Wall, N.A., and D. Enos. 2006. Iron and Lead Corrosion in WIPP-Relevant Conditions, TP 06-02, Rev 1. ERMS 543238. Carlsbad, NM: Sandia National Laboratories.* [PDF / Author]
Wallace, M. 1996. "Summary Memo of Record for NS-11: Subsidence Associated with Mining Inside or Outside the Controlled Area." Records Package for Screening Effort NS-11: Subsidence Associated with Mining Inside or Outside the Controlled Area (November 21) (pp. 1-28). ERMS 412918. Albuquerque, NM: Sandia National Laboratories. [PDF /
Author]
Wang, H.F., and M.P. Anderson. 1982. Introduction to Groundwater Modeling: Finite Difference and Finite Element Methods. New York: Academic Press. [Author]
Wang, Y. 1997. Memorandum to Margaret Chu (Subject: Estimate WIPP Waste Particle Sizes on Expert Elicitation Results: Revision 1). 5 August 1997. ERMS 246936. Albuquerque, NM: Sandia National Laboratories. [PDF / Author]
Webb, S. 1995. Memorandum to D.R. Anderson (Subject: DR-1:3D Room Flow Model with Dip). 30 May 1995. SWCF-A:1.1.6.3. WPO 22494. Albuquerque, NM: Sandia National Laboratories. [PDF / Author]
WIPP Performance Assessment. 1991. Preliminary Comparison with 40 CFR Part 191, Subpart B, for the Waste Isolation Pilot Plant, December 1991. 4 vol. SAND91-0893/1-4. Albuquerque, NM: Sandia National Laboratories. [PDF /
Author]
WIPP Performance Assessment. 1993. Preliminary Performance Assessment for the Waste Isolation Pilot Plant, December 1992. Volume 4: Uncertainty and Sensitivity Analyses for 40 CFR 191, Subpart B. SAND92-0700/4. ERMS 223528. Albuquerque, NM: Sandia National Laboratories. [PDF / Author]
WIPP Performance Assessment. 2003a. Design Document for DRSPALL Version 1.00 (Version 1.10, September). ERMS 529878. Carlsbad, NM: Sandia National Laboratories. [PDF / Author]
WIPP Performance Assessment. 2003b. Verification and Validation Plan and Validation Document for DRSPALL Version 1.00 (Version 1.00, September). ERMS 524782. Carlsbad, NM: Sandia National Laboratories. [PDF / Author]